
Abstract
Class I-restricted T cell-associated molecule (CRTAM) is an activation marker expressed on the cell surface of activated invariant natural killer T (iNKT) cells, CD8+ T cells, and a small subset of CD4+ T cells. CRTAM has also been associated with a proinflammatory profile in murine CD4+ T cells. However, CRTAM has not been thoroughly explored in human cells. This work focused on evaluating CRTAM expression in human iNKT lymphocytes after activation with α-galactosylceramide, its widely used specific glycolipid antigen. We also analyzed the involvement of costimulatory molecules in CRTAM expression and whether CRTAM expression is associated with a specific effector cytokine profile. We found that the signal produced by invariant T cell receptor (iTCR) engagement with α-galactosylceramide is sufficient to trigger CRTAM expression on human iNKT cells after 18 h of stimulation. Moreover, we observed a clear association between CRTAM expression and IFN-γ production in iNKT cells from healthy subjects and patients with type 1 diabetes. However, blocking the engagement of costimulatory molecules, such as CD40, CD80, and CD86, did not modify CRTAM expression. These results indicate that CRTAM may also play a role in triggering the production of IFN-γ in human iNKT cells and that CRTAM could be used as a marker to identify these inflammatory cells.
Introduction
C
In the mouse, CRTAM expression identifies an activated CD4+ T lymphocyte subpopulation with a proinflammatory (IFN-γ and IL-17/IL-22) cytokine profile, maintains resident gut CD4+CD8+ T cells at a steady state, and supports the maintenance of gut IL-17+ CD4+ T cells during parasitic infection (Yeh and others 2008; Cortez and others 2014). Very recently, Takeuchi and others (2015) reported that murine and human CRTAM+ CD4+ T cells secrete IFN-γ, express cytotoxic T lymphocyte (CTL)-related genes, and exhibit cytotoxic function. Moreover, the expression of CRTAM has been correlated with cellular processes such as adhesion, development, cytotoxicity, residency, and polarity establishment and retention during the late phase of T cell activation (Boles and others 2005; Galibert and others 2005; Takeuchi and others 2009, 2015; Medina-Contreras and others 2010; Cortez and others 2014). Despite its likely participation in inflammatory immune response, the role of CRTAM in in vivo pathological scenarios has not been thoroughly explored.
iNKT cells were one of the first cell populations in which the expression of CRTAM was described (Kennedy and others 2000). iNKT cells represent a minor T lymphocyte subset (0.01%–1.5% in human peripheral blood) that coexpresses an invariant T cell receptor (iTCR) with Vα24Jα18 and Vβ11 chains in humans and characteristic surface markers of natural killer cells, such as CD161, CD122, CD16, and CD56 (Fowlkes and others 1987; Hammond and others 1999). These cells have a “preactivated” or “memory” state, which allows them to respond by rapidly producing large amounts of cytokines within hours after being activated (Stetson and others 2003; Brennan and others 2013). iNKT cells recognize glycolipid antigens (Ag) presented by CD1d, a conserved, nonpolymorphic MHC class I-like molecule expressed on antigen-presenting cells (APCs) (Bendelac and others 1995). α-Galactosylceramide (αGalCer), the first specific and potent lipid Ag identified for iNKT cells, has been widely used to explore the effector responses of this unconventional T cell subset (Kawano and others 1997).
The activation of iNKT cells by this potent lipid leads to the simultaneous production of both pro- and anti-inflammatory cytokines. Although there have been many attempts to skew the iNKT cell response in a T helper-polarized manner, iNKT cells are able to produce more than one type of cytokine, but this is dependent on the lipid-Ag load on the CD1d molecule as well as presentation by different APCs (Sullivan and others 2010; Bai and others 2012; Rossjohn and others 2012). Therefore, iNKT cells have been implicated in the progression and resolution of several pathologies, including infectious and allergic diseases, cancer, and autoimmune diseases such as type 1 diabetes (T1D) and lupus (Esteban and others 2003; Lehuen and others 2010). This study explores the signals required to induce the expression of CRTAM on human iNKT cells and whether this expression is associated with the production of a proinflammatory cytokine profile by this cell population in an autoimmune disease such as T1D.
Materials and Methods
Reagents
Recombinant human granulocyte-macrophage colony-stimulating factor (rGM-CSF), interleukin-4 (rIL-4), and tumor necrosis factor-α (rTNF-α) were acquired from PeproTech (Rocky Hill, NJ). The antibodies used were functional grade, purified anti-human CD154 (CD40 ligand) (eBioscience, San Diego, CA); monoclonal anti-human CD80 and CD86 (R&D Systems, Minneapolis, MN); and functional grade, purified mouse IgG1 isotype control (eBioscience). KRN7000 (αGalCer) was acquired from Enzo Life Sciences (Plymouth Meeting, PA). Phorbol myristate acetate (PMA) and ionomycin were purchased from Sigma-Aldrich (St. Louis, Missouri). The following monoclonal antibodies were purchased to stain the surface molecules: FITC-labeled anti-CD14 (clone 61B3; eBioscience); FITC-labeled anti-HLA-DR (clone B812.2; Beckman Coulter, Brea, CA); PECy5-labeled anti-HLA-ABC (clone W6/32; eBioscience); FITC-labeled anti-CD80 (clone BB1; BD Bioscience, Franklin Lakes, NJ); PE-labeled anti-CD83 (clone HB15e; BD Bioscience); APC-labeled anti-CD86 [clone 2331 (FUN-1); BD Bioscience]; PE-labeled anti-CD40 (clone 5C3; BD Bioscience); PE-labeled anti-CD1d (clone 51.1; BD Bioscience); PE-labeled anti-CD1a (clone CTB6; Santa Cruz Biotechnology, CA); PE-labeled anti-TCR Vα24-Jα18 (iNKT cell) (clone 6B11; BioLegend, San Diego, CA); Horizon V500-labeled anti-CD3 (clone UCHT1; BD Bioscience); PE-labeled anti-CD4 (clone RPA-T4; BioLegend); Pacific Blue-labeled anti-CD8 (clone RPA-T8; BioLegend); APC-labeled anti-CRTAM (clone 210213; R&D Systems); and PETR-labeled anti-CD69 (clone TP1.55.3; Beckman Coulter).
To identify nectin-like-2 (Necl-2, also known as Cadm1, IgSF4, or Tslc1) on the surface of monocyte-derived dendritic cells (moDCs), these cells were incubated with a chimeric protein consisting of the extracellular domain of human CRTAM and a tag of 6 histidine (hCRTAM-His6). The histidine tag was used for purification of the hCRTAM-His6 through an affinity HisTrapHP column (GE Healthcare, Uppsala, Sweden) according to the manufacturer's instructions. The binding of hCRTAM-His6 revealed the presence of Necl-2. hCRTAM-His6 bond with Necl-2 was identified with the APC-labeled anti-CRTAM antibody (clone 210213; R&D Systems). As corresponding isotypes, the following monoclonal antibodies were used: FITC-labeled IgG2a (clone HOPC1; Beckman Coulter); APC-labeled IgG2b (clone 133303; R&D Systems); FITC/PE/PB/PECy7-labeled IgG1 (clone MOPC-21; BioLegend); PETR-labeled IgG1 (clone MPC-11; Beckman Coulter); and Horizon V500-labeled IgG1 (clone X40; BD Bioscience). For intracellular cytokine staining, the following monoclonal antibodies were used: PECy7-labeled anti-IL-4 (clone 8D4-8; eBioscience) and FITC- and PECy7-labeled anti-IFN-γ (clone 4S.B3; BioLegend).
Peripheral blood mononuclear cell isolation and cultures
Whole blood or “buffy coats” from healthy donors were obtained from the blood bank at Pemex Hospital. Peripheral blood mononuclear cells (PBMCs) were isolated using a Ficoll-Paque density gradient (GE Healthcare Bio-Sciences AB, Uppsala, Sweden). Monocytes were isolated via MACS cell separation (Miltenyi Biotech, Bergisch Gladbach, Germany) using human CD14+ microbeads according to the manufacturer's instructions (Supplementary Fig. S1; Supplementary Data are available online at
For the blocking experiments, anti-CD40, anti-CD80, and anti-CD86 monoclonal antibodies (10 μg/mL) were added to the cultures alone or in combination. Samples from 17 patients with T1D and 10 control subjects were obtained from the Pediatrics Hospital of the “Centro Medico Nacional Siglo XXI, IMSS.” All the subjects or their legal guardians signed informed consent forms before the blood sample collection. Approval for this research study was obtained from the Ethics Committee of “Centro Medico Nacional Siglo XXI, IMSS.” Freshly isolated PBMCs from patients with T1D or control subjects were cultured at a density of 5 × 10⁶ cells/mL for 18 h and stimulated either with or without 100 ng/mL of soluble αGalCer or with PMA (1 ng/mL) and ionomycin (200 ng/mL) in RPMI 1640 medium with 10% FBS. For intracellular cytokine detection, 10 ng/mL of Brefeldin A (Sigma-Aldrich) was added to the cultures for the final 4 h of incubation.
Flow cytometry
Cell viability was determined using Trypan blue exclusion. For FcR blocking purposes, cells were incubated with human gammaglobulins for 15 min at 4°C. Then, the cells were washed and immediately labeled with specific antibodies or isotype controls. Permeabilizing solution 2 (1×) (BD Biosciences) was used for intracellular cytokine staining, according to the manufacturer's instructions, followed by incubation with the appropriate antibodies. After incubation, the cells were washed with PBS/2% FBS and fixed with 4% paraformaldehyde in PBS. The stained cells were analyzed with a CyAn ADP flow cytometer (Beckman Coulter), and ∼1 × 10⁶ events were acquired for each sample. The data were analyzed with FlowJo software (v.7.6.5; Tree Star, Inc., Ashland, OR). Lymphocytes were gated based on their light-scattering properties. The iNKT cell percentage was obtained by gating on CD3+6B11+ cells. The gating strategy is shown in Supplementary Fig. S3. The MFI of the entire iNKT subset was used to determine CRTAM and CD69 expression levels. The differences between the samples were calculated as the fold increase in MFI from their respective isotype controls.
Statistical analysis
Statistics was calculated using the following tests in GraphPad Prism Software v5 (GraphPad Prism Software, Inc., La Jolla, CA): a two-tailed Wilcoxon matched-pairs test was used for the stimulated samples and the coculture experiments; an unpaired two-tailed Mann–Whitney U-test was used to compare the patient and control samples; and a one-way analysis of variance was used for the blocking experiments. Statistical significance was set at P < 0.05.
Results
Antigen-specific stimuli induce CRTAM expression on iNKT cells from healthy subjects
iNKT cells express activation markers even under unstimulated conditions (Hammond and others 1999). Thus, we first analyzed CRTAM expression on iNKT cells from healthy donors under basal conditions and after Ag-specific stimulation. We cocultured PBMCs with autologous αGalCer-pulsed moDCs for 18 h. The activated iNKT cell phenotype was confirmed by upregulating CD69 and cytokine production. As previously described, we determined that nonstimulated iNKT cells express CD69 (Fig. 1A). This expression increased 4-fold (MFI) after αGalCer-specific stimulation (Fig. 1B) (P = 0.0005). Forty-eight and one-half percent of the stimulated iNKT cells expressed CD69, whereas 27.6% of the unstimulated cells showed expression of this activation marker (P = 0.008). In contrast, CRTAM was not expressed on unstimulated iNKT cells but was induced in 25.5% of these cells, increasing 3-fold (MFI) after stimulation (P = 0.002) (Fig. 1A, B). Moreover, stimulation caused the percentage of IFN-γ-producing iNKT cells to increase from 1.9% to 12.3% (P = 0.0001) and the percentage of IL-4-producing iNKT cells to increase from 2% to 10.9% (P = 0.002) (Fig. 1C, D).
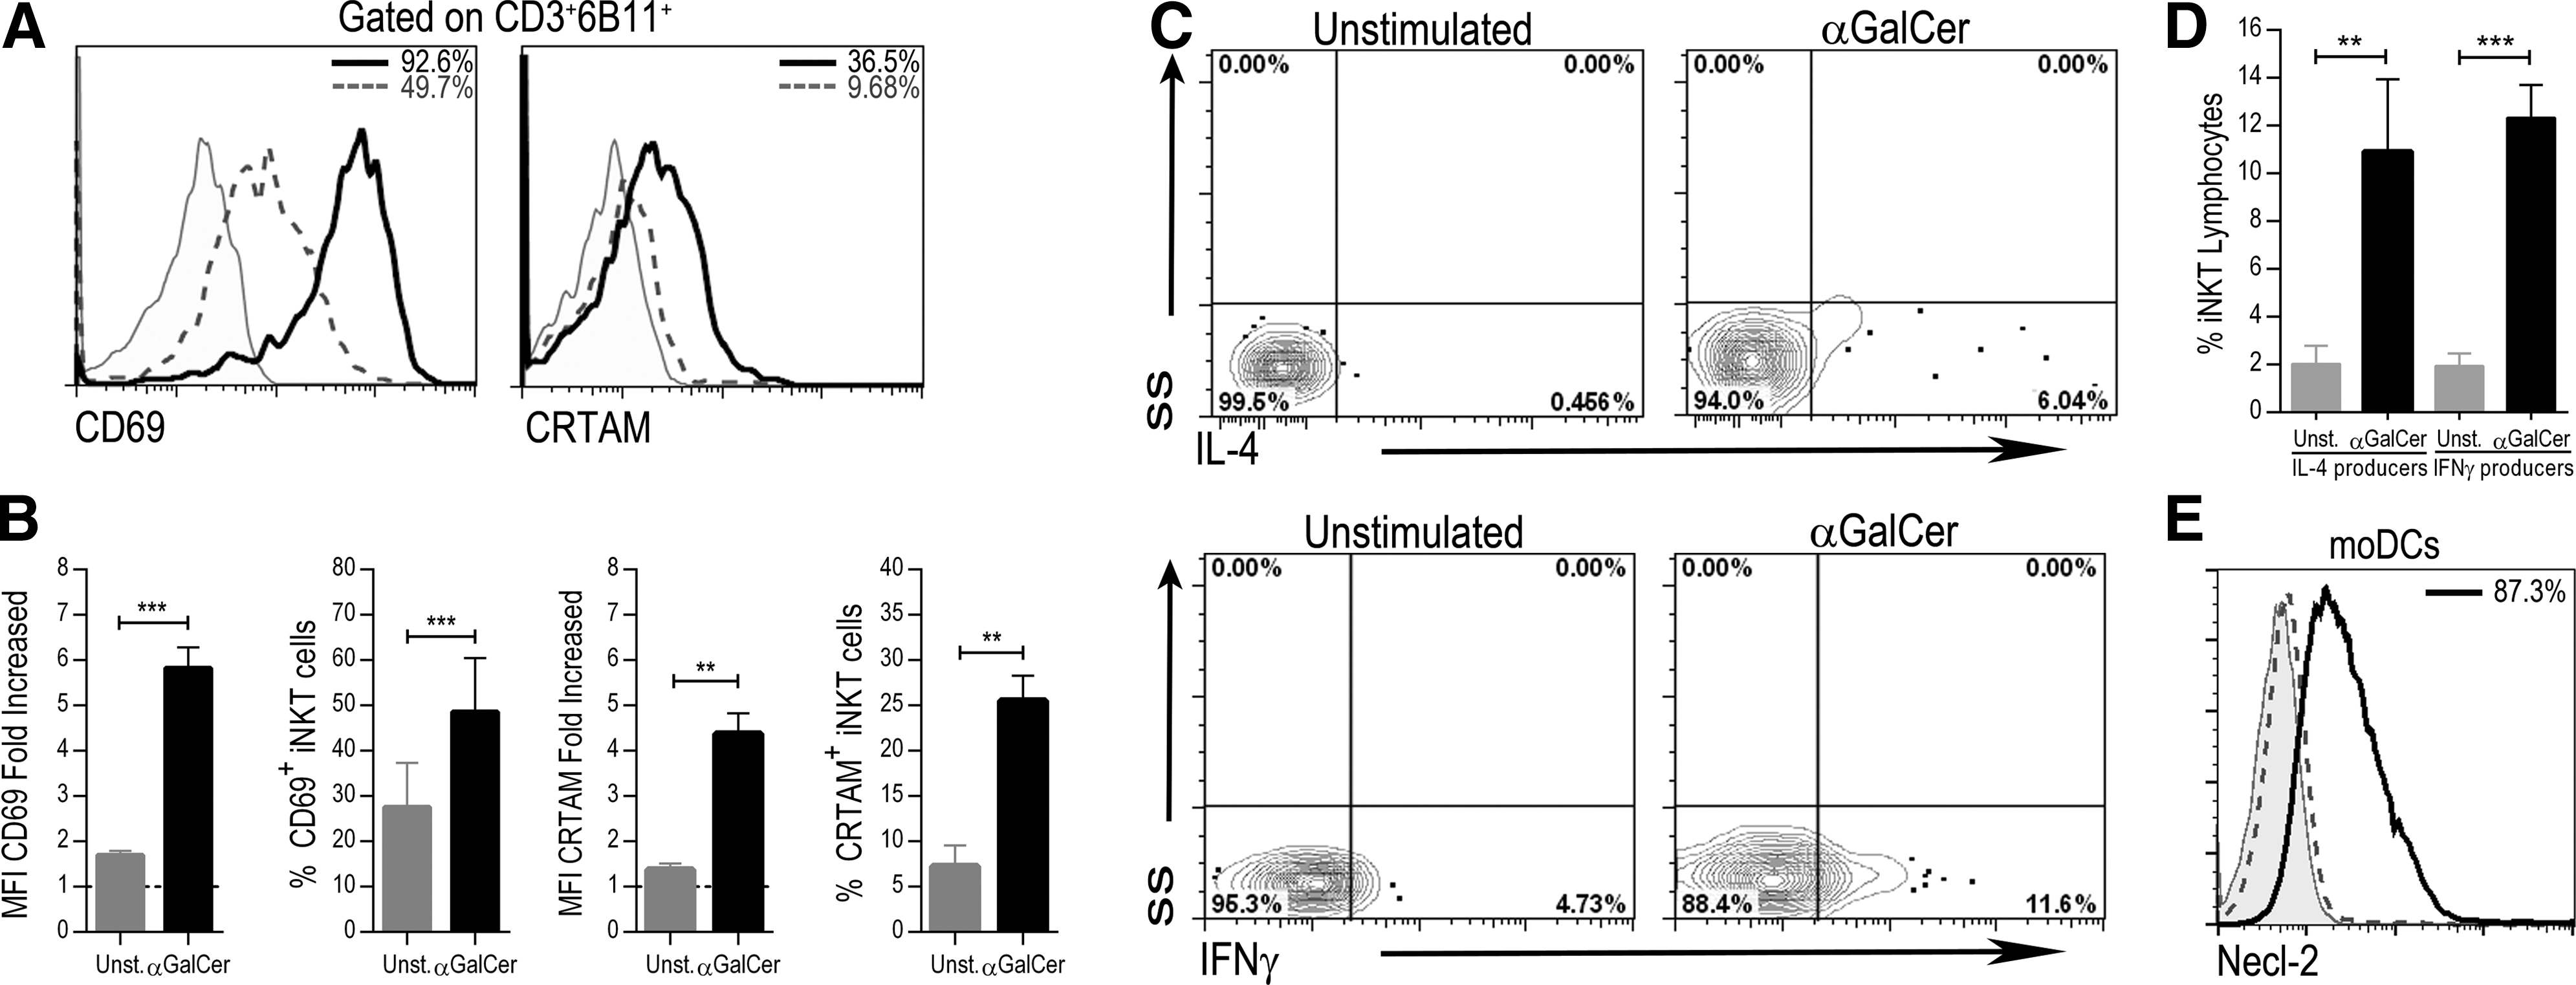
αGalCer induces CRTAM expression on iNKT cells from healthy donors. PBMCs from healthy donors were cocultured with autologous αGalCer-pulsed moDCs. After 18 h, the expression of activation markers and intracellular cytokines was assessed with flow cytometry.
These results demonstrate that an Ag-specific stimulus induces CRTAM expression on iNKT lymphocytes from healthy subjects. Necl-2, the ligand of CRTAM, has been described on mouse small intestine and lymph node DCs, whereas in humans, this molecule has been described only on BDCA3+ DCs from peripheral blood. Thus, we analyzed whether moDCs express Necl-2. As shown in Fig. 1E, this protein was present on the surface of 87.3% of moDCs.
CRTAM expression identifies IFN-γ-producing iNKT cells from healthy subjects
In mouse models, CRTAM expression has been associated with a proinflammatory profile (IFN-γ, IL-17, IL-22) in CD4+ T cells stimulated with anti-CD3/anti-CD28 (Yeh and others 2008; Takeuchi and others 2015). Nevertheless, this association has not been evaluated in other T cell subsets. Thus, once we confirmed that an Ag-specific stimulus induced CRTAM expression on iNKT lymphocytes, we analyzed whether there was any difference in the production of 2 main iNKT cell cytokines, IFN-γ and IL-4, between CRTAM+ and CRTAM− iNKT cells. As discussed above, iNKT cells can simultaneously produce cytokines such as IFN-γ (proinflammatory) and IL-4 (anti-inflammatory). Figure 2A shows a representative contour graph of the intracellular staining for IFN-γ- and IL-4-producing iNKT cells based on their CRTAM expression. We observed that CRTAM expression identified a higher percentage (18.3%) of IFN-γ-producing cells than CRTAM− iNKT cells (7.3%) (Fig. 2B) (P = 0.0001). This difference was not observed in the IL-4-producing iNKT cells, regardless of CRTAM expression (9.9% for expressing cells versus 12% for nonexpressing cells) (P = 0.29).
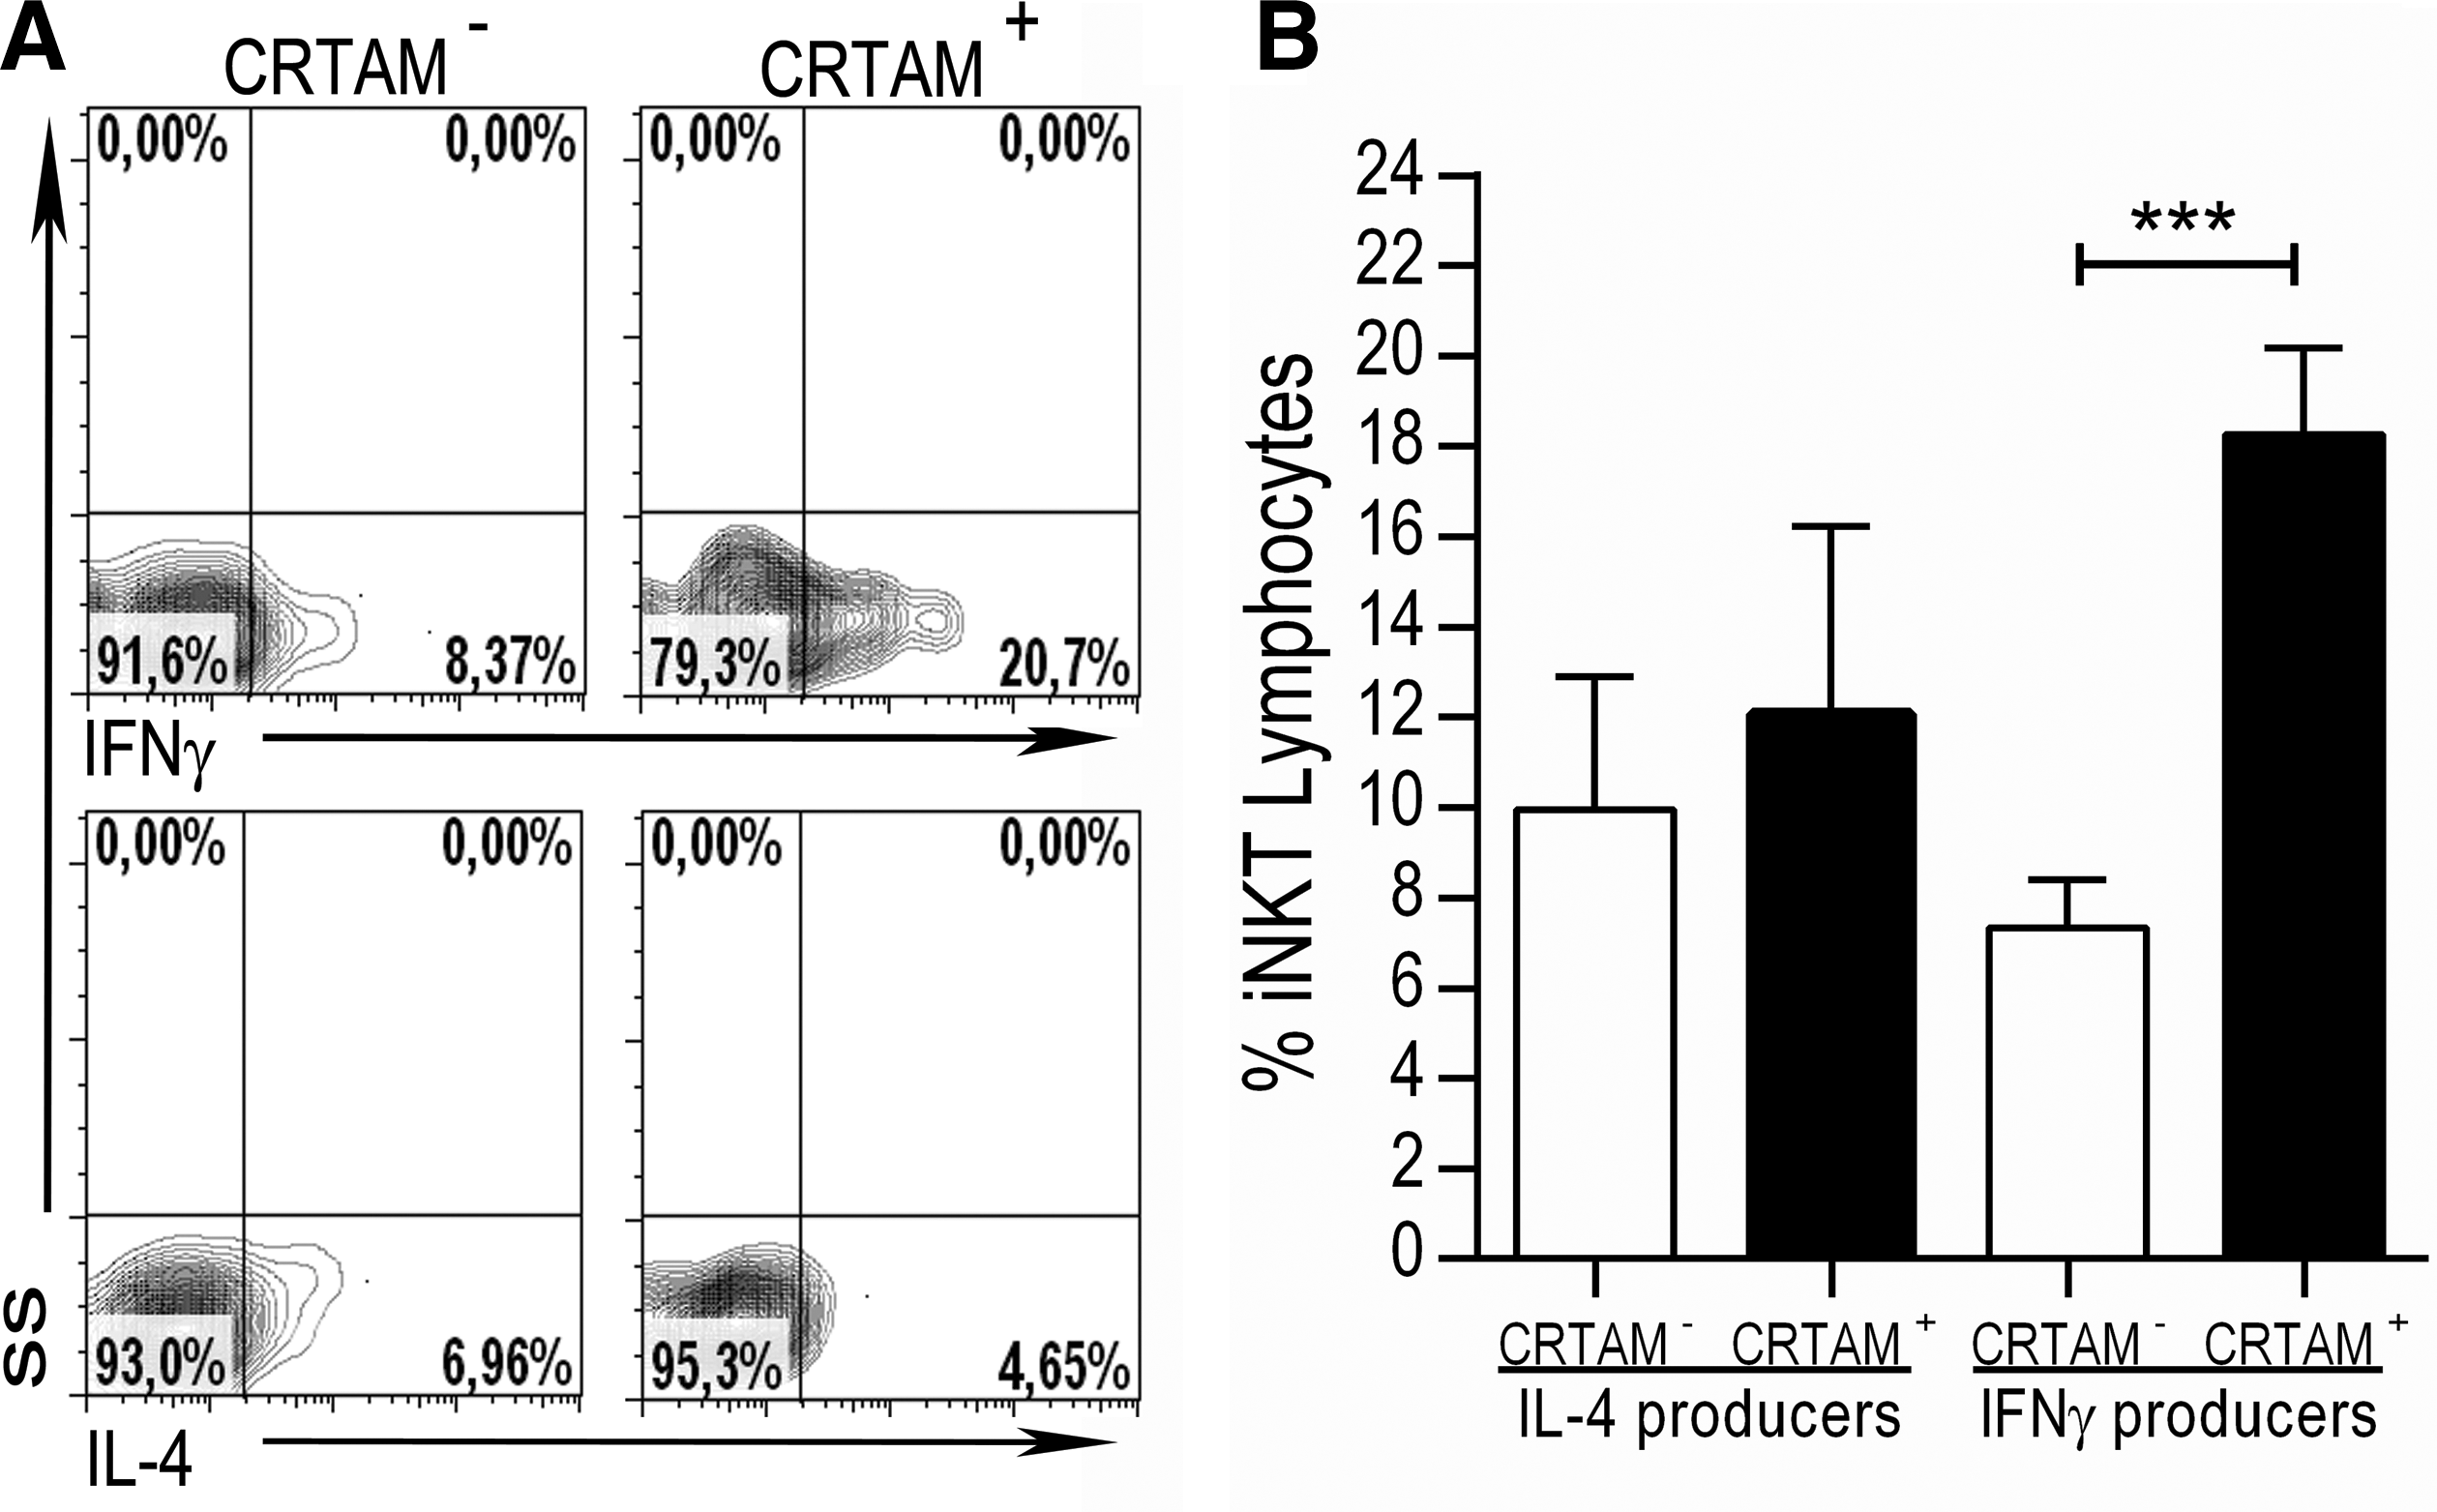
CRTAM expression identifies IFN-γ-producing iNKT cells from healthy donors.
CRTAM expression does not require costimulatory molecules
To further characterize the signaling requirements for iNKT cells to express CRTAM, we analyzed whether costimulatory molecules participate in its induction. We cocultured PBMCs from healthy donors with autologous αGalCer-pulsed moDCs in the presence of monoclonal blocking antibodies against CD40L, CD80, and CD86 alone or in combination. The expression of CRTAM, assessed either as an increase in MFI or as the percentage of CRTAM+ iNKT cells, did not change significantly under blocking conditions (P > 0.05). However, a mild decrease in CRTAM expression was detected when either CD40L alone or the 3 costimulatory molecules (CD40L, CD80, and CD86) were blocked (Fig. 3A, B).

Blocking costimulatory molecules does not impair CRTAM expression. The bar graphs show the increased MFI of CRTAM
Furthermore, we analyzed the impact of blocking costimulatory molecules on the activation of iNKT cells. As expected, a substantial decrease in CD69 expression was observed when these molecules were blocked. As shown Fig. 3C and D, treatment with anti-CD40L (P = 0.05) or the combination of anti-CD40L, anti-CD80, and anti-CD86 (P = 0.03) blocking antibodies caused a 4-fold reduction in the MFI of CD69 (P = 0.008) and a 10% reduction in the number of iNKT cells expressing CD69. It is worth mentioning that no changes in the expression of CRTAM were observed when iNKT cells and moDCs were cocultured in the presence of an anti-IFNγ neutralizing monoclonal antibody (data not shown). This result strongly suggests that IFNγ does not induce CRTAM expression.
Regarding the effector phenotype, previous reports (Hayakawa and others 2001; Fujii and others 2004) have shown a decrease in the frequency of IFN-γ-producing iNKT cells under any of the blockade conditions. However, we only observed a significant decrease in IFN-γ-producing iNKT cells when we simultaneously blocked CD80/CD86 or CD80/CD86 and CD40L (P = 0.004 and P = 0.02, respectively) (Fig. 3E). No significant changes in the IL-4-producing iNKT cells were observed under any of the conditions analyzed (Fig. 3F).
CRTAM+ IFN-γ-producing iNKT cells depend on costimuli
We showed that CRTAM expression identifies IFN-γ-producing iNKT cells. However, while there were no significant changes in CRTAM expression on total iNKT cells after the blockade of costimulatory molecules (Fig. 3A), there was an important decrease in the percentage of IFN-γ-producing iNKT cells (Fig. 3E). Thus, we sought to determine whether the decreased frequency of IFN-γ-producing iNKT cells was associated with CRTAM expression. We analyzed the IFN-γ-producing iNKT cells based on their CRTAM expression. As shown in Fig. 4A, the percentage of CRTAM+ IFN-γ+ iNKT cells (P < 0.05) decreased under all the blockade conditions, while the percentage of CRTAM− IFN-γ+ iNKT cells did not change (P > 0.05) (Fig. 4B). Remarkably, we did not find differences in the percentages of IL-4-producing iNKT cells in the CRTAM+ and CRTAM− populations (Fig. 4C, D).

Blocking costimulatory molecules modifies the frequency of IFN-γ-producing CRTAM+ iNKT cells. The bar graphs display the percentage of IFN-γ- or IL-4-producing cells on CRTAM+
CRTAM+ iNKT cells exhibit a proinflammatory profile in patients with T1D
As demonstrated, the expression of CRTAM is clearly associated with IFN-γ production in iNKT cells from healthy subjects. Next, we investigated whether the same phenomenon is observed in a pathologic scenario such as T1D. We examined the in vitro response of iNKT cells from 17 patients with T1D and 10 healthy controls after 18 h of Ag-specific stimulation with αGalCer. We evaluated CRTAM and CD69 expression with flow cytometry, and effector function was evaluated through intracellular cytokine staining. The results of the CRTAM and CD69 expression analysis are summarized in Table 1. As shown in Fig. 5A and B, both activation molecules were upregulated to a similar order of magnitude after stimulation. We did not observe differences in the CRTAM expression on iNKT cells from patients with T1D and controls. Although the iNKT cells from the patients displayed higher CD69 expression compared with the cells from the controls, this difference was not significant (P = 0.079). We also evaluated the frequency of cytokine-producing iNKT cells and found a clear proinflammatory profile in the cells of the patients with T1D (Table 1), as previously reported (Wilson and others 1998; Kent and others 2005; Kis and others 2007). After stimulation, there was a higher percentage of IFN-γ-producing iNKT cells (Fig. 5C) from the patients (14.1%) than the controls (6.9%); however, this increase was not significant. In contrast, we detected a lower frequency of IL-4-producing iNKT cells in the patients (9.1%) than in the controls (17.4%) (P = 0.0064), as shown in Fig. 5D.
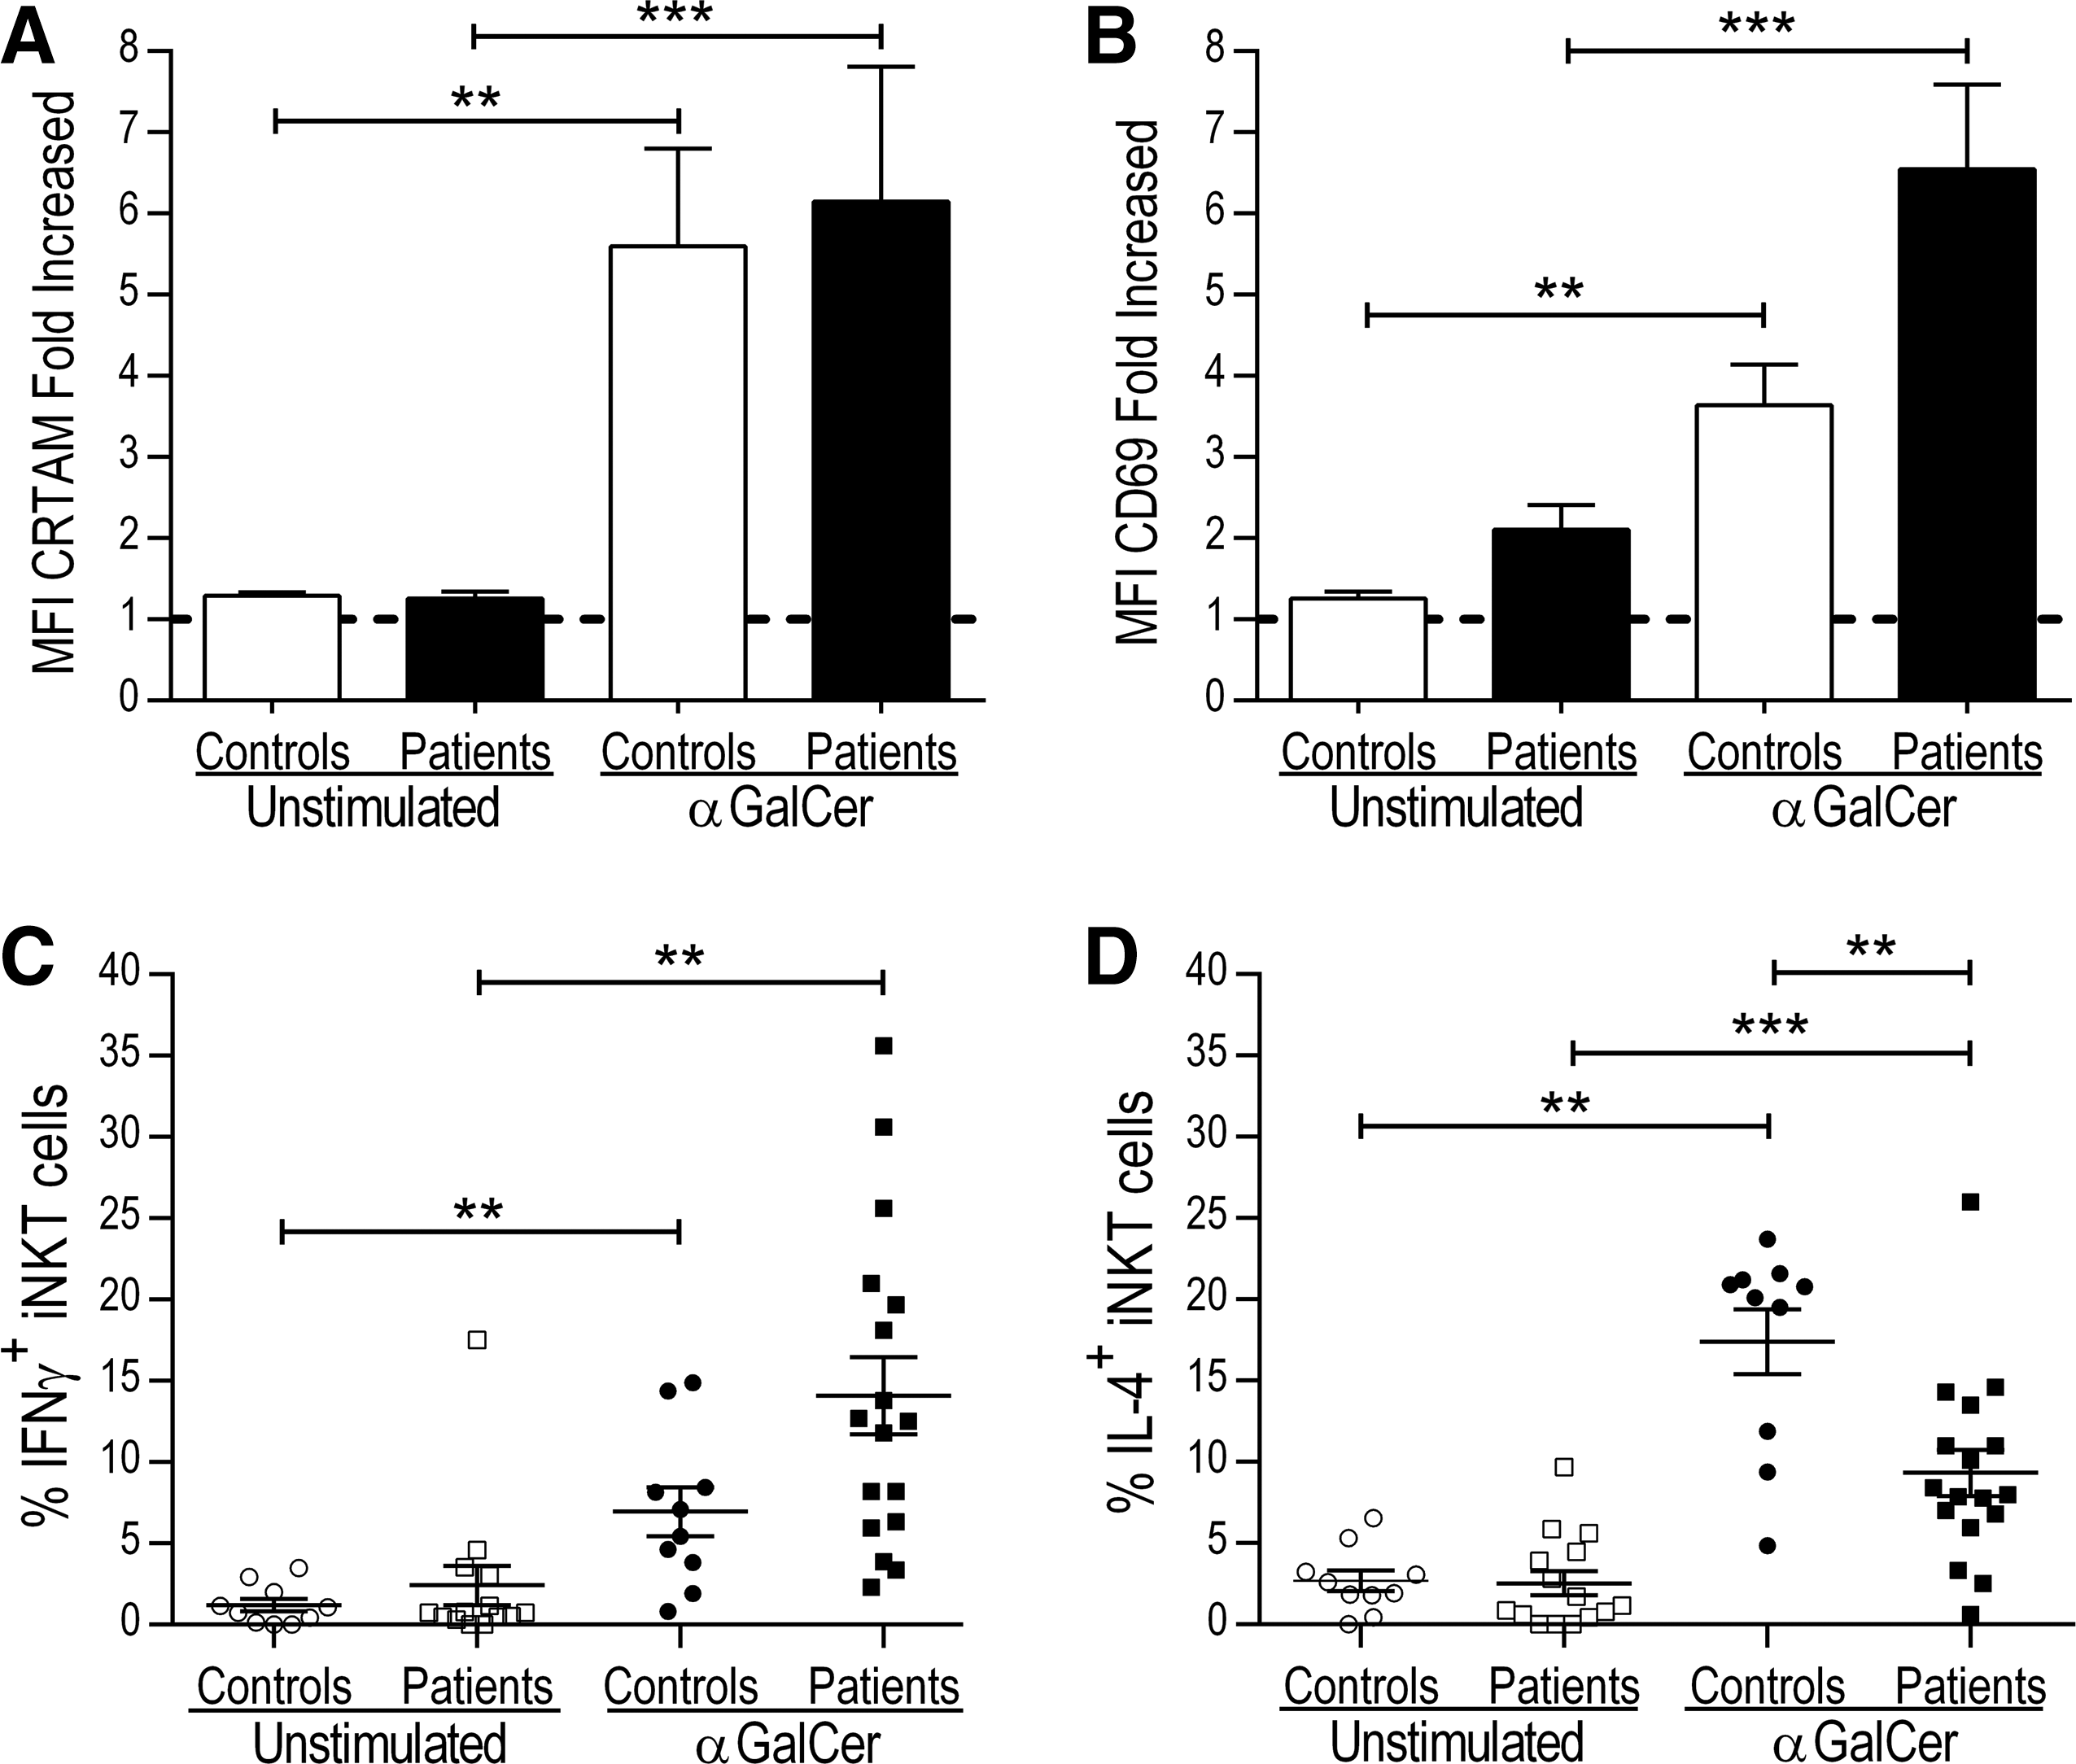
iNKT cells from patients with type 1 diabetes exhibit a proinflammatory profile. PBMCs from 17 patients with T1D and 10 control subjects were stimulated for 18 h with αGalCer (100 ng/mL). The expression of CD69 and CRTAM on iNKT cells, as well as the percentage of cytokine-producing (IFN-γ and IL-4) iNKT cells, was analyzed with flow cytometry. The bar graphs show the increased MFI of CRTAM
P value = comparing group of T1D patients with controls.
CRTAM, Class I-restricted T cell-associated molecule; FiMFI, fold increased mean fluorescence intensity; iNKT, invariant natural killer T; T1D, type 1 diabetes.
As observed in the iNKT cells from healthy donors, a higher percentage of the IFN-γ+ iNKT cells from patients with T1D and control subjects were also CRTAM+ rather than CRTAM− (Table 2 and Fig. 6). Similar results were observed in PMA/ionomycin-stimulated CD4+ and CD8+ T cells from patients and controls (Fig. 6). We detected a higher frequency of CRTAM+ IL-4+ iNKT cells than CRTAM− IL-4+ iNKT cells in the patients (14.5% versus 7.6%, respectively) (P = 0.003). This result suggests that these cells produce both IFN-γ and IL-4, and preliminary data from double-stained samples support this finding (data not shown). No differences were observed in the IL-4-producing iNKT cells from the controls. We also failed to identify differences in IL-4-producing CD4+ T cells, regardless of CRTAM expression (data not shown).
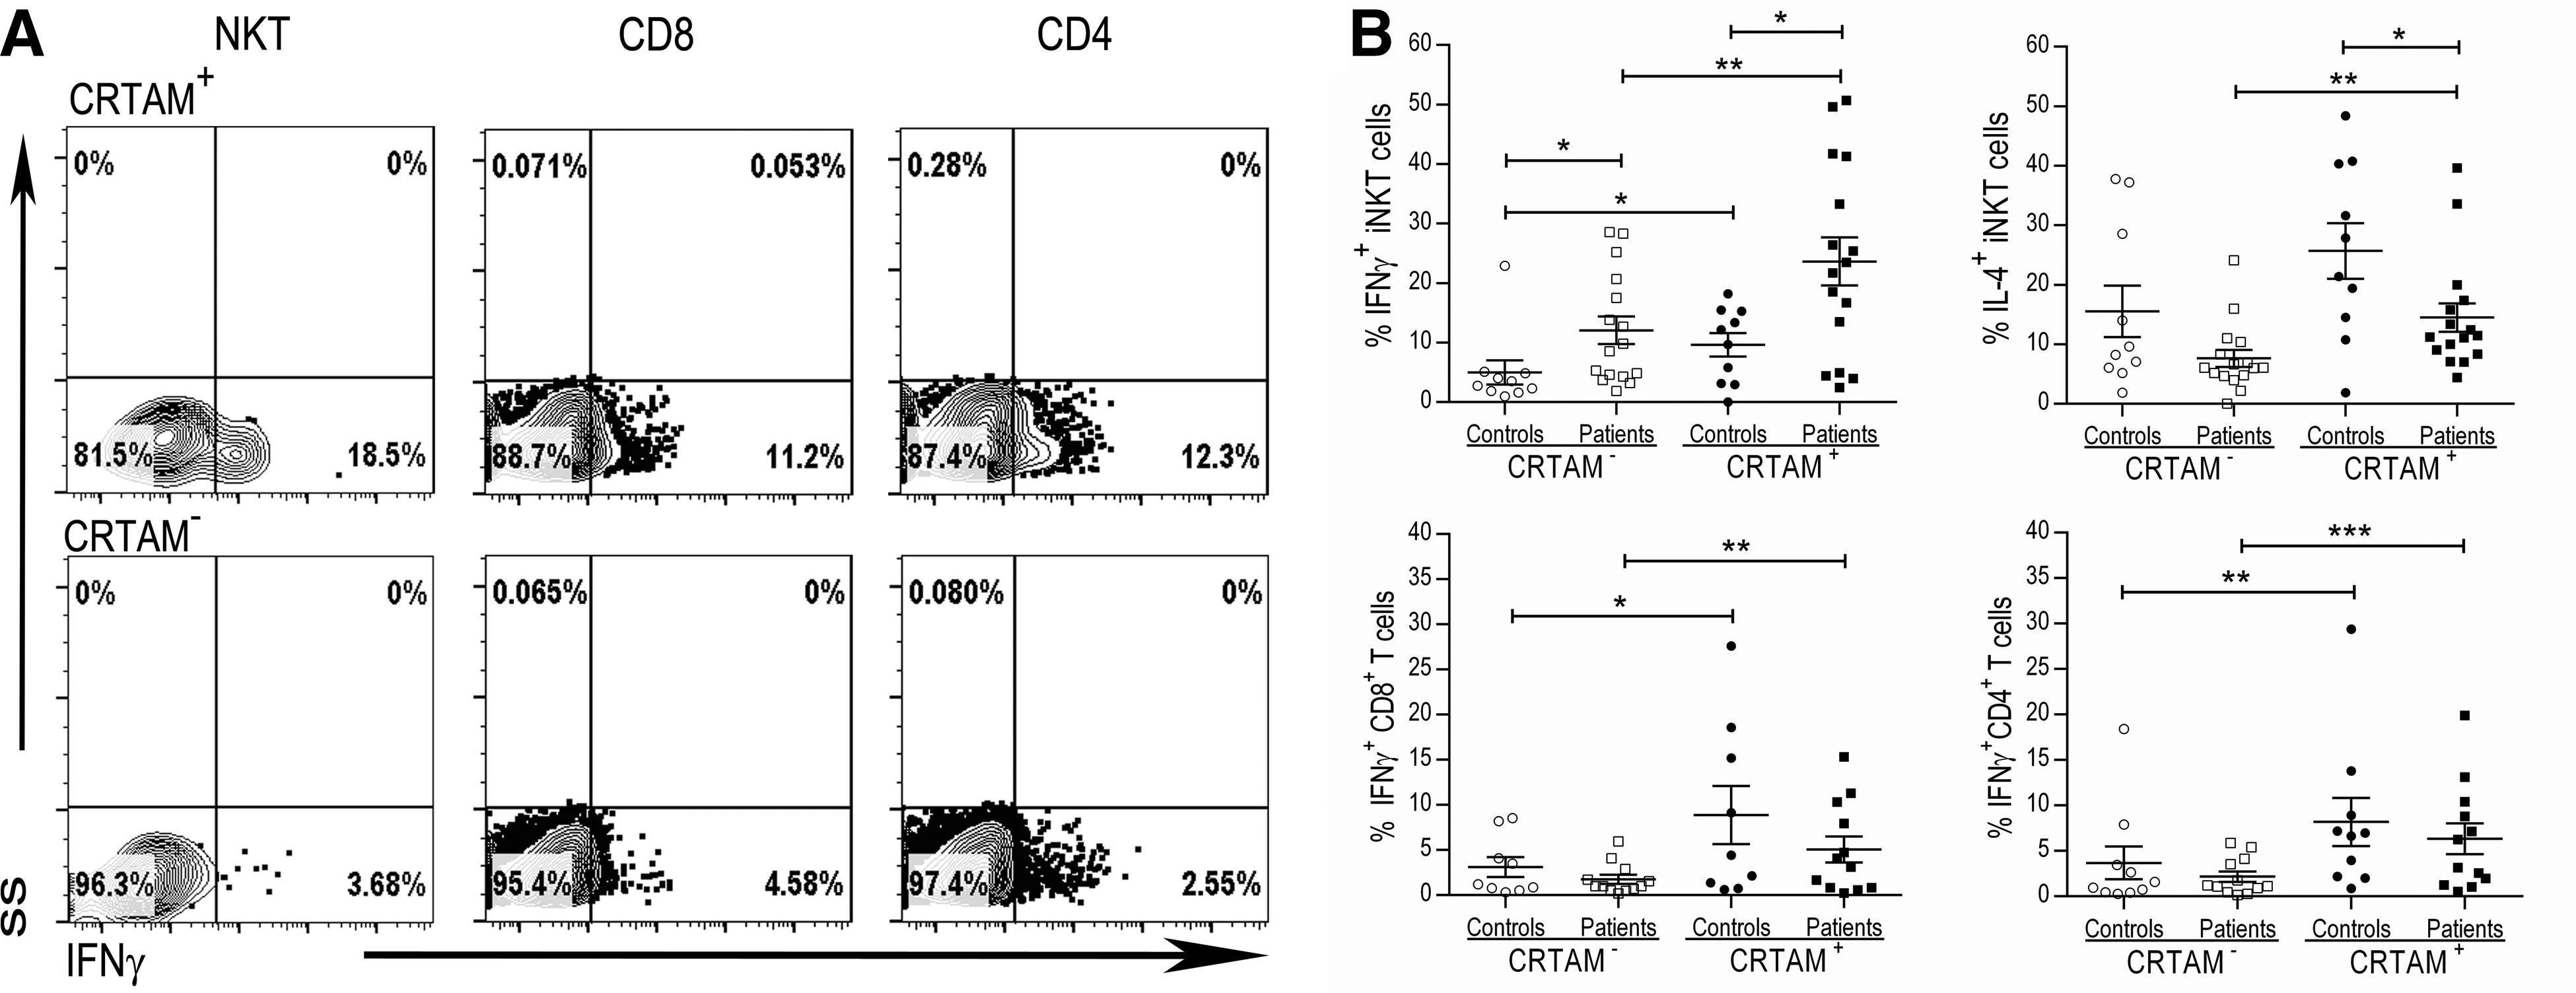
CRTAM expression identifies a proinflammatory profile on iNKT and conventional T cells from patients with type 1 diabetes.
Gated on CD3+6B11+CRTAM+ or CRTAM− cells (Supplementary Fig. S3).
P value = compares CRTAM+ versus CRTAM− cells.
CRTAM, Class I-restricted T cell-associated molecule; iNKT, invariant natural killer T; T1D, type 1 diabetes.
Discussion
The distinct effector response of iNKT cells as either pro- or anti-inflammatory depends on the type of cytokines they produce, which in turn depends on the structural properties, concentration, and affinity of the glycolipid ligands (Oki and others 2005; Im and others 2009; Sullivan and others 2010). In addition, the APC presenting the ligand and the costimulatory signal received by the iNKT cell can modulate the cytokine secretion of this T cell subset (Bezbradica and others 2005; Bai and others 2012). Many studies have evaluated the role of DCs in presenting glycolipid Ags and in eliciting a specific cytokine response in iNKT cells. In contrast to B cells and monocytes/macrophages, DCs are the only APCs that efficiently activate iNKT cells; additionally, DCs are the most effective at inducing IFN-γ and IL-4 production in iNKT cells in vitro and in vivo (Bezbradica and others 2005).
The IFN-γ-skewed response of iNKT cells after αGalCer administration is mainly due to costimulation. In 2001, Hayakawa and others (2001) demonstrated that IFN-γ production by αGalCer-stimulated iNKT cells depends on both CD28- and CD40-mediated costimulatory pathways. CRTAM expression is rapidly and transiently upregulated following polyclonal activation signaling in T cells and is associated with a proinflammatory profile (Yeh and others 2008; Cortez and others 2014). Recently, Takeuchi and others (2015) demonstrated that CRTAM is critical for inducing intracellular signaling for IFN-γ production and the differentiation of murine cytotoxic CD4+ T cells (CD4+CTL). In addition, they showed that a small fraction of human CD4+ T cells express CRTAM and exhibit the same phenotype as mouse CD4+CTL cells after stimulation.
Although CRTAM expression was initially described on iNKT cells, there is little information regarding how to induce the expression of this molecule and the effector response of this unconventional T cell population. Thus, exploiting the natural quasimonoclonal specificity of iNKT cells, we first evaluated whether stimulation with its specific Ag, αGalCer, was sufficient to induce CRTAM expression. Our findings show that CRTAM is expressed after 18 h of αGalCer stimulation, as previously reported (Patino-Lopez and others 2006); however, CRTAM is not expressed under basal conditions. In contrast, although CD69 is expressed under basal conditions, it is overexpressed on stimulation. Furthermore, we found that, similar to the results reported by Yeh and others (2008) and Takeuchi and others (2015) for mouse CD4+ T cells, CRTAM identifies human iNKT cells with a proinflammatory cytokine profile (producing IFN-γ).
We found that αGalCer-pulsed moDCs, rather than B cells or macrophages, were the optimal APCs for inducing CRTAM expression on iNKT cells from healthy subjects (data not shown). This finding is consistent with the results of Takeuchi and others (2015) for CD4+ CTL cells. As discussed above, the expression of Necl-2 has been described on mouse small intestine and lymph node DCs. According with the ImmGen consortium database, necl2 gene is expressed by various subsets of mouse dendritic cells, but much less (or not) by macrophages and not at all by granulocytes (Heng and others 2008). Whereas in humans this molecule has been described only on BDCA3+ DCs from peripheral blood, but there is no register of the expression of necl2 gene or protein in other human peripheral blood cells. As far as we know, it has not been shown before that αGalCer-pulsed human moDCs expressed Necl-2 in addition to expressing costimulatory molecules. Thus, we have demonstrated, for first the time, the expression of Necl-2 on human moDCs. Also, a clear difference between APCs is the level of costimulatory molecule expression.
It is well known that the binding of costimulatory molecules, such as CD80/86-CD28 or CD40-CD40L, activates the NF-κB and AP-1 signaling pathways eliciting the IFN-γ responses on iNKT and conventional T cells. We described previously the functional characterization of the CRTAM promoter on CD8+ T cells, demonstrating the requirement of AP-1 to control crtam gene activation. We also identified in the CRTAM promoter, potential binding sites for the transcription factor NF-κB. Thus, we rationalized that costimulatory molecules might play a role in CRTAM expression (Valle-Rios and others 2009); therefore, we investigated whether these molecules were involved in the induction of CRTAM expression in iNKT cells. The blockade experiments showed that CD28-CD80/86 and CD40L-CD40 engagement did not play a role in CRTAM expression in iNKT cells. In contrast, these molecules did play an important role in CD69 expression and in IFN-γ, but not in IL-4, production, as previously established (Kitamura and others 1999; Hayakawa and others 2001; Williams and others 2008). These findings demonstrate that the signal received through the iTCR is sufficient to induce the expression of CRTAM on iNKT cells. However, CRTAM+ IFN-γ+ iNKT cells were substantially affected by the blockade of costimulatory molecules, which supports the association between CRTAM expression and the production of IFN-γ by human iNKT cells.
Despite its likely participation in the inflammatory immune response, the role of CRTAM in in vivo pathologic scenarios has been poorly explored. Takeuchi and others (2009) used a T1D mouse model induced by CD8-OTI cells to show that the interaction between CRTAM and its ligand Necl-2 is necessary for CD8+ autoreactive lymphocyte retention in pancreatic lymph nodes and the further activation, proliferation, and differentiation of these cells into an optimal effector phenotype. Moreover, the differential expression of the crtam gene on CD3+ T cells from NOD mice has been reported during T1D development (Fornari and others 2011); however, the expression of CRTAM protein by iNKT lymphocytes has not been demonstrated in this model. A recent publication showed that CRTAM participates in the response and maintenance of gut IL-17+ CD4+ T cells during parasitic infection (Cortez and others 2014). In addition, a colitis induction model was used to demonstrate that CRTAM+ CD4+ T cells participate in the induction of colitis at sites of inflammation through both CTL activity and the production of cytokines, such as IFN-γ and IL-17 (Takeuchi and others 2015).
Recently, we showed that CRTAM is expressed on the surface of T cells and neutrophils from asthma patients (Ramirez-Velazquez and others 2014). Furthermore, we also reported that in patients with T1D, CRTAM and CD69 were both expressed on an iNKT cell population with low iTCR expression that resembled a state of activation (Beristain-Covarrubias and others 2015). Based on these observations, we aimed to explore the effector response of iNKT cells from patients with T1D exposed to Ag-specific stimuli. Due to the low frequency of this cell subset and the limited amount of sample obtained, we could not use the coculture method to stimulate the iNKT cells from the patients. However, stimulation with αGalCer using the APCs present in the pool of PBMCs was enough to induce CRTAM expression up to 6-fold in iNKT cells from patients with T1D as well as those from healthy controls. Also, CD69 was upregulated after 18 h of αGalCer stimulation. However, the iNKT cells from the patients showed higher levels of CD69 expression than the iNKT cells from the controls, which could be a reflection of the pathologic autoreactive condition (Novak and others 2007; Berzins and others 2011). The cytokine phenotype results are consistent with those previously reported, showing a bias toward IFN-γ-producing iNKT cells in individuals with T1D compared with controls, who exhibited a higher frequency of IL-4-producing iNKT cells (Wilson and others 1998; Kent and others 2005).
It is worth mentioning that previous works used complex methodology to evaluate the cytokine levels produced by clones of iNKT lymphocytes isolated from either the peripheral blood or the lymph nodes of T1D patients. These results do not precisely reflect the in vivo response of the iNKT cells. Also, it is important to consider that both quantitative and qualitative features, such as localization and subset differentiation, are crucial for in vivo activation and cytokine secretion (IL-4, IFN-γ, or IL-17) from iNKT cells on αGalCer challenge (Lee and others 2015). Thus, because we used primary cultures, our results may be more representative of the effector response that peripheral iNKT lymphocytes would have in vivo. With respect to cytokine production based on CRTAM expression, we observed a higher frequency of IFN-γ-producing iNKT cells among those cells expressing CRTAM than among those cells that did not. This finding is similar to the results of coculture experiments as well as the results previously reported for murine CD4+ T cells, reinforcing the well-described association between CRTAM and a proinflammatory profile.
Because iNKT cells can produce a wide range of cytokines (IFN-γ, TNF, IL-2, IL-4, IL-10, IL-13, IL-17, IL-21, IL-22, GM-CSF) (Coquet and others 2008), it would be valuable to evaluate whether the CRTAM expression on human iNKT cells is also associated with the production of other proinflammatory cytokines (IL-17 and IL-22) or with a cytotoxic profile, as was shown for mouse CD4+ T cells (Yeh and others 2008; Takeuchi and others 2015). It is notable that the age of the patients and the controls limited the blood sample volume that was obtained. Therefore, in addition with the low frequency of the cell subset, it was not possible to perform further analyses, such as cell sorting or functional assays, to extensively characterize the production of other cytokines.
We (and others before us) have demonstrated that CRTAM is regulated by cellular interactions, particularly with DCs (Cortez and others 2014; Takeuchi and others 2015). It has also been shown that the intracellular domain of CRTAM transmits signals that regulate T cell polarity, cytokine production (IFN-γ, IL-17, and IL-22) and the differentiation of CD4+ CTL cells (Yeh and others 2008; Takeuchi and others 2015). However, the signaling pathway responsible for driving these functions has not yet been described.
In the present work, we demonstrated that αGalCer-pulsed moDCs express Necl-2 and that Ag-specific signaling through the iTCR induces CRTAM expression on human iNKT lymphocytes in a costimulatory molecule-independent manner. We think that CRTAM has a similar role as it has been described for conventional T cells. It means that CRTAM is required for optimal activation of iNKT cells through the interaction with Necl-2 expressed on APCs. This interaction might be happening at the lymph node or spleen and likely it might also be occurring in the liver because it is well known that iNKT cells make up a large percentage of the lymphoid cells present in this organ. Moreover, we confirmed that the expression of CRTAM is associated with the production of the proinflammatory cytokine IFN-γ in these iNKT cells. In addition, this association was even more evident in a pathologic background where IFN-γ production is central, as in T1D, highlighting the role of CRTAM in the production of inflammatory cytokines.
Together with our previous report of the presence of a CRTAM+ CD69+ iNKT cell subpopulation ex vivo that resembles a recently activated phenotype in patients with T1D and their first-degree relatives (Beristain-Covarrubias and others 2015), these findings strengthen the hypothesis that CRTAM might play a pathogenic role in inflammatory diseases through IFN-γ production. Also, it makes CRTAM a suitable marker and a potential target during inflammatory conditions. Nevertheless, more work is required to characterize the signaling pathway activated by CRTAM as well as the manner in which this signaling induces cytokine production, both in healthy subjects and in patients suffering from inflammatory diseases.
Footnotes
Acknowledgments
We thank Victor Hugo Rosales for his assistance with the FACS and flow cytometry experiments. This work was supported by a grant from Consejo Nacional de Ciencia y Tecnologia (Salud-2003-COI 139/A-1) to VON and a scholarship to NBC (CVU 332390).
Authors' Contributions
N.B.C. and E.C.P. conducted the experiments, analyzed the data, and wrote the article. C.R.V. conducted the experiments and analyzed the data. J.C.B.G. generated the chimeric proteins used in the Necl-2 experiments. R.G.D. provided the samples and clinical information for the patients. V.O.N. helped to design and supervise the project and reviewed and edited the article.
Author Disclosure Statement
No competing financial interests exist.