
Abstract
After viral infection, type I and III interferons (IFNs) are coexpressed by respiratory epithelial cells (RECs) and activate the ISGF3 transcription factor (TF) complex to induce expression of a cell-specific set of interferon-stimulated genes (ISGs). Type I and III IFNs share a canonical signaling pathway, suggesting that they are redundant. Animal and in vitro models, however, have shown that they are not redundant. Because TFs dictate cellular phenotype and function, we hypothesized that focusing on TF-ISG will reveal critical combinatorial and nonredundant functions of type I or III IFN. We treated BEAS-2B human RECs with increasing doses of IFNβ or IFNλ1 and measured expression of TF-ISG. ISGs were expressed in a dose-dependent manner with a nonlinear jump at intermediate doses. At subsaturating combinations of IFNβ and IFNλ1, many ISGs were expressed in a pattern that we modeled with a cubic equation that mathematically defines this threshold effect. Uniquely, IFNβ alone induced early and transient IRF1 transcript and protein expression, while IFNλ1 alone induced IRF1 protein expression at low levels that were sustained through 24 h. In combination, saturating doses of these 2 IFNs together enhanced and sustained IRF1 expression. We conclude that the cubic model quantitates combinatorial effects of IFNβ and IFNλ1 and that IRF1 may mediate nonredundancy of type I or III IFN in RECs.
Introduction
T
Experimental models of viral infection, however, suggest that type I and III IFNs are not redundant. For example, Pott and others (2011) showed that responsiveness to type III IFN is necessary and sufficient to protect mice against rotavirus. Similarly, Nice and others (2015) found that fecal shedding of norovirus was increased in IFNLR-deficient, but not IFNAR1-deficient, mice, revealing that IFNλ uniquely controls local norovirus infection in the gut. Conversely, type I IFN controls systemic norovirus infection (Nice and others 2015). Recently, Voigt and Yin (2015) demonstrated that in combination, type I and III IFNs synergistically suppressed vesicular stomatitis virus infection of A549 respiratory epithelial cells (RECs) and used a pharmacologic model to provide evidence that their signaling pathways diverge. While these reports support combinatorial nonredundancy of type I and III IFNs, a molecular basis for this combinatorial effect or for unique qualitative contributions by either IFN has not been defined.
In this study, we consider that type I and III IFNs may be nonredundant due to kinetic, quantitative, or qualitative differences in ISG expression. IFNs are kinetically nonredundant when the rate of ISG expression in response to one (or both) is faster or more sustained than the other. For example, Voigt and Yin (2015) showed that the A549 alveolar REC reached an antiviral state more quickly in response to IFNα than IFNλ1. Kinetic nonredundancy may be critical because viral infection initiates a race between expression of antiviral ISGs and of viral genes that suppress IFN or ISG expression or function (Dhar and others 2015; Krug 2015; Rand and others 2014; Zheng and others 2015). IFNs are quantitatively nonredundant when, irrespective of kinetics, ISG expression in response to one (or both) is of greater amplitude than the other. For example, Bolen and others (2014) showed that IFNβ induces higher ISG expression than IFNλ1, IFNλ2, or IFNλ3 in hepatocytes. Quantitative and kinetic nonredundancy can overlap and likely vary according to cell type and pathogen. IFNs are qualitatively nonredundant when an effect is selectively responsive to one IFN or both in combination, but not to the other. To our knowledge, there are no reports of selective gene expression in response to type I versus type III IFN.
Because TFs regulate expression of genes that define cellular function, we hypothesized that focusing on TFs that are ISGs (TF-ISG) will reveal combinatorial effects and nonredundancy of type I or III IFN. We therefore treated BEAS-2B RECs with IFNβ, IFNλ1, or the 2 IFNs in combination and measured expression by qRT-PCR and Western blot of a set of canonical antiviral ISGs and of ISGs that function as TFs (TF-ISG). We found that IFNβ and IFNλ1 induced distinct kinetic and quantitatively nonredundant patterns of ISG expression in a dose-dependent manner with threshold effect at intermediate doses. In addition, IRF1 was selectively responsive to IFNβ and uniquely peaked earlier than the other TF-ISGs. Our data suggest that IRF1 mediates kinetic and quantitative nonredundant functions of type I and III IFNs.
Materials and Methods
Cell line and reagents
Human bronchial RECs (BEAS-2B, ATCC CRL-9609) were obtained from the American Type Culture Collection. Cells were cultured in Bronchial Epithelial Basal Medium supplemented with BEGM SingleQuot Kit supplements and growth factors (BEBM; Lonza), without gentamicin, in a humidified incubator at 37°C and 5% CO2.
Recombinant hIFNβ1b was obtained from PBL Assay Science (Piscataway, NJ). Recombinant hIL-29/IFNλ1 was obtained from R&D Systems. The primary and secondary antibodies we used for Western blot analysis are shown in Supplementary Table S1 (Supplementary Data are available online at
Bronchial epithelial cell culture
T-75-cm2 cell culture flasks were coated with a solution of BEBM, collagen (final concentration 0.03 mg/mL; Sigma), fibronectin (0.01 mg/mL; Sigma), and bovine serum albumin (0.01 mg/mL; Sigma) and placed in a humidified incubator for 2 h at 37°C and 5% CO2. The coating solution was removed and BEAS-2B RECs were grown in the flasks until confluence and then seeded into coated 6- or 12-well tissue culture plates at a density of 5.26 × 10³ cells/cm2. Cells were washed and fresh media were added after 48 h. After an additional 48 h, cells were treated with IFN and harvested for RNA and protein extraction.
Quantitative PCR
BEAS-2B RECs were harvested in RLT Buffer (Qiagen) and 1% beta-mercaptoethanol (Sigma) and stored at −80°C. RNA was extracted using the Qiagen RNeasy 96 Kit and reverse transcription (cDNA synthesis) was performed using the Verso Kit (Thermo Scientific). qRT-PCR was then performed with primers for ISGs or the housekeeping genes (HKGs), SDHA and UBC, the sequences of which were obtained from the literature or designed using Beacon Designer 8 (Supplementary Table S2). Primer sets were validated using melting curve analysis in peripheral blood mononuclear cells, A549 REC (ATCC CCL-185), and Jurkat cells (ATCC TIB-152). qRT-PCR was performed using the SYBR Green Master Mix (Life Technologies). qRT-PCR conditions were 50°C for 2 min, then 95°C for 10 min, followed by 40 cycles at 95°C for 15 s, and 60°C for 1 min. Ct values for ISGs were normalized to the average of the SDHA and UBC Ct values, and results were shown as fold change over untreated cells (ΔΔCt). Dose–response curves were generated using a nonlinear fit of log (agonist) versus response in GraphPad Prism 6 (GraphPad Software, Inc.).
Western blot
BEAS-2B RECs were lysed using RIPA buffer, supplemented with protease and phosphatase inhibitor tablets (Thermo Scientific), and 0.5% SDS (Invitrogen, Carlsbad, CA). Cell lysates were frozen at −80°C. Cellular extracts were thawed, spun in a microcentrifuge at 12,000 rpm at 4°C for 10 min, and supernatants were used for Western blotting. Samples were prepared by adding NuPAGE LDS Sample Buffer (4 × ) (Life Technologies) and NuPAGE Reducing Agent (10 × ) (Life Technologies) and samples were heated at 80°C for 5 min. Twenty microliters of sample was loaded per lane of a 12-lane 12% NuPAGE Bis-Tris Mini Gel (Life Technologies). PageRuler Plus Prestained Protein Ladder (Thermo Scientific) was used as the protein size standard.
Gels were run at 80 V for 3 h in NuPAGE MOPS SDS Running Buffer (1 × ) (Life Technologies). Proteins were transferred to PVDF membranes using the iBlot Dry Blotting System (Invitrogen) at 10V for 20 min. Membranes were blocked in 1× TBST (Thermo Scientific) with 5% instant nonfat dry milk (Nestle Carnation) for 1 h at RT, and then incubated with primary antibody (Ab, monoclonal or polyclonal) in blocking buffer (1× TBST with 5% milk) overnight at 4°C on a rocking platform. Membranes were then washed 3 × with blocking buffer at RT and incubated with secondary Ab in blocking buffer for 1 h at RT. Membranes were again washed 3 × with blocking buffer. After adding ECL Plus Western Blotting Substrate (Pierce) for 5 min, the membranes were imaged on X-ray films (Kodak). Membranes were then washed with blocking buffer before and after stripping with Restore PLUS Western Blot Stripping Buffer (Life Technologies) to probe with additional Ab.
Models of combinatorial IFN treatment
SAS Software Version 9.4 was used to analyze the combinatorial effects of the 2 IFNs on mean ISG expression of samples treated with IFNβ (0.001, 0.01, 0.1 ng/mL) or IFNλ1 (0.5, 5, 50 ng/mL) or both for 4 and 24 h. Models were tested in a stepwise manner of increasing complexity from linear to quadratic to cubic models for best fit. In addition, augmented cubic models that evaluate antagonism or synergism were tested. Supplementary Data include the SAS code used to determine the best fit of the ISG expression data.
Regularized linear discriminant analysis in the high-performance integrated virtual environment
The regularized linear discriminant analysis (RLDA) classification tool in the high-performance integrated virtual environment (HIVE) (Simonyan and Mazumder 2014) was used to identify the ISGs that differentiate IFNβ and IFNλ1. HIVE is a cloud-based environment optimized for storage and computation of large data and has massive parallelization facilities and infrastructure for data manipulation and visualization. The RLDA algorithm in HIVE is a high-performance implementation of Fisher's linear discriminant (Fisher 1936). RLDA was applied to ISG expression data to identify a combination of ISG variability that best characterizes 2 classifiers, IFNβ and IFNλ1, and to quantify the relative contributions of each ISG that differentiates IFNβ and IFNλ1.
ISG alignment for degenerate primers
A list of 624 ISGs was compiled from the literature (de Veer and others 2001; Schoggins and others 2011). ISG-coding sequences were aligned to observe sequence similarity. DAVID Bioinformatics Resources (Huang and others 2009a, 2009b) and Interpro (Mitchell and others 2015) were used to group ISGs based on protein domains and TF activity. ISGs with TF activity (TF-ISGs) were separated for analysis using gene ontology classification (Binns and others 2009). The protein-coding sequences of the remaining ISGs were aligned using ClustalW (Goujon and others 2010; Sievers and others 2011) and a maximum likelihood test was used to generate the phylogenetic tree in MEGA5.5 (gap penalties: open −1,000, extend −1). Ingenuity Pathway Analysis (Ingenuity Systems) was used to determine the TF-ISG with antiviral function.
Results
IFNβ and IFNλ1 induce distinct mRNA expression patterns of TF-ISG
We first tried to identify unique functional responses to type I and III IFNs by exploring transcription of ISGs with sets of degenerate primers for groups of genes with shared protein-coding domains. We aligned coding sequences of 624 ISGs (Supplementary Fig. S1), but determined that there are too few regions of significant sequence similarity to pursue this strategy. Because TFs control gene expression, which critically impacts cellular phenotype and function, we used gene ontology classification (Binns and others 2009) to identify, from the list of 624 ISGs, 51 that are TFs (TF-ISG, Table 1). We then designed and validated a qRT-PCR array to measure transcript levels of TF-ISGs and, as comparators, a set of canonical ISGs, relative to expression of 2 HKGs, SDHA and UBC.
TF-ISG with antiviral activity as identified using Ingenuity Pathway Analysis.
TF-ISG expressed in response to IFNβ and/or IFNλ1.
ISG, interferon-stimulated gene; TF, transcription factor.
We then evaluated TF-ISG expression in BEAS-2B human RECs in response to IFNβ and IFNλ1 at dose and time intervals (Fig. 1). Initial experiments at saturating doses of each IFN allowed us to identify the TF-ISGs that are responsive to IFN in BEAS-2B RECs (asterisk, Table 1), all of which were constitutively expressed at low levels (not shown). As shown in Fig. 2 and Supplementary Fig. S2, the IFN each enhanced expression of the TF-ISG above basal levels in a dose-dependent manner, which saturated at ∼10 and ∼50 ng/mL for IFNβ and IFNλ1, respectively.
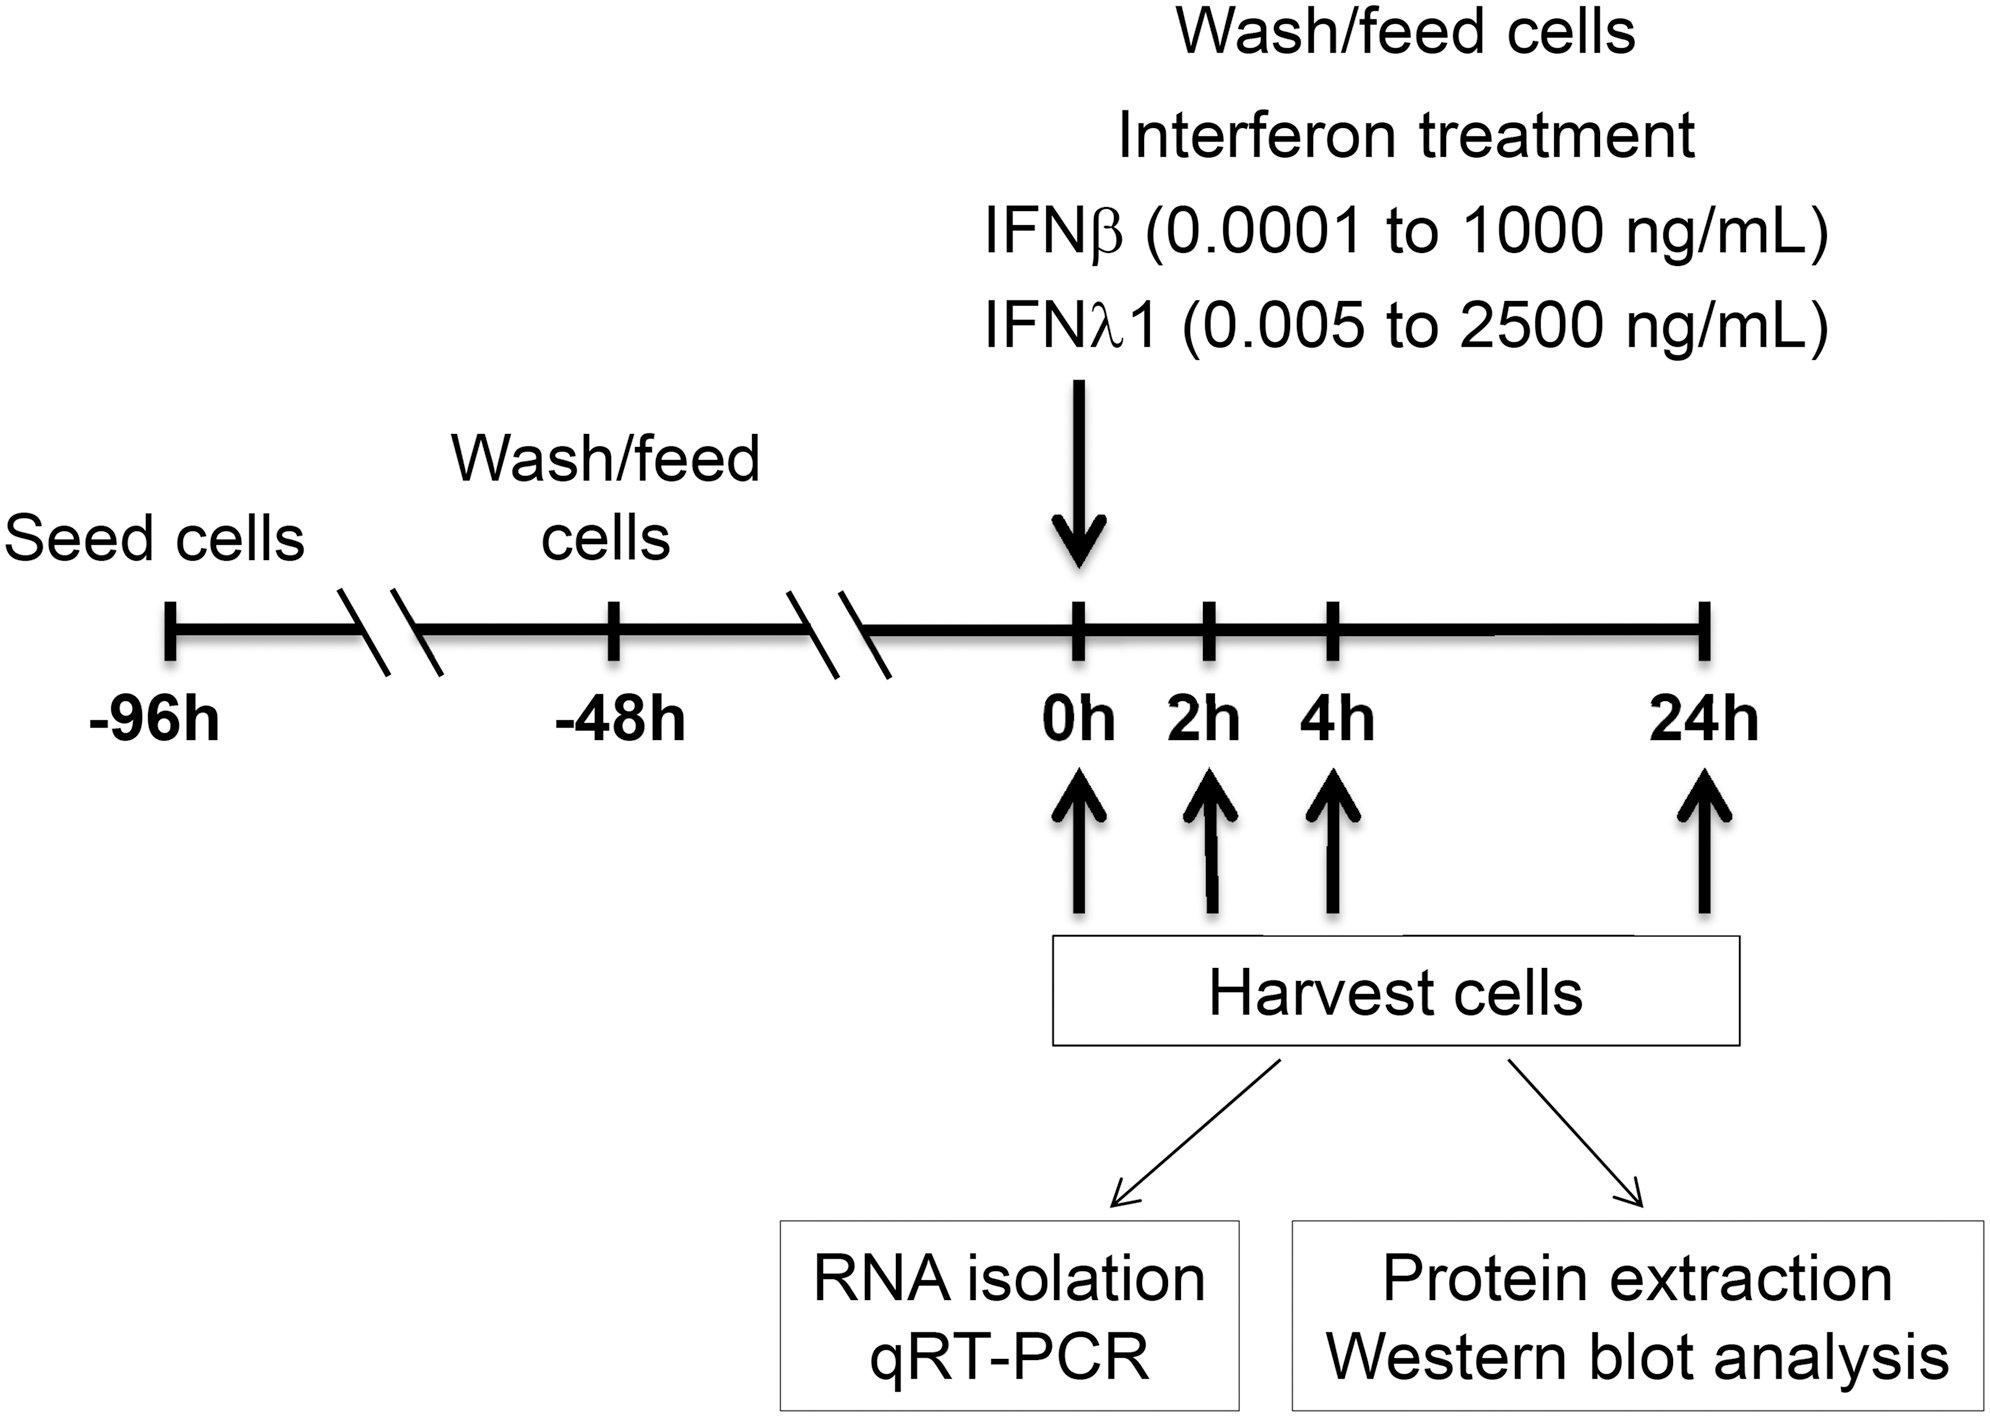
Experimental design of IFN treatment of BEAS-2B RECs. RECs, respiratory epithelial cells.
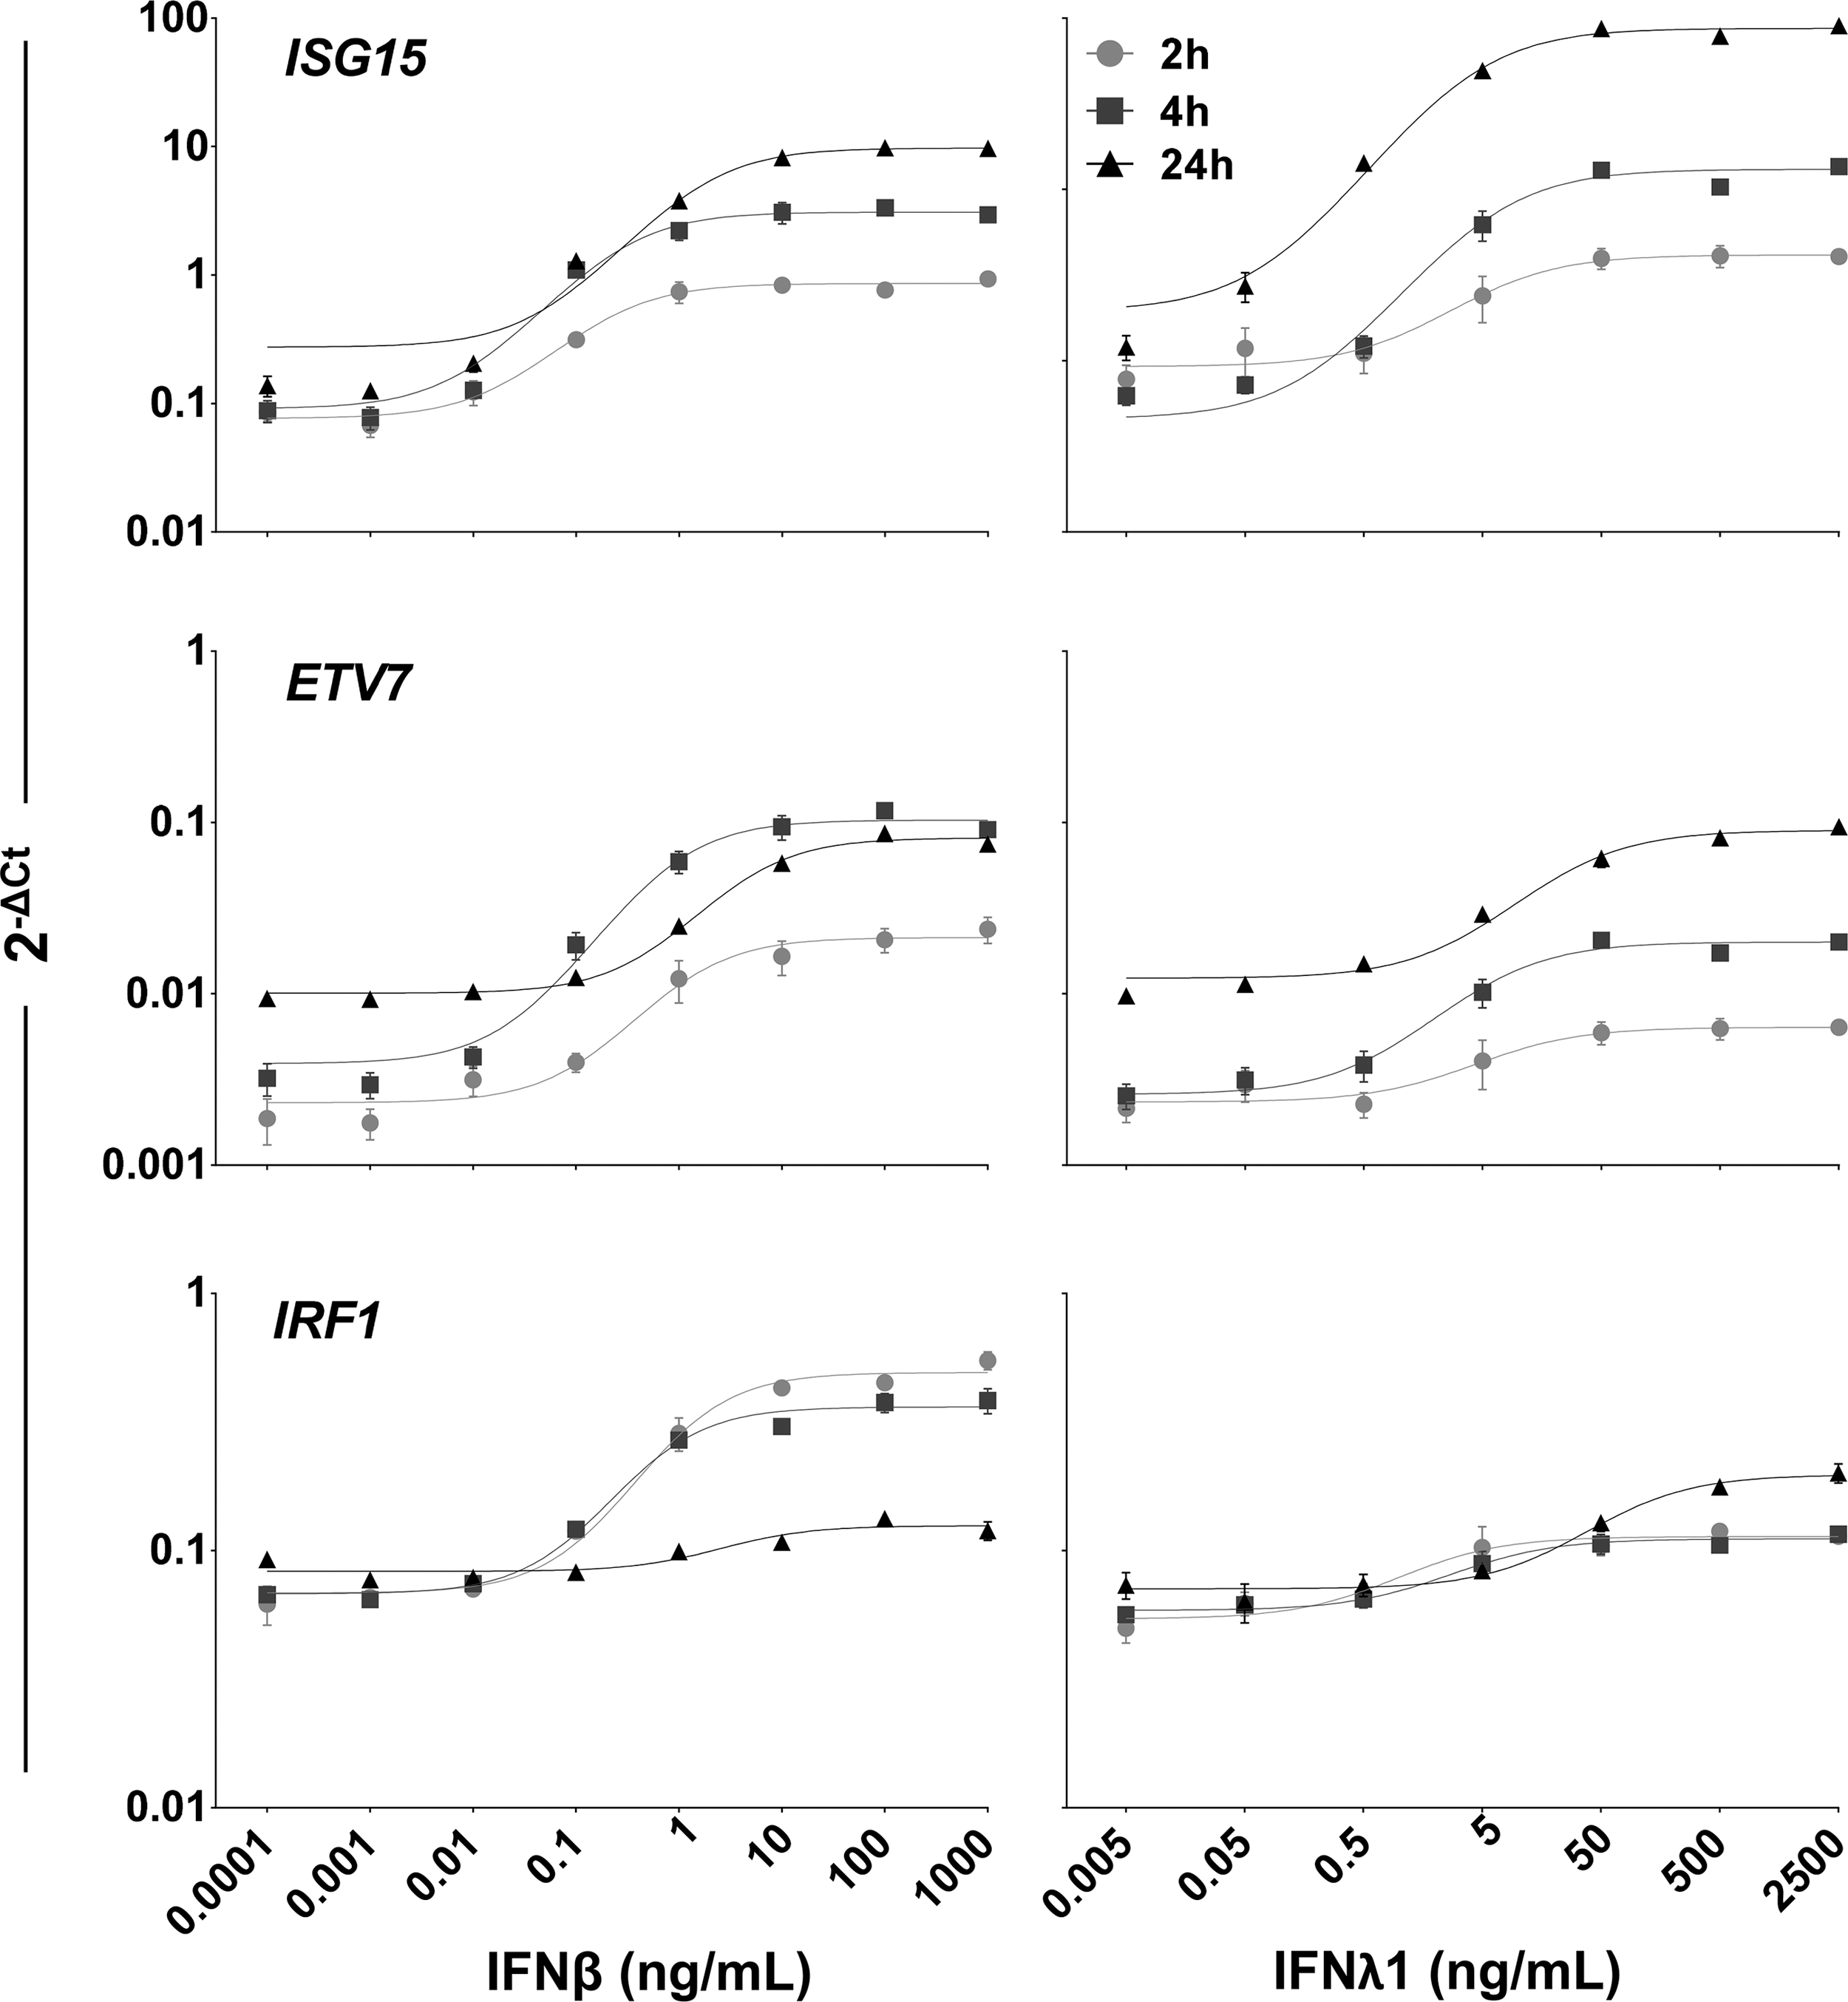
Dose response of mRNA expression of ISG by BEAS-2B RECs. The dose curves were generated using a nonlinear Fit of log(agonist) versus response in GraphPad Prism 6. Top panel: representative canonical ISGs. Middle panel: representative TF-ISGs. Bottom panel: IRF1 is selectively responsive to IFNβ. Data shown are mean and standard deviation of 2 experiments, each performed in triplicate (n = 6). ISG, interferon-stimulated gene; TF, transcription factor.
As shown in Fig. 3, Supplementary Fig. S3, and summarized in Table 2, dose–response studies of IFNβ (0.0001–1,000 ng/mL) and IFNλ1 (0.005–2,500 ng/mL) revealed that expression of a set of ISGs differed in response to each IFN, either in peak levels or kinetic patterns, or both (Table 2). For example, ISG15 and STAT1, canonical and TF-ISG, respectively, had similar peak levels of expression, but differed in their kinetic patterns in response to IFNβ and IFNλ1 treatment (Fig. 3A). By contrast, ETV7 and IRF1 differed in both peak expression levels and kinetic patterns in response to IFNβ and IFNλ1 treatment (Fig. 3B). Uniquely, IRF1 expression peaked at 2 h in response to IFNβ and tapered at 4 h, but was minimally expressed in response to IFNλ1. Only 2 of the examined genes exhibited similar peak expression levels and kinetic patterns in response to both IFNβ and IFNλ1 treatment: IRF9 and TRIM25 (Fig. 3C). In addition, Fig. 3 revealed that the dose response to each IFN was nonlinear, with a steep jump in expression or threshold effect between 2 of the IFN doses. For IFNβ, the threshold was most often between 0.01 and 0.1 ng/mL; for IFNλ1, the threshold was most often between 0.5 and 5.0 ng/mL. Supplementary Fig. S3 shows kinetic graphs of additional ISGs.

Kinetic expression of ISG transcripts by BEAS-2B RECs in response to IFNβ or IFNλ1.
RECs, respiratory epithelial cells.
RLDA of ISG expression in response to IFNβ and IFNλ1
We then performed RLDA in the HIVE to quantify the relative contributions of each ISG in differentiating IFNβ and IFNλ1 (graphically depicted in Supplementary Fig. S4). Table 3 shows the contribution coefficients of each ISG calculated by RLDA, which represent the cosine of the projection angle onto the original axis. The contribution coefficient is normalized, centered to range from 0 to 1, and then squared to give the total contribution fraction of an ISG toward differentiating IFNβ and IFNλ1. The top 9 ISGs in Table 3 (IRF1, IRF8, SOCS1, BATF2, ETV7, IRF2, ATF3, TRIM25, MX1) account for 90% of the difference between IFNβ and IFNλ1. IRF1 contributes most, accounting for 16.8% of the separation between the 2 IFNs.
Modeling TF-ISG mRNA expression in response to combinatorial treatment with IFNβ and IFNλ1
Because IFNβ and IFNλ1 are often coexpressed, we evaluated their combinatorial effects on BEAS-2B expression of TF-ISGs at 4 and 24 h by treating with each IFN alone and together in a checkerboard format. For these experiments, all doses of IFNβ (0.001, 0.01, 0.1 ng/mL) and the 2 lowest doses of IFNλ1 (0.5, 5 ng/mL) were below saturation; the highest dose of IFNλ1 (50 ng/mL) was saturating. To examine the effects of a wide range of combinatorial IFN doses on ISG expression, we tested several mathematical models of increasing complexity to determine the best fitting model for our set of ISGs. Using STAT1 for preliminary evaluation, we tested simple linear and quadratic models with either IFNβ or IFNλ1 alone, both IFNβ and IFNλ1, or IFNβ and IFNλ1 plus terms for their interaction, as well as models that included or excluded an intercept term. These models were compared, contrasted, and revised in case of poor model fit based on a variety of diagnostic criteria, including visual inspection, R 2 values of fit, and testing for significance (P < 0.05).
Testing for fit diagnostics, including the model P value and R
2, on expression of additional TF-ISGs confirmed that the generalized linear model with a cubic function (cubic model) was the best-fit model for predicting combinatorial responses to each IFN at both 4 and 24 h, including the threshold effect observed in Fig. 3. The equation of the cubic model for these data is
Letters a–g refer to the unique parameter estimates for the equation of each ISG. The transformed variables for IFNβ and IFNλ1 doses were log10(β) and log10(λ/5), respectively. These log transformations were used for consistency with experimental design and to evenly space the independent variables, which typically yields more stable statistical properties. Because log10(0) is infinite, the 0 ng/mL dose was replaced by 0.05 and 0.0001 for IFNλ1 and IFNβ, respectively.
Supplementary Table S3 shows the model equation, R 2, and P values for each TF-ISG at each time point. Figure 4 and Supplementary Fig. S5 show the 3-dimensional plots of the observed and predicted fold change, along with a contour plot overlaying the observed and predicted fold change, of each TF-ISG at each time point. Taking the number of tests into account and utilizing a Bonferroni multiplicity correction, the model was considered statistically significant if P < 0.001 and predictive of combinatorial effects if P < 0.001 and R 2 ≥ 0.90. According to these criteria, a subset of TF-ISGs—BATF2, ETV7, IRF1, IRF7, IRF9 (24 h only) STAT1, TRIM22, and TRIM25 (24 h only)—and a subset of canonical ISGs—MX1, OAS1, and SOCS1—fit the proposed cubic model. ELF1, IRF3, IRF9 (4 h), TRIM25 (4 h), and HKG TBP did not fit the model. These results imply additivity, without evidence of synergy or antagonism, toward ISG expression between IFNβ and IFNλ1.
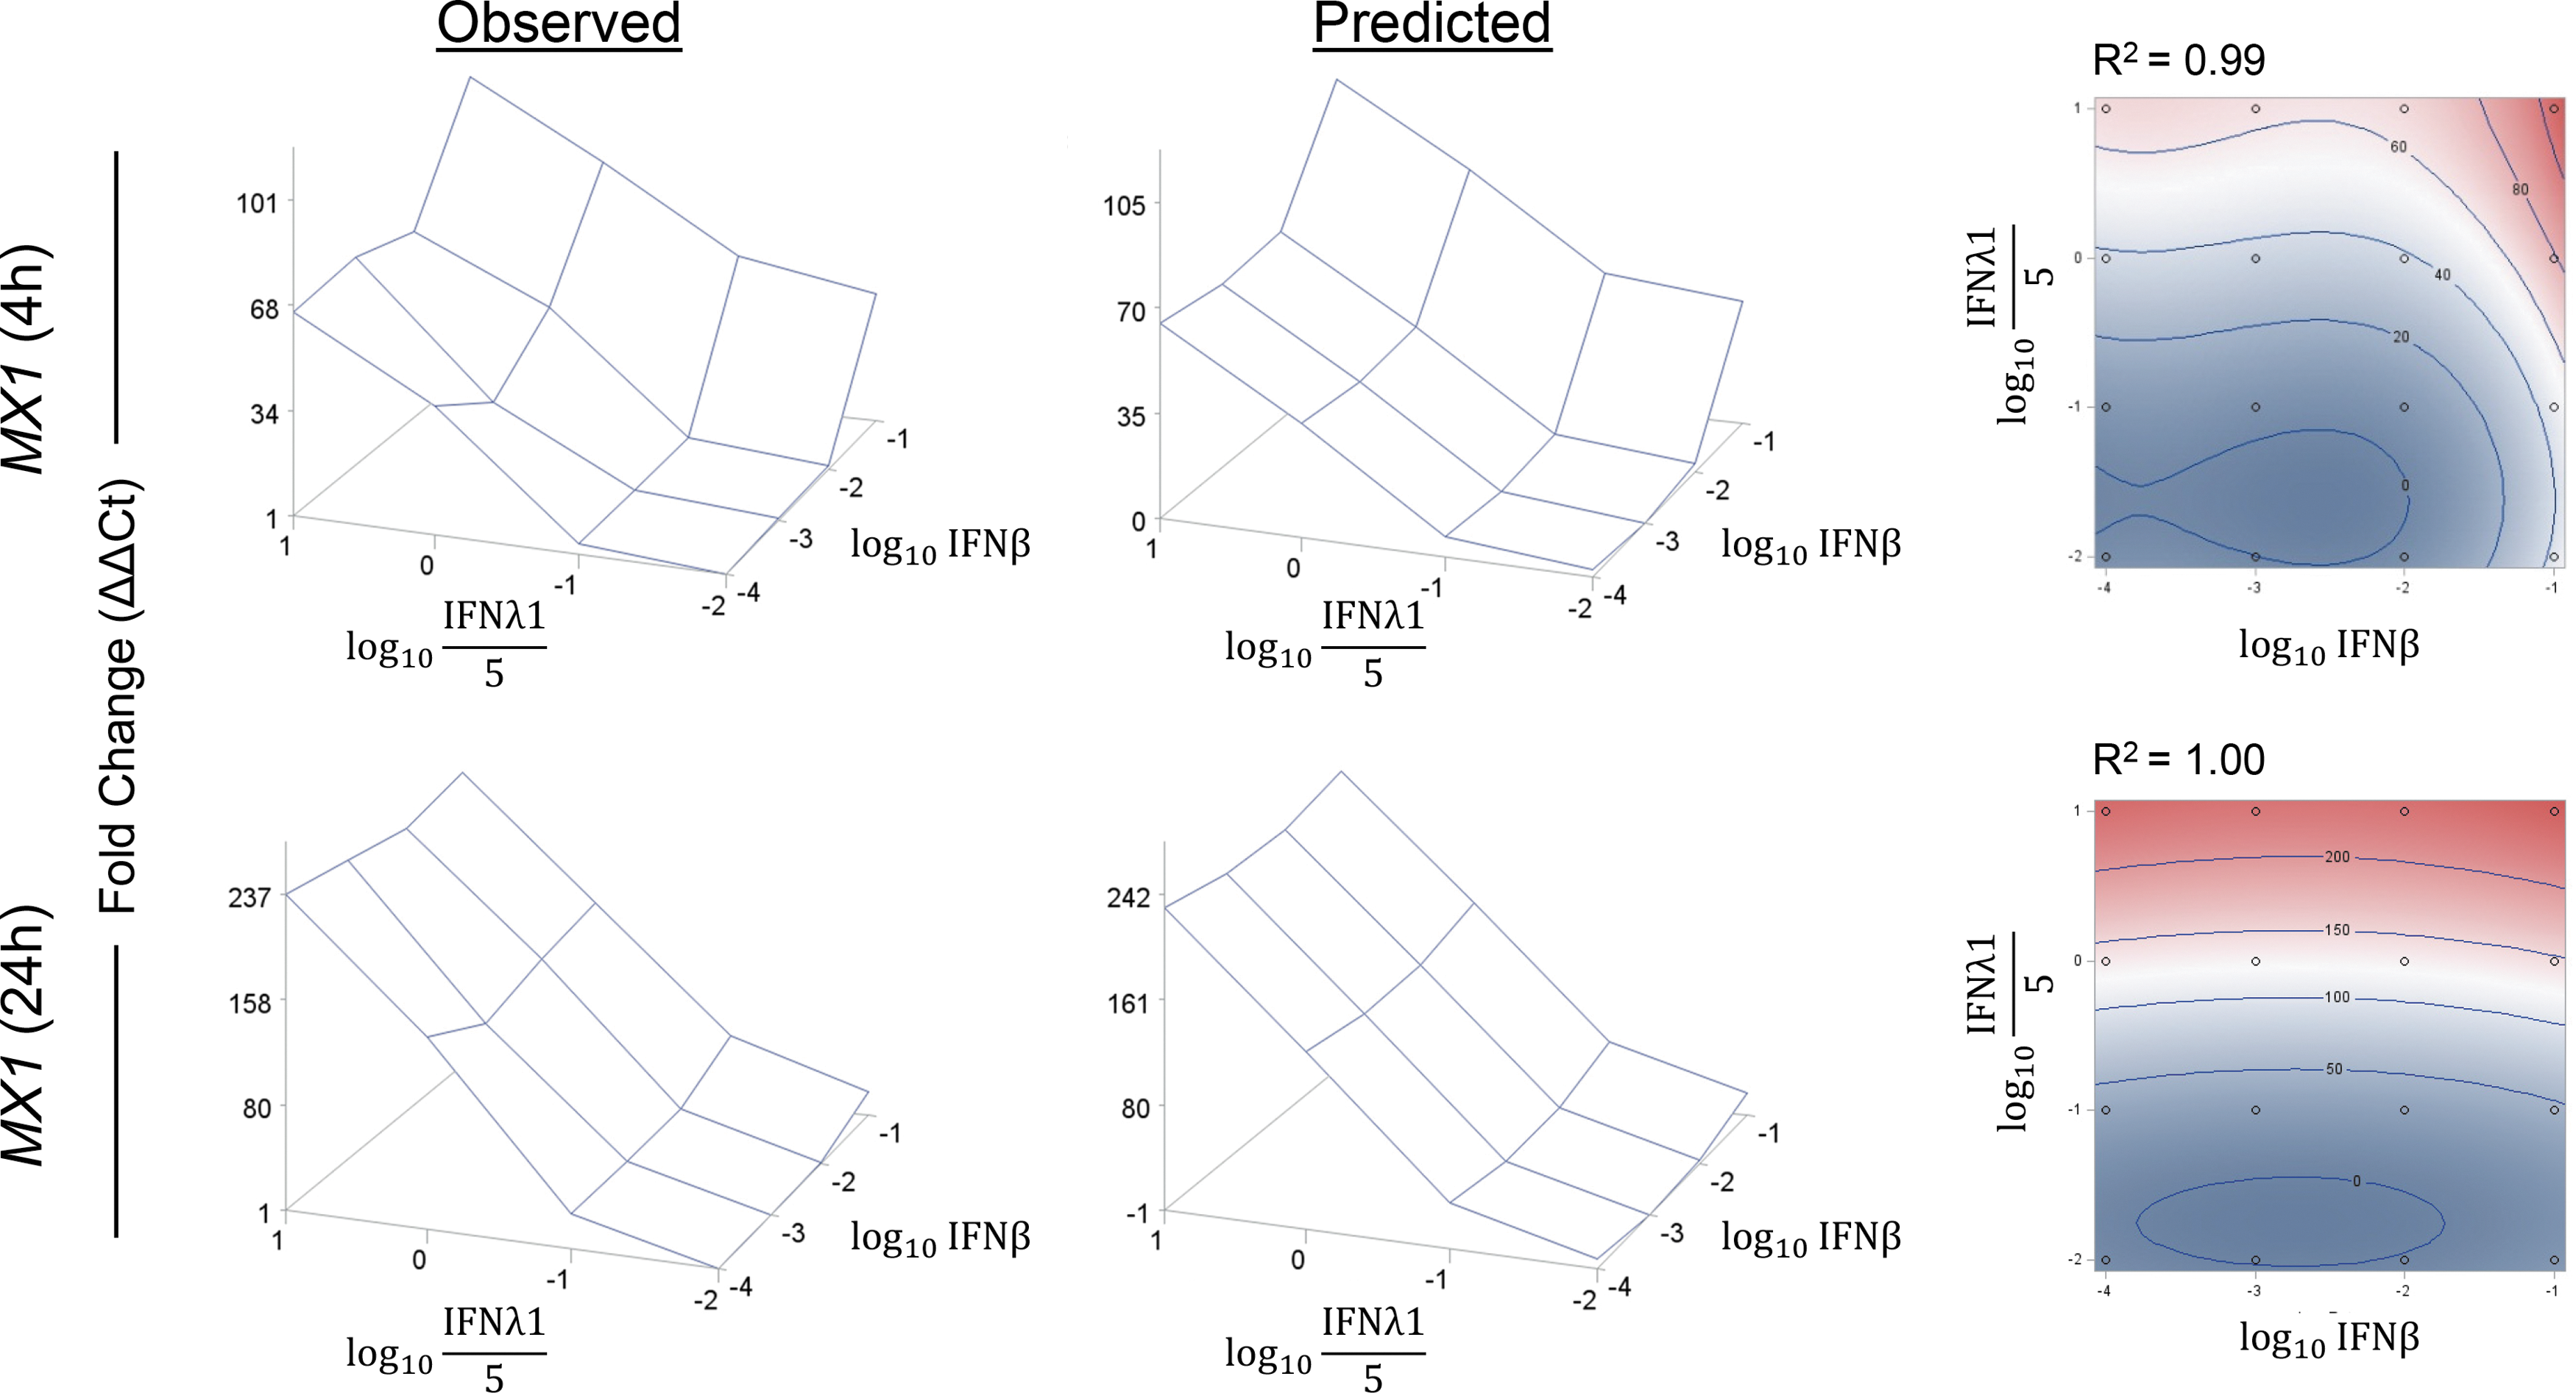
Cubic model of ISG expression by BEAS-2B RECs after combinatorial treatment with IFNβ and IFNλ1. BEAS-2B RECs were treated with IFNβ or IFNλ1, alone or in combination, for 4 or 24 h, and ISG expression was measured by qRT-PCR. Left column: observed expression of ISG transcripts as fold change over the untreated controls (ΔΔCt). Center column: predicted expression of ISG transcripts according to the cubic model. Right column: contour plots that overlay the observed and predicted fold change. One representative set of plots is shown for MX1, an ISG that fits the cubic model. Acceptance criteria for fitting the cubic model were P < 0.001 and R 2 ≥ 0.95. Data shown are the mean of 2 experiments, each performed in triplicate (n = 6).
TF-ISG protein expression induced by IFNβ and IFNλ1
Since many ISGs are post-transcriptionally regulated, we asked whether protein expression of ISGs follows the observed kinetic patterns of their transcripts. Figure 5 shows that saturating doses of either IFNβ (100 ng/mL) or IFNλ1 (500 ng/mL) induced patterns of STAT1, IRF7, and IRF1 protein expression consistent with transcript expression. By contrast, while ISG15 transcript was detected after 2 h of either IFN, we detected ISG15 protein only at 24 h. Similarly, while STAT2 expression peaked at 4 h after IFNβ treatment and decreased at 24 h, protein expression was highest at 24 h after treatment with either IFN. Of interest, phosphorylation (activation) of both STAT1 (Y701) and STAT2 (Y689) was higher in response to IFNβ than IFNλ1, but combination treatment prolonged phosphorylation through 24 h. Combination treatment also enhanced expression of STAT1, STAT2, and ISG15 at 24 h above the level observed for either IFN alone. Among these ISGs, IRF1 was unique. Like its transcript, IRF1 expression peaked at 2 h after IFNβ treatment, but IFNλ1 induced low expression of IRF1 that was sustained through 24 h. Furthermore, IFNβ and IFNλ1 together induced IRF1 expression greater than either IFN alone, and only the combination of IFNβ and IFNλ1 sustained IRF1 protein expression through 24 h.

Western blot for ISG protein expression by BEAS-2B RECs in response to IFNβ or IFNλ1. Data shown are representative of 2 experiments, each performed in duplicate (n = 4).
Discussion
Viral infection induces RECs to coexpress IFNβ and IFNλ1, which in turn induce expression of antiviral ISGs by infected and neighboring cells. To test for nonredundant gene expression and combinatorial effects of type I and III IFNs, we selected doses that reflect higher production, but lower potency of IFNλ1 than IFNβ (Voigt and Yin 2015), and included subsaturating levels of each that mirror the context of small foci of infected cells. Compared to measurement of global gene expression by microarray or RNA-seq, we focused on TF-ISGs so that we could explore a wide range of experimental conditions.
A limitation of our study is the use of a cell line, BEAS-2B REC, rather than primary epithelial cells. We used a cell line to avoid donor variability that is inevitably associated with primary cells and chose the BEAS-2B cell line because its transcriptional response to respiratory syncytial virus (RSV) and influenza is similar to that of primary bronchial epithelial cells (Ioannidis and others 2012). However, it is important to note that transcriptional responses to IFN may vary among nonrespiratory anatomical sites (eg, intestinal epithelia, hepatic cells) or different sites within the lung, such as small airways and alveoli. These differences in response may reflect differences in relative expression of type I or III IFN receptor complexes, differences in histone modification or DNA methylation of ISGs, or expression of miRNA.
An additional limitation is that our experimental design simulated simultaneous coproduction of IFNβ and IFNλ1. We based this design on our unpublished observations of similar kinetics of expression of these 2 IFNs by BEAS-2B RECs in response to poly I:C or RSV. However, viral pathogens that selectively impede expression of IFNβ (influenza A H1N1 may be an example) may disrupt the cooperative effects between IFNβ and IFNλ1 that we observed.
As previously described (Bolen and others 2014), we observed that IFNβ and IFNλ1 induced distinct kinetic responses of ISGs. Specifically, IFNβ induces strong and early peak expression of a set of canonical and TF-ISGs, while IFNλ1 induces a comparatively delayed response. For a subset of ISGs, as exemplified by MX1, early expression induced by IFNβ tapered by 24 h, while expression induced by IFNλ1 was sustained through 24 h. The early tapering of MX1 in response to IFNβ suggests that negative regulators of IFN signaling may activate a feedback loop to control specific aspects of IFNβ response. Of interest, one such negative regulator, SOCS1, is expressed in response to IFNβ, but is minimally responsive to IFNλ1. For another subset of ISGs, including STAT1 and ISG15, the rapid expression induced by IFNβ was sustained, while the expression induced by IFNλ1 gradually rose through 24 h. There were ISGs, however, for which the kinetic response to IFNβ and IFNλ1 was essentially identical, including IRF9, a component of the ISGF3 complex that mediates canonical signaling by both IFNs.
We also observed quantitative differences for a set of ISGs. Within the set, SOCS1 and IRF1 are responsive to IFNβ, but are minimally responsive to IFNλ1 over 24 h. Uniquely, IRF1 expression peaks at 2 h and tapers by 4 h in response to IFNβ, while expression of other ISGs peaks later, at 4 or 24 h. SOCS1 and IRF1 were among the top 7 ISGs identified by HIVE that most contribute to the nonredundancy of IFNβ and IFNλ1. These 7 genes account for 82% of the difference between IFNβ and IFNλ1, thus confirming our categorization of these genes in Table 2 as both quantitatively and kinetically nonredundant. These nonredundancies suggest that IFNβ rapidly induces an antiviral response and prepares the BEAS-2B RECs for a second layer of IFN stimulation by tightly regulating expression of key TF-ISGs and regulators of receptor signaling. In this context, the slow but sustained expression of most ISGs by IFNλ1 complements the paracrine stimulation by IFNβ.
Responses of most, but not all, ISGs modeled to a cubic equation that predicts combinatorial effects of each IFN and maximal levels of expression of each ISG. The cubic model validated additive effects of these 2 IFNs that both employ ISGF3, and also validated the threshold effect in which a small increase in the dose of either IFN induced a disproportionate increase in ISG expression (Fig. 3) that corresponds to the steepness of the slope of a sigmoidal curve. Conceivably, the threshold effect protects against inappropriate induction of an antiviral state by increasing ISG expression by small increments initially, while ensuring an adequate response when necessary—by increasing expression by a large increment at a critical level of IFN stimulation. To our knowledge, this is the first study in which combinatorial effects of IFNs on gene transcription have been fit to a mathematical model. It is not known whether the cuboid model may be generalized to other cell types, other types I and III IFNs, or ligand sets that share receptor chains or signaling pathways, or activate overlapping sets of transcription factors.
Comparison of patterns of expression of transcripts and protein reveal that ISG15 protein expression was delayed compared with its transcript, thus demonstrating the importance of characterizing both protein and transcript expression when exploring the consequences of IFN stimulation. Like its transcript, IRF1 was the earliest TF-ISG expressed in response to IFNβ, suggesting that it may critically regulate the IFN response. While expression of STAT1 and STAT2 was kinetically consistent with their transcripts, they were highly phosphorylated in response to IFNβ, but minimally in response to IFNλ1. Because activated pSTAT has a relatively short half-life (Jaitin and Schreiber 2007; Piehler and others 2012), it is possible that our earliest time point (2 h) may have missed peak STAT1/2 phosphorylation. Irrespective, STAT1/2 phosphorylation is sustained through 4 h in response to IFNβ, but not IFNλ1. By contrast, combinatorial treatment enhanced and sustained STAT1/2 phosphorylation through 24 h. Although we used saturating doses of IFN for the Western blots, it is likely that enhanced STAT1/2 phosphorylation in response to combinatorial treatment with IFNβ and IFNλ1 contributes to the additive effects on ISG expression defined by the cubic model.
Western blot analysis also shows that combinatorial treatment with IFNβ and IFNλ1 enhances and sustains expression of IRF1, and RLDA independently confirmed IRF1 as the most unique TF-ISG that differentiates IFNβ and IFNλ1. Recently, Schoggins and others (2011) illustrated the centrality of IRF1 in antiviral defense by demonstrating that it inhibited a large panel of human viral pathogens, including HIV-1, hepatitis C virus, and yellow fever virus. Consistent with that centrality, IRF1 has over 200 diverse targets in the human genome (Frontini and others 2009), many of which regulate the cellular response to IFN (Reis and others 1992; Kirchhoff and others 1993; Taniguchi and others 2001).
At least 3 factors determine which of the 200 genes IRF1 activates. First, post-translational modification may activate or inhibit IRF1 function. For example, both phosphorylation and SUMOylation block IRF1 function in models of innate immunity, inflammation, and tumorigenesis (Park and others 2007; Sgarbanti and others 2014; Sun and others 2014). By contrast, polyubiquitination activates IRF1 to induce expression of CXCL10 and CCL5 in the IL-1 signaling cascade (Wang and Wang 2014). Second, IRF1 colocalizes with other TFs. For example, IRF1 partners with unphosphorylated STAT1 to induce constitutive expression of LMP2 (Chatterjee-Kishore and others 2000) and, in response to IFNγ, partners with the IFN consensus sequence-binding protein (ICSBP) to induce iNOS expression in macrophages (Xiong and others 2003). Third, IRF1 activity may be modulated by other IRF family members. For example, IRF2 can competitively antagonize binding of IRF1 to target ISRE elements, while IRF8 can, depending on context, either antagonize or cooperate with IRF1 (Sivro and others 2013; Langlais and others 2016). Therefore, the consequences of the early selective IRF1 expression that we observed are likely dependent on many genes that are coexpressed after IFN stimulation, some of which may be IRF1 dependent.
Finally, IRF1 also mediates antiviral defenses by directly regulating expression of type I and III IFNs and components of their shared signaling pathway. For example, IRF1 can contribute to expression of IFNB1 (Miyamoto and others 1988; Reis and others 1992) and IFNL1 (Siegel and others 2011; Ueki and others 2013; Odendall and others 2014), suggesting that IRF1 participates in a positive feedback loop that enhances IFN production and prolongs the IFN response. In addition, IRF1 may activate a positive feedback loop by enhancing expression of downstream signaling components. For example, overexpression of IRF1 in the human melanoma cell line, MM96, increased STAT1, STAT2, and IRF9 expression and enhanced responsiveness to IFNβ (Wong and others 2002; Cheon and others 2011). Recently, Voigt and Yin (2015) used a computational biology approach in human A549 alveolar epithelial cells and found support for divergent and synergistic pathways of type I and III IFNs toward developing an antiviral state. Our data, demonstrating distinct selective and rapid expression of IRF1 transcript and protein in response to IFNβ, suggest that this TF-ISG may mediate nonredundant functions that contribute to the divergence and synergism of type I and III IFNs.
Footnotes
Acknowledgments
This work was supported by FDA/CBER intramural funds and the FDA Medical Countermeasures Initiative. T.C.T and H.A.N were supported by an appointment to the Research Participation Program at the Center for Biologics Evaluation and Research administered by the Oak Ridge Institute for Science Education through an interagency agreement between the US Department of Energy and the US Food and Drug Administration. The authors thank Steeve Boulant and Rachel Gottschalk for critical review of the manuscript.
Author Disclosure Statement
No competing financial interests exist.