
Abstract
Elevated levels of transforming growth factor-β (TGF-β) family mediate myofibroblast generation and extracellular matrix deposition, thus making TGF-β recognized as major profibrogenic cytokines. In this article, we provide evidence that extrahepatic TGF-β2 expression at RNA and protein levels in peripheral leucocytes and serum, respectively, correlate with hepatic fibrogenesis. Current study includes a total of 110 subjects [89 naive hepatitis C virus (HCV)-infected patients (f0–f4) and 21 healthy controls]. Array profiling of 84 fibrosis-related transcripts revealed that TGF-β2 RNA was significantly upregulated compared with controls. Transcription results were confirmed by specific qRT-PCR on TGF-β2 RNA in peripheral leucocytes and TGF-β2 protein by ELISA in serum. PCR array and qRT-PCR for TGF-β2 RNA in peripheral leucocytes revealed that HCV-infected patients, regardless of the degree of fibrosis, had significantly elevated TGF-β2 RNA levels compared with controls (P = 0.018 and 0.047, respectively). This extrahepatic upregulation of TGF-β2 RNA was confirmed by elevated levels of secretory TGF-β2 protein in infected sera (P = 0.001). The Area Under the Curve of the receiver operating characteristic curve for the TGF-β2 protein between patients and controls was 0.80, a value that renders serum TGF-β2 protein a promising biomarker for liver fibrosis.
Introduction
H
The TGF-β superfamily consists of a diverse range of proteins that regulate several, physiological processes, including embryonic development, homeostasis, wound healing, chemotaxis, and cell cycle control (Tandon and others 2010). The TGF-β isoforms (TGF-β1, TGF-β2, and TGF-β3) are synthesized as latent precursors in complex with latent TGF-β binding proteins (LTBP-1, -3, and -4). TGF-β is activated when LTBP is removed extracellularly via proteolytic cleavage. Once activated, TGF-β binds to the TGF-β receptor II (TβRII). This leads to phosphorylation and recruitment of TGF-β receptor type I (TβRI) kinase, resulting in phosphorylation of SMAD2 and SMAD3. Consequently, the activated SMAD2 and SMAD3 form complexes with SMAD4. These complexes translocate into the nucleus, where they regulate the transcription of target genes (Conidi and others 2011; Meng and others 2013; Xie and others 2014). Excessive expression of both TGF-β1 and 2 was observed in liver tissues of patients with chronic HCV infection. (Voumvouraki and others 2010). TGF-β2 has been shown to play an essential role in the development of tumors by regulating key mechanisms, including immunosuppression, metastasis, angiogenesis, cell growth, and differentiation (de Martin and others 1987; Constam and others 1992; Yamamoto and others 2004) and is thought to function as an important mediator in the development of liver fibrosis (Lee and others 2004). TGF-β2 contributes to cell proliferation and α-smooth muscle actin (α-SMA) expression in myofibroblasts (Batra and others 2004). Not only liver but also kidney fibrosis has been shown to be stimulated by TGF-β2 (Hill and others 2001; Lee and others 2004). Herein, we aim to check whether circulating TGF-β2 serves as a marker for HCV-associated fibrosis. Extrahepatic transcriptomic profiling of 84 fibrosis-related transcripts were performed on 15 treatment-naive HCV G4-infected patients, where remarkable upregulation of TGF-β2 mRNA was significantly recorded. This mRNA overexpression was confirmed in a larger cohort of 74 HCV-infected patients (ie, total of 89 fibrotic patients +21 controls) via qRT-PCR in peripheral leucocytes and at protein levels in patients' sera.
Materials and Methods
Patients
Eighty-nine treatment-naive patients with chronic HCV genotype 4 infection and 21 healthy individuals were enrolled in the study. Controls have no signs of liver diseases—no HCV, no HBV, no autoimmune hepatitis, no schistosomiases, no alcohol intake, no fatty liver, and normal liver function tests. Furthermore, controls had generally normal laboratory test values, no tumors, malfunctions, metabolic disorders, or any sign of fibrosis in major organs. Ages of all subjects ranged from 25 to 52 years. All the patients were recruited from Ahmed Maher Teaching Hospital, Ministry of health and population, Egypt. All patients were positive for both anti-HCV antibody and serum HCV RNA. The liver fibrosis has been evaluated histologically by METAVIR scoring and/or transient elastography (Fibroscan) measurements. Exclusion criteria of patients included, coinfection with HBV or schistosomiases, excessive alcohol intake, NASH, or autoimmune disease. All experiments were approved by the Institutional Ethical Review Board (Medical Research Ethics Committee at the National Research Center, IRB 13–106; Cairo, Egypt) according to the Declaration of Helsinki 1975, revised in 2008, and performed with the understanding and the consent of the human subjects. Informed consent was obtained from each subject before collecting blood samples.
Extraction of total RNA from whole blood
Total RNA was isolated from whole blood using the single-step method described by (Chomczynski and Sacchi 1987). The concentration and purity of the RNA were determined using NanoDrop (USA; UV-VIS-Spectrophotometer Q 5000) before proceeding to the array and real-time PCR assays.
Array profiling and qRT-PCR
The purified RNA (800 ng for PCR array, 200 ng for qRT-PCR) was reverse transcribed into cDNA using reverse transcriptase (SABioscience, Frederick, MD) according to the manufacturer's instructions. For human fibrosis RT2 Profiler™ PCR array experiments (PAHS: 120Z, SABiosciences), 102 μL of the synthesized cDNA was mixed with 1150 μL RT2 SYBR Green/ROX qPCR master mix (SABiosciences), and 1048 μL RNAse-free water was added till a final volume of 2300 μL. In qRT-PCR, 1 μL of cDNA and 1 μL of gene-specific PCR primers for human TGF-β2 (10 μM; SABiosciences) were mixed together with RT2 SYBR Green/ROX qPCR master mix (SABiosciences) in a final volume of 25 μL. The house-keeping gene human hypoxanthine phosphoribosyltransferase 1 (HPRT1) (SABiosciences) was used as endogenous reference to normalize differences in the amount of input cDNA in each assay. The thermal profile of amplification was as follows: initial incubation for 10 min at 95°C followed by 40 cycles at 95°C for 15 s and 60°C for 1 min. Amplification was performed using Rotor Gene real-time PCR system (Qiagen, Santa Clarita, CA). Transcriptomic analyses were performed on 84 genes involved in fibrosis according to their function as follows: Profibrotic: ACTA2 (a-SMA), AGT, CCL11 (Eotaxin), CCL2 (MCP-1), CCL3 (MIP-1a), CTGF, GREM1, IL13, IL13RA2, IL4, IL5, and SNAI1 (Snail).
Antifibrotic: BMP7, HGF, IFNG, IL10, and IL13RA2.
Extracellular matrix and cell adhesion ECM components: COL1A2, COL3A1.
Remodeling enzymes: LOX, MMP1 (Collagenase 1), MMP13, MMP14, MMP2 (Gelatinase A), MMP3, MMP8, MMP9 (Gelatinase B), PLAT (tPA), PLAU (uPA), PLG, SERPINA1 (α1-antitrypsin), SERPINE1 (PAI-1), SERPINH1, TIMP1, TIMP2, TIMP3, and TIMP4.
Cellular adhesion: ITGA1, ITGA2, ITGA3, ITGAV, ITGB1, ITGB3, ITGB5, ITGB6, and ITGB8.
Inflammatory cytokines and chemokines: CCL11 (Eotaxin), CCL2 (MCP-1), CCL3 (MIP-1α), CCR2, CXCR4, IFNG, IL10, IL13, IL13RA2, IL1A, IL1B, IL4, IL5, ILK, and TNF. Growth factors: AGT, CTGF, EDN1, EGF, HGF, PDGFA, PDGFB, and VEGFA.
Signal transduction TGF-β Superfamily: BMP7, CAV1, DCN, ENG (EVI-1), GREM1, INHBE, LTBP1, SMAD2, SMAD3, SMAD4, SMAD6, SMAD7, TGFB1, TGFB2, TGFB3, TGFBR1 (ALK5), TGFBR2, TGIF1, THBS1, and THBS2
Transcription factors: CEBPB, JUN, MYC, NFKB1, SP1, STAT1, and STAT6
Epithelial-to-mesenchymal transition: AKT1, BMP7, COL1A2, COL3A1, ILK, ITGAV, ITGB1, MMP2 (Gelatinase A), MMP3, MMP9, SERPINE1 (PAI-1), SMAD2, SNAI1 (Snail), TGFB1, TGFB2, TGFB3, and TIMP1.
Others: BCL2 and FASLG (TNFSF6).
Detection of serum TGF-β2 by enzyme-linked immunosorbent assay
Serum levels of TGF-β2 were measured after acid activation by commercial enzyme-linked immunosorbent assay (ELISA) kit for TGF-β2, according to the manufacturer's protocols (DRG, Marburg, Germany). In brief, 100 μL of diluted samples and standards were pipetted into the reaction wells of a microplate for 3 h at room temperature, rinsed with washing buffer for 3 times, and followed by adding 100 μL of Enzyme Conjugate, incubated for 2 h. The wells were then washed 3 times using the washing buffer followed by adding 100 μL of Enzyme Complex, incubated for 20 min. After several washes with the washing buffer, the substrate solution (100 μL) was added into the wells and incubated for 10 min. The reaction was stopped by adding 50 μL of stop solution and the absorbance was measured at 450 nm in a spectrophotometer (ELISA reader). The serum concentration of TGF-β2 in the samples was determined by comparing the O.D. of the samples to the standard curve.
Statistical analyses
Comparison of parameters with a normal distribution were done with analysis of variance (ANOVA) and are presented as the mean ± standard error of the mean, while t-test and nonparametric Mann–Whitney test were used to compare 2 groups. P value ≤0.05 was considered significant. To visualize the capacity of a given molecular marker to discriminate between 2 populations, we summarized the data in a receiver operating characteristic (ROC) curve. All statistical analyses were performed with SPSS version 16.0 statistical software.
Results
Patient's characteristics
The univariate analyses of laboratory tests in fibrotic HCV patients and healthy controls excluded significant differences in sex, hemoglobin (HB), albumin (Alb), white blood cells (WBCs), total bilirubin (BILT), and platelets counts, while age, alanine aminotransferase (ALT), and aspartate aminotransferase (AST) were significantly higher in HCV-infected patients compared with controls (Table 1). No specific reason for selecting ALT, AST, HB, WBCs, Creatinine, and BILT to be analyzed.
Data are expressed as mean ± standard error of mean.
The bold represents a significant value. (P value ≤0.05 considered statistically significant.)
HCV, hepatitis C virus; HB, hemoglobin, WBC, white blood cell, ALT, alanine transaminase, AST, aspartate transaminase, ALB, albumin, BIL T, total bilirubin, N, number of cases.
Expression profiling of fibrosis-related genes in HCV-infected patients relative to controls
To evaluate the role of HCV infection on expression profiling of fibrosis-related genes, 84 human transcripts for genes involved in fibrogenesis were examined using RT2 Profiler PCR array plates. The assay was performed according to the instructions by the manufacturer. The magnitude of dysregulation was determined for the test genes in peripheral leucocytes of 15 HCV-infected patients compared with 6 healthy controls. The data analysis has been performed through the following website (
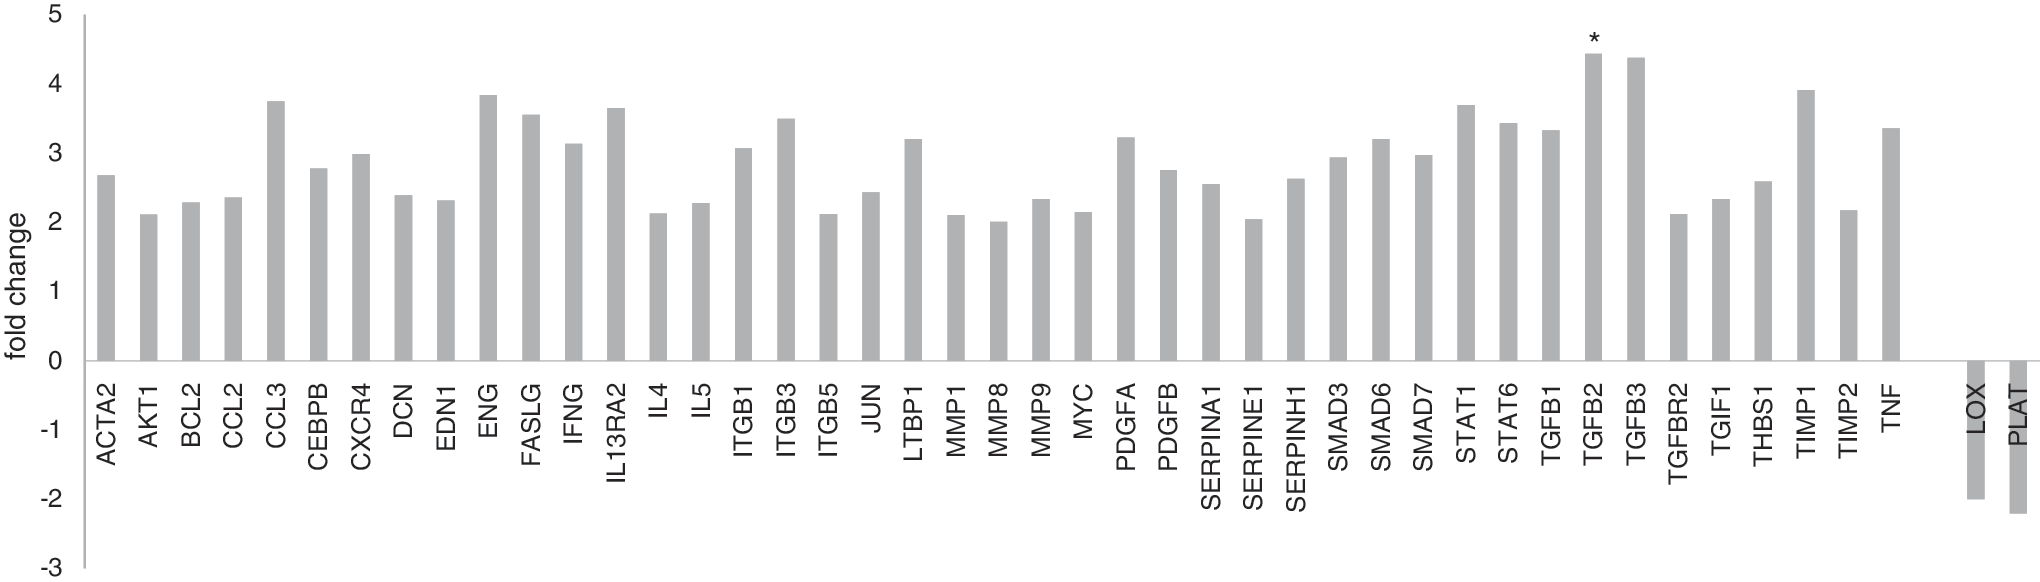
Fold dysregulation of Fibrosis related genes in chronic HCV infected patients (n = 15) compared with normal subjects (n = 6). Bars above the X axis represent the upregulated genes, while bars below the X axis represent the downregulated genes. HCV, hepatitis C virus. (*P value ≤ 0.05 is considered statistically significant.)
Dysregulation of TGF-β2 gene in HCV-infected patients
Besides the 15 patients and 6 controls who have been examined by array profiling, the RNA abundance of TGF-β2 gene in peripheral leucocytes was examined by qRT-PCR in 89 subjects (74 HCV patients and 10 healthy controls). The relative expression values of TGF-β2 transcripts were normalized to expression of the constitutively expressed HPRT1 gene. The TGF-β2 showed statistical significance in its expression in patients relative to healthy controls (fold change ≥1.7, P = 0.047) as shown in Figure 2.
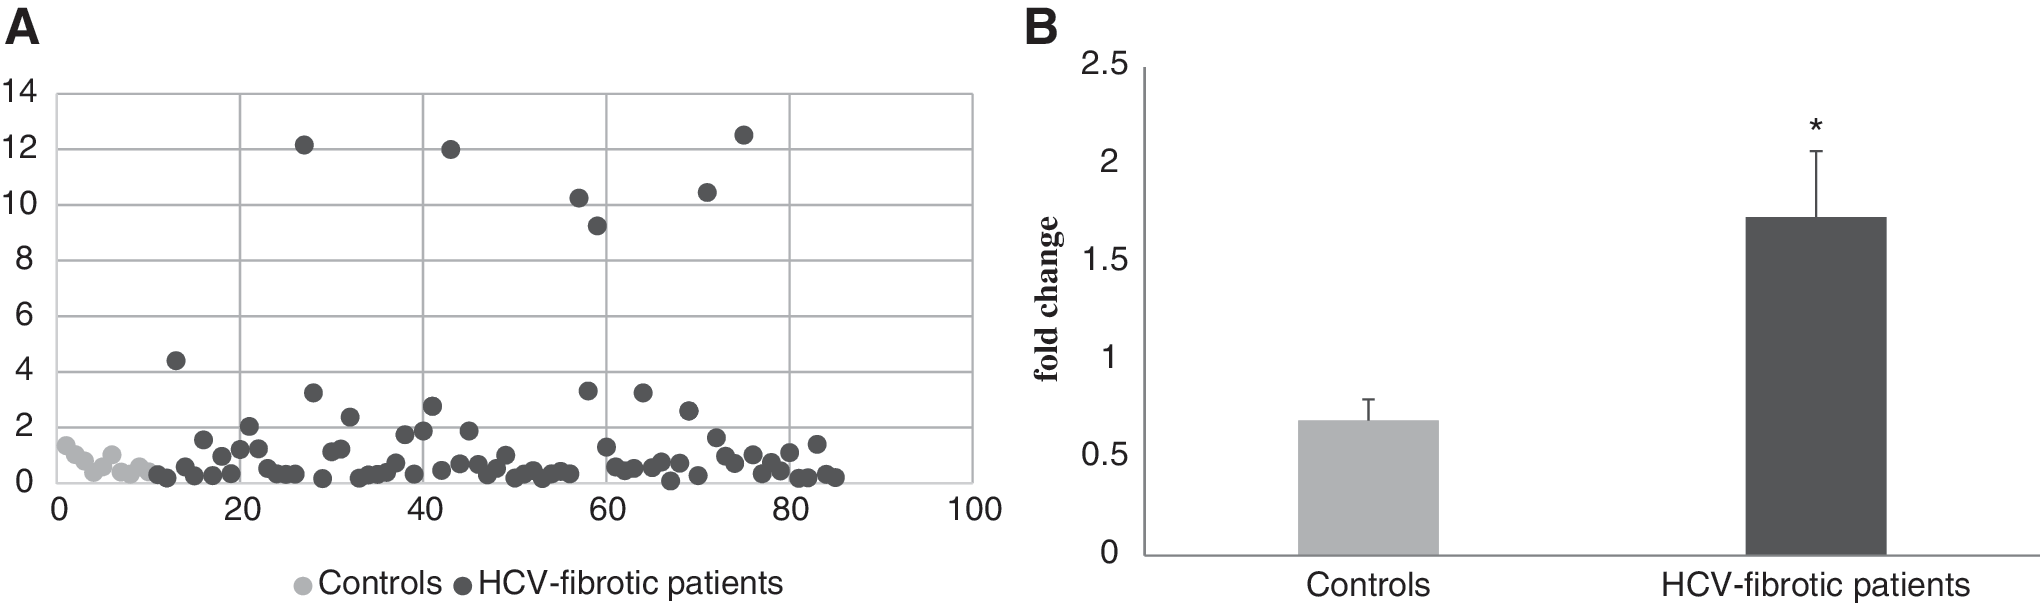
Diagrammatic representation of TGF-β2 gene transcripts by scatter plot
Comparison between circulating levels of TGF-β2 protein in fibrotic patients versus controls
To check whether the observed upregulation of TGF-β2 at mRNA levels is reflected as a parallel rise at serum protein level, ELISA assay (DRG) was applied on sera of the same patient cohort and controls. Figure 3 shows that TGF-β2 protein was significantly elevated in HCV-infected patients than healthy controls (P = 0.001).

Graphic demonstration of secreted level of TGF-β2 Protein by scatter plot
Statistical testing of TGF-β2 protein as a potential noninvasive biomarker for HCV-induced HF
The capability of serum levels of TGF-β2 protein to differentiate between HCV fibrotic patients and healthy controls was verified by applying ROC curve analysis. Serum levels of TGF-β2 protein calculated Area Under the Curve (AUC) as (AUC = 0.80) at a cut off = 241 pg/mL and at 76.46% sensitivity and 80% specificity (Fig. 4). Based on this statistical evaluation, serum TGF-β2 protein levels might be considered a noninvasive, simple, and less expensive biomarker for HF induced by HCV genotype 4 infection.
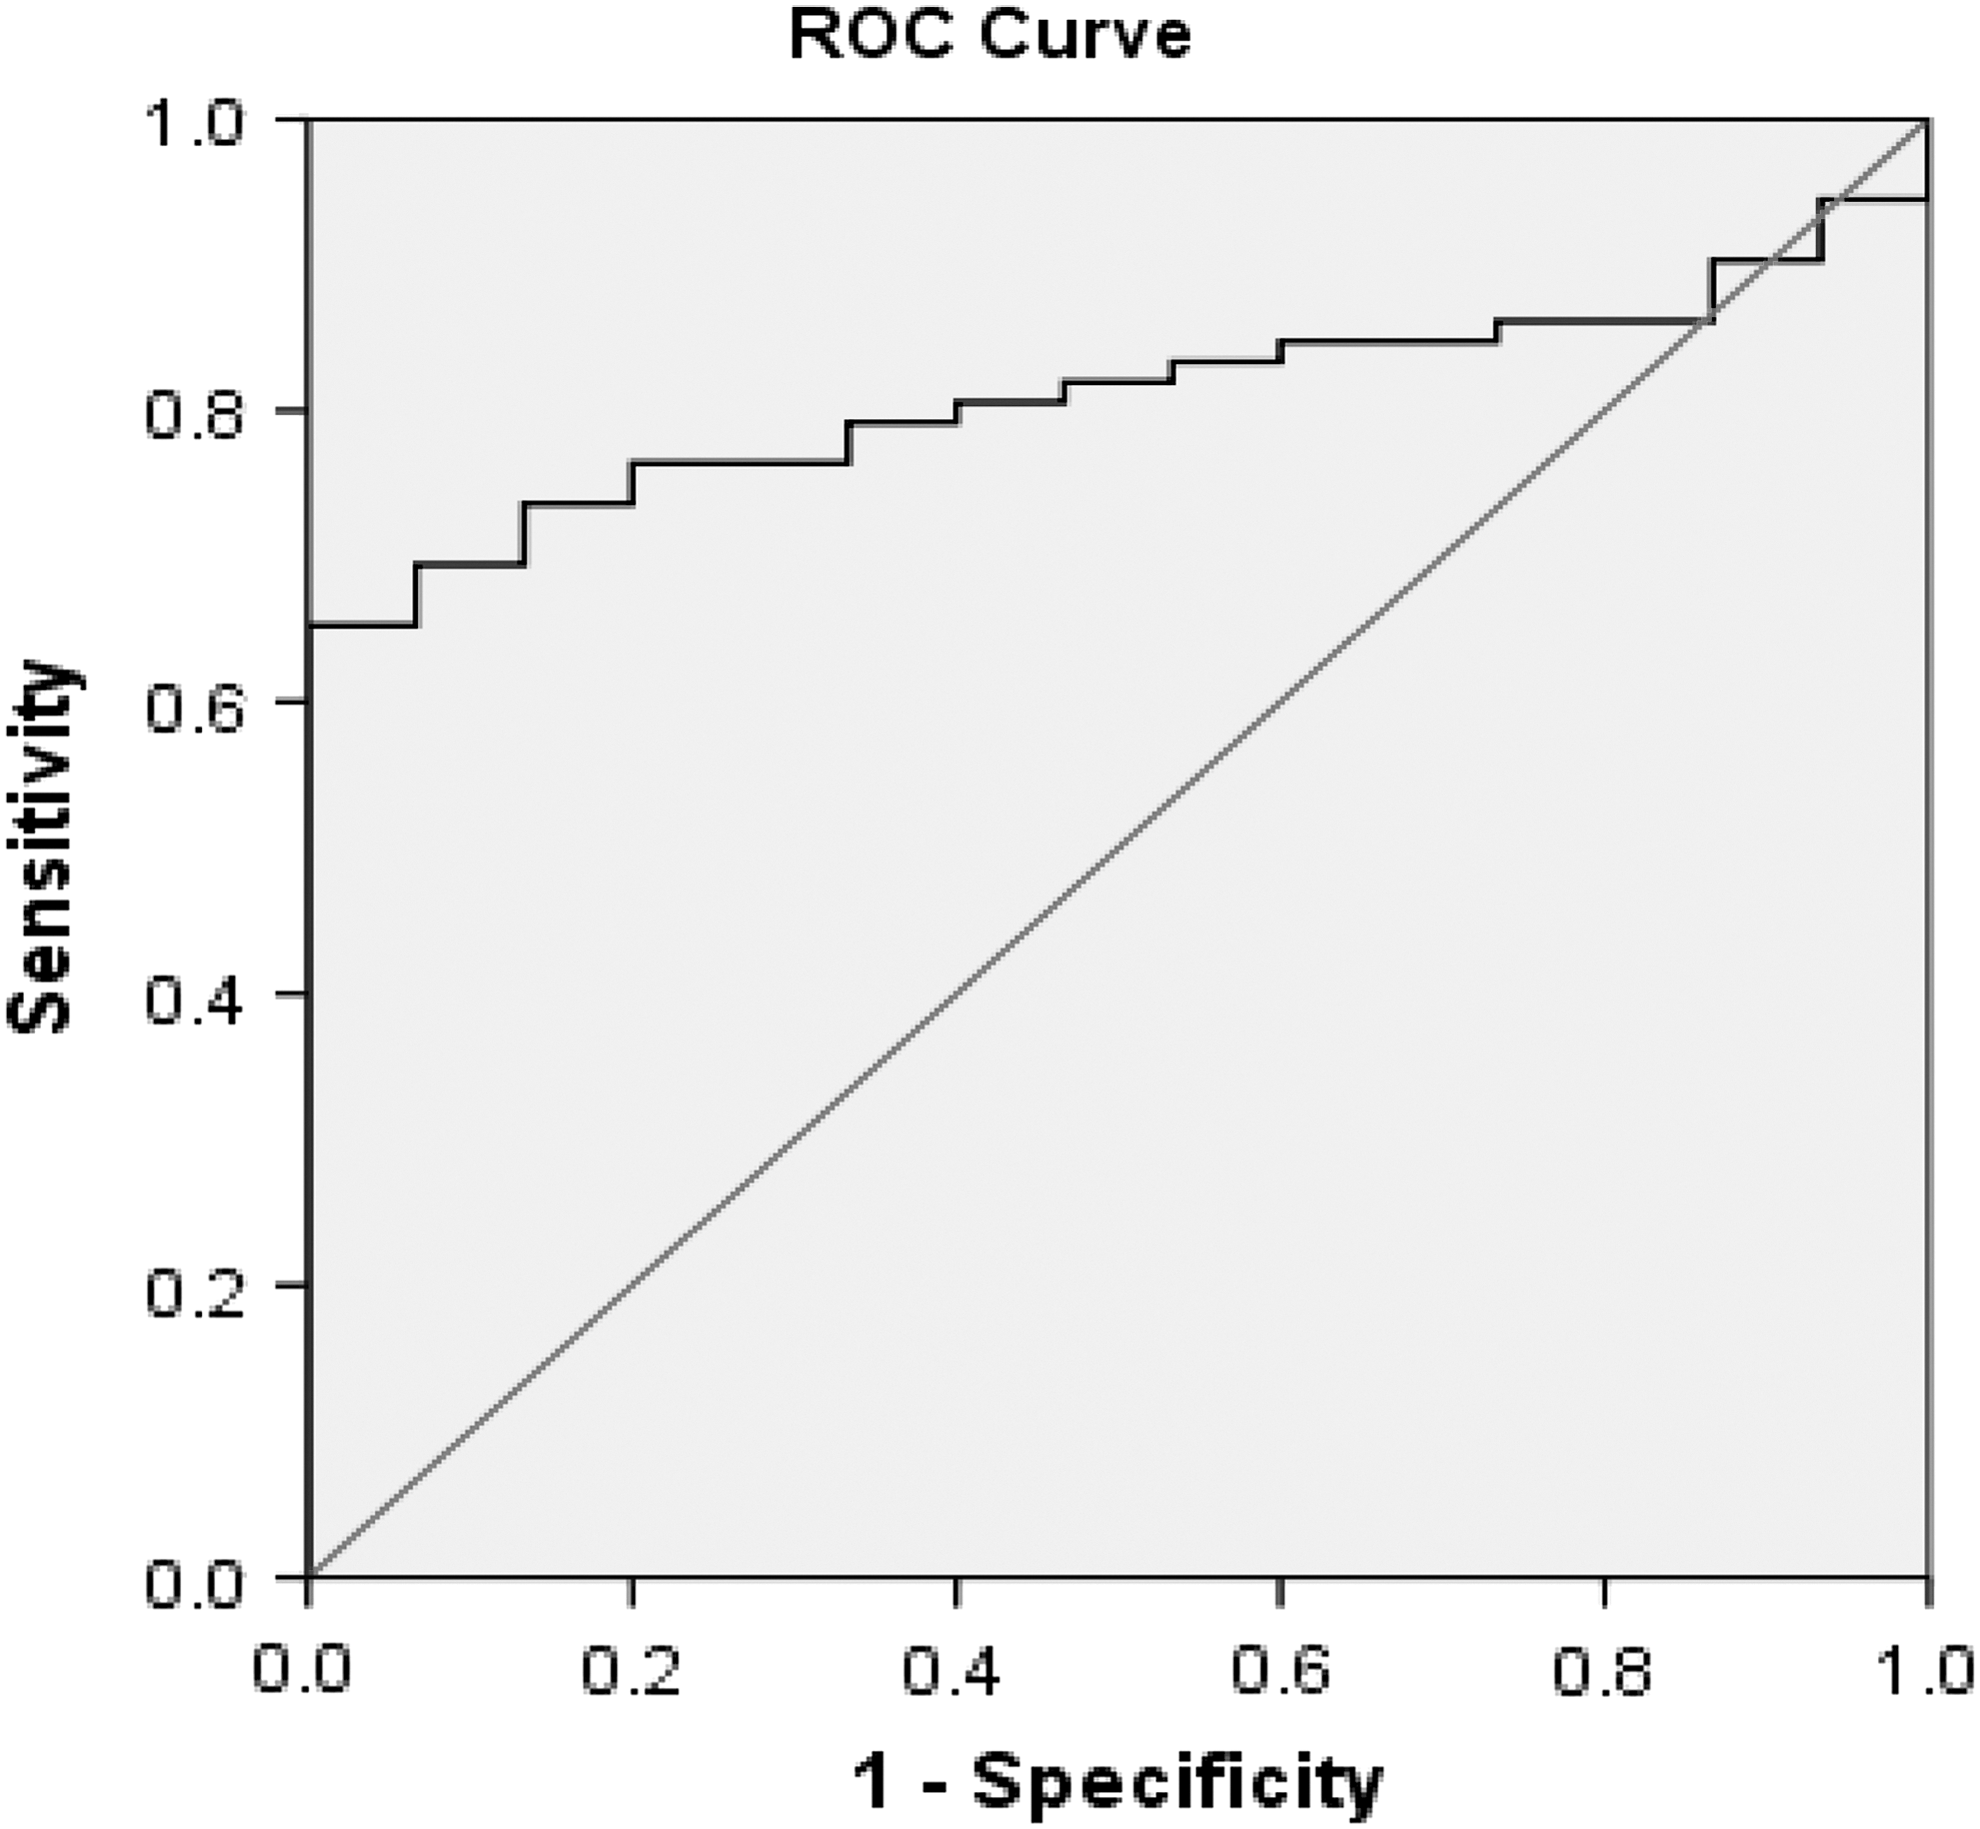
ROC curve analysis was used to predict the clinical significance for the expression of serum TGF-β2 in HCV fibrotic patients (n = 74) compared with healthy controls (n = 15). ROC, receiver operating characteristic.
Discussion
Chronic infection with HCV is a major health problem in Egypt, being the main cause of liver fibrosis, cirrhosis, liver transplantation, and HCC (Pereira Tde and others 2010). Liver fibrosis occurs at the early stage of chronic HCV infection. Early detection and monitoring the progression of liver fibrosis allow rapid intervention to improve the outcome of anti-HCV treatment. Noninvasive abdominal examination by ultrasonic technology and transient elastography are the current radiological tools to screen disease progression of HCV-related liver disease (Smith and Sterling 2009; Cheng and others 2017). The precision of image examination depends on the experience of the operator and suspicious interpretation. Serum biomarkers provide a supplemental approach for diagnosis and monitoring the progression of HCV-induced liver fibrosis. It has been shown that TGF-β polypeptides stimulate the production of ECM components and inhibit their degradation in many tissues (Finnson and others 2013). Inhibition or modulation of TGF-β effects may represent potential approaches to fibro-prevention or antifibrotic therapy. Current data illustrate that expression levels of mRNA of TGF-β2 gene were significantly upregulated in peripheral leucocytes of chronic HCV-infected patients, and these results apparently confirm studies on intrahepatic TGF-β mRNA expression within the liver (Kanzler and others 2001; Debes and others 2016). Furthermore, TGF-β2 protein is significantly higher in the serum of fibrotic patients compared with age- and sex-matched healthy subjects (P = 0.001), These data support, partially, earlier reports that there is a significant correlation between serum level of TGF-β isoforms and progression to liver fibrosis in patients with untreated chronic HCV infection (Kanzler and others 2001). Chida and others showed that serum TGF-β2 levels were higher in patients with chronic HCV infection than in healthy controls and demonstrated a positive correlation between serum TGF-β2 levels and the stages of HF in HCV patients with early HF (F0–F2) (Chida and others 2017). Current data confirmed those of Chida and others that patients with early HF had elevated serum TGF-β2 levels compared with controls (results not shown). It has been recently hypothesized that HCV infection activates cyclic AMP-responsive element-binding protein H (CREBH) that subsequently upregulates TGF-β2 expression and promotes profibrogenic responses in HSCs adjacent to HCV-infected cells (Chida and others 2017). The role of TGF-β2 in inducing fibrotic markers has been previously elucidated by Carrington and others and Yu and others (Carrington and others 2006; Yu and others 2016). Wei and others 2015 revealed that higher serum TGF-β3 levels in nonalcoholic fatty liver disease (NAFLD)—devoid subjects may have a higher chance of developing NAFLD in the future. The profibrogenic effect of TGF-β2 is not limited to HSC of the liver, as animal studies by Wang and others showed that i.p. administration of TGF-β2 in combination with connective tissue growth factor (CTGF) to mice induced fibrosis in all abdominal organs, including the liver (Wang and others 2011b). In chronic HCV patients, both TGF-β2 and its signal transducer SMAD2 were concomitantly upregulated at transcriptional level (Shirasaki and others 2014). Catenin and TGF-β2 were reported as potential targets for treatment of HF by miR-200a (Sun and others 2014). The expression of TGF-β2 at the mRNA level and at the protein level was diminished upon treatment with miR-200a in cases with renal fibrogenesis (Wang and others 2011a). In vitro studies by Fleenor and others (2006) demonstrated overexpression and secretion of both fibronectin and plasminogen activator inhibitor-1 in response to stimulation with the cytokine TGF-β2 in cultured human trabecular meshwork cells. Furthermore, a couple of previous studies uncovered a universal organ size control mechanism in metazoan, showing that Yap (Yes-associated protein) overexpression in the liver increased liver mass in conditional YAP transgenic mouse model and strongly induced mRNA of TGF-β2 expression (Dong and others 2007; Tschaharganeh and others 2013). Interestingly, TGF-β2 protein was significantly elevated in mice with bile duct ligation and at different time points of liver disease progression in the multidrug resistance gene 2-knockout mice (MDR2-KO). This suggests a specific role of TGF-β2 in the development of biliary-derived liver damage, which was already implicated in early results by Milani and others (1991) who found higher expressions of TGF-β1 and 2 particularly TGF-β2 in bile duct epithelial cells of fibrotic livers. The functional link between TGF-β2 levels and biliary-derived liver diseases was reported early by Shackel and others (2001). A more prominent role of TGF-β2 than TGF-β1 signaling in tumorgenic alteration was suggested by the studies of Dropmann and others (2016) on 2 hepatic cell lines that is, Hep3B and Huh7. Together, these findings indicate possible mechanistic links for TGF-β2 biochemical network and provide rationales for investigating TGF-β-related pathways in liver disease of different etiologies.
Despite the limitation of this study that ROC analysis was performed on a relatively small sample size, serum levels of TGF-β2 obviously differentiate patients with HF from healthy controls, with the AUC of the ROC analysis reaching the value 0.8 (ie, high discrimination power between the 2 sets of subjects). Thus, TGF-β2 may, therefore, be a potential noninvasive biomarker for monitoring the progression of HF in HCV genotype 4 infections.
Footnotes
Acknowledgment
Support was provided by Science and Technology Development Fund in Egypt (STDF) project number 3365. The funder had no role in study design, data collection and analysis, decision to publish, or preparation of the article.
Authors' Contributions
Study concept and design: Mostafa El Awady and Reham Dawood. Analysis and interpretation of data: Reham Dawood and Mai Abd el-Meguid. Drafting of the article: Mai Abd el-Meguid and Reham Dawood. Critical revision of the article for important intellectual content: Mostafa El Awady. Sample collection and clinical evaluation: Mohamed Mokhlas. Statistical analysis: Mai Abd el-Meguid.
Author Disclosure Statement
No competing financial interests exist.