




Abstract
Interferon beta (IFNβ) is a well-known cytokine, belonging to the type I family, that exerts antiviral, immunomodulatory, and antiproliferative activity. It has been reported that the artificially deamidated form of recombinant IFNβ-1a at Asn25 position shows an increased biological activity. As a deepening of the previous study, the molecular mechanism underlying this biological effect was investigated in this work by combining experimental and computational techniques. Specifically, the binding to IFNAR1 and IFNAR2 receptors and the canonical pathway of artificially deamidated IFNβ-1a molecule were analyzed in comparison to the native form. As a result, a change in receptor affinity of deamidated IFNβ-1a with respect to the native form was observed, and to better explore this molecular interaction, molecular dynamics simulations were carried out. Results confirmed, as previously hypothesized, that the N25D mutation can locally change the interaction network of the mutated residue but also that this effect can be propagated throughout the molecule. In fact, many residues not involved in the interaction with IFNAR1 in the native form participate to the recognition in the deamidated molecule, enhancing the binding to IFNAR1 receptor and consequently an increase of signaling cascade activation. In particular, a higher STAT1 phosphorylation and interferon-stimulated gene expression was observed under deamidated IFNβ-1a cell treatment. In conclusion, this study increases the scientific knowledge of deamidated IFNβ-1a, deciphering its molecular mechanism, and opens new perspectives to novel therapeutic strategies.
Introduction
Interferon beta (IFNβ) is a widely expressed cytokine belonging to type I interferon superfamily. From a structural perspective, the protein presents 5 α-helices connected by 4 loops: the longest one, the AB loop, that links A and B helices, and 3 shorter loops, BC, CD, and DE, that connect the rest of the helices (Karpusas and others 1997).
IFNβ shows different biological functions: mainly antiviral, antiproliferative, and immunomodulatory activities. For this reason, several recombinant human IFNβ forms have been produced to treat different diseases. In particular, recombinant IFNβ-1a is commercially available as biotherapeutic for the treatment of multiple sclerosis relapsing form (Ravandi and others 1999; Revel 2003). This recombinant IFN is produced in Chinese hamster ovary (CHO) cell lines and it is characterized by a specific glycosylation pattern: a conserved fucosylated and sialylated biantennary core structure, namely the G2S2F chain (Conradt and others 1987; Mastrangeli and others 2015).
IFNβ-1a exerts its biological response through the binding to the common type I interferon receptor (IFNΑR). This heterodimeric receptor is composed of a low affinity subunit, called IFNΑR1, and a high affinity subunit, named IFNΑR2. For what concerns the mechanism of action, IFNβ-1a binds first IFNΑR2 and subsequently recruits IFNΑR1 to form the ternary activated complex (Thomas and others 2011). Upon the ternary complex formation, the 2 receptor-associated protein tyrosine kinases, namely janus kinase 1 (JAK1) and tyrosine kinase 2 (TYK2), undergo transphosphorylation and sustained activation. Once activated, these kinases phosphorylate signal transducer and activator of transcription (STAT) proteins, especially STAT1 and STAT2, which in turn form a dimer.
IFN-regulatory factor 9 (IRF9) binds the STAT1::STAT2 dimer to form a complex called interferon-stimulated gene factor 3 (ISGF3). ISGF3 moves to the nucleus inducing the expression of interferon-stimulated genes (ISGs) (Piehler and others 2012). In this scenario, the IFNβ-1a binding affinity to its receptor plays a key role in the biological response of the therapeutic molecule, and a stronger antiproliferative and antiviral effect has been reported for this IFNβ with respect to other type I interferon forms, due to its higher affinity for both IFNAR1 and IFNAR2 (Karpusas and others 1998; Kalie and others 2007).
However, the biological activity can be influenced by post-translational modifications (PTMs), and among the most common effects, the role of glycosylation as a PTM has been well established. Many published studies demonstrated in fact that pharmacological activity (Mitsui and others 1993; Mastrangeli and others 2016) and stability (Conradt and others 1987) were higher in the glycosylated than aglycosylated form of IFNβ-1a, while a lower aggregation propensity is typical of glycosylated IFNβ-1a (Mitsui and others 1993).
However, glycosylation is not the only PTM able to affect IFNβ-1a activity. Although deamidation is often related to protein degradation, previous studies showed an increased biological activity of IFNβ-1a after artificial deamidation (Mastrangeli and others 2016). Indeed, contrary to the other type I interferons, IFNβ consists of the presence of a specific consensus sequence for deamidation, namely the Asn-Gly (NG) one (Chelius and others 2005). The IFNβ-1a deamidated analog is essentially a protein identical to the native one in which the asparagine at position 25, according to the native IFNβ-1a form numbering, is deamidated in aspartate (Mastrangeli and others 2016).
As reported by Mastrangeli and others (2016), an artificial deamidation treatment leads to an almost fully deamidated IFNβ-1a form (about 98% of deamidation), without affecting other properties, like methionine oxidation, protein aggregation, glycosylation, and secondary and tertiary structure content.
In this study, a combination of experimental procedures and computational structural analyses was applied to further clarify the effect of artificial deamidation previously observed on the structural and functional behavior of recombinant IFNβ-1a. A comparison between the human native (the commercial IFNβ-1a product) and deamidated forms of IFNβ-1a was carried out, including cell-based assays, surface plasmon resonance (SPR) analysis, and molecular dynamics (MD) simulations, to elucidate such effects. The final purpose of this study is to shed light on the putative structural mechanism hypothesized by Mastrangeli and others (2016) by which the deamidated analog shows an increased biological activity.
Materials and Methods
Recombinant IFNβ-1a
Highly purified IFNβ-1a was supplied by Merck. The production method used a recombinant expression of the protein in a CHO-K1-derived cell line using a commercial serum-free medium. Crude harvests were processed through a series of chromatographic steps, which included affinity, ion exchange, reversed phase, and size exclusion chromatography. The final IFNβ-1a was formulated and stored in sodium acetate with a pH of 3.8.
IFNβ-1a deamidation
As previously described by Mastrangeli and others (2016), the artificial deamidated interferon was prepared by incubating IFNβ-1a sample into 1.2 M Ammonium Bicarbonate pH 9.2 at +23°C for 20 h. The deamidation buffer was then removed by ultrafiltration through Amicon Ultra 10k and buffer exchanged with Sodium Acetate buffer pH 3.8. After deamidation process, deamidated analog and IFNβ-1a concentration was verified measuring the absorbance at 280 nm through nanodrop considering the molar extinction coefficient (ɛ).
Immunomodulatory assay
The immunomodulatory assay is based on the ability of IFNβ to upregulate the MHC class I expression on the A549 cells in a dose-related manner. A549 cell line is received from ATCC. Cells were cultured at 37°C ± 0.5°C, 5% CO2 in DMEM(1 × )+GlutaMAX (cat. 31966-021; Gibco) in presence of 10% fetal bovine serum (FBS, cat. 10270; Fisher scientific) and 1% penicillin and streptomycin antibiotics (cat. 15140-122; Gibco). When adherent cells have reached 80% confluence, they were detached with trypsin (cat. ECB3052D; Euroclone) and resuspended in culture medium at 0.65 × 10⁶ cells/mL. Fifty microliters per well of this cellular suspension was added in a black 96-well plate. Cells were treated with IFNβ-1a and its deamidated analog dilution curve in a range from 200 to 0.000102 ng/mL and incubated at 37°C ± 0.5°C, 5% CO2 for 48 h.
After incubation time, a blocking buffer [3% bovine serum albumin in Dulbecco's phosphate-buffered saline (DPBS)] was added in the plate for 30 min. A monoclonal anti-HLA class I-Biotin antibody (cat. SAB4700638; Sigma) was added into the plate for 1 h, after washing the cells in DPBS (cat. 14040-091; Gibco). After incubation, 3 washes steps were performed, and the Streptavidin PE (cat. 12-4317; eBioscience) was added in the plate for 30 min. Finally, cells were washed for the subsequent analysis to the plate reader. Three independent analytical runs were performed for each experiment. Data analysis was made using GraphPad Prism software. IFNβ-1a concentrations (X values) are log10 transformed and the analytical response (Y value) expressed as fluorescence intensity.
The dose–response curve of native and deamidated IFNβ-1a is fitted by 4PL, and the IFN concentration, inducing the MHC-I expression in A549 cell line at 50% of the maximum possible (EC50), is automatically calculated by the software. The potency of each sample has been calculated as the ratio of reference EC50 to sample EC50.
Antiviral reporter gene assay
The antiviral reporter gene assay (AVA RGA) measures the upstream phase of the antiviral response by evaluating the activation of the luciferase reporter gene. ISRE-luc2P/HEK293 cell line, purchased by Promega (manufacturer code CS190701), has been used as target cell. These cells are transfected with a plasmid containing the firefly luciferase gene under the control of the interferon stimulated response element (ISRE) and Hygromycin resistance gene. Target cells were grown in Dulbecco's modified Eagle's medium (DMEM) high glucose medium supplemented with FBS (cat. SH3007103; Fisher Scientific) and Hygromycin B (cat. 10687010; Invitrogen) (the antibiotic used for the stable clone selection) as per the manufacturer's instruction.
To measure IFNβ-1a antiviral activity, ISRE-luc2P/HEK293 was detached with tryps in EDTA 0.25% (cat. 25200-056; Gibco) and resuspended in culture medium. In a white plate (assay plate), 2 × 10⁴ cells per well were added and incubated for 2 h (preplating incubation step) at 37°C ± 0.5°C, 5% CO2 ±0.5. Then, cells were treated with IFNβ-1a and deamidated analog dilution curve in a range from 50 to 0.003 ng/mL and incubated at 37°C ± 0.5°C, 5% CO2. After 24 h, the Bio-Glo Reagent was added to the plate, and the emitted luminescence with a Luminescence counter was measured. Data analysis was performed using GraphPad Prism software. Three independent analytical runs are performed for each experiment. IFN concentrations (X values) are log10 transformed and the analytical response (Y value) expressed as relative light unit.
The dose–response curve of reference material and samples was fitted by 4PL. The interferon concentration able to induce the Luciferase expression on ISRE-luc2P/HEK293 at 50% of the maximum possible (EC50) was automatically calculated using the GraphPad Prism software. The potency of each sample was calculated as the ratio of native IFNβ-1a EC50 to deamidated IFNβ-1a EC50.
STAT1 phosphorylation
A549 cells were grown as described previously. When cells reached 80% confluence, 3 × 10⁴ cells per well were seeded in a 96-well plate and incubated overnight at 37°C with 5% CO2. After incubation time, cells were treated with 0.02 ng/mL of IFNβ-1a and its deamidated analog for 15 min at 37°C with 5% CO2. Untreated cells were used as control. Then, A549 has been washed in PBS, and the Alpha SureFire Ultra Multiplex Assay Kit (cat. MPSU-PTERK-K-HV; PerkinElmer) has been used to lyse the cells and measure both the phosphorylated and total levels of endogenous STAT1 protein in cellular lysates.
The Alpha Multiplex measurement was carried out in the same assay plate well from a single sample of cell lysate and was achieved using 2 types of Alpha Acceptor beads that emit at distinct wavelengths (545 and 615 nm). The 2 distinct Alpha Acceptor beads report their binding to a distinct antigen through their association with specific assay antibodies.
The 615 nm (Europium) signal corresponds to the phosphorylated protein analysis, while the 545 nm (Terbium) signal corresponds to the total STAT1. An AlphaScreen protocol was used to read the plate using Envision plate reader. The results were shown as average of 3 independent experiments performed in duplicate and normalized on the untreated cells.
Real-time quantitative polymerase chain reaction
A549 cells were cultured in DMEM(1 × )+GlutaMAX (cat. 31966-021; Gibco) in presence of 10% FBS (cat. 10270; Fisher Scientific) and 1% penicillin and streptomycin antibiotics (cat. 15140-122; Gibco). When cells reached 80% confluence, they were harvested and 1 × 10⁴ cells/well were seeded in a 96 well plate and incubated for 1 h at 37°C with 5% CO2. After incubation, cells were exposed to 0.02 ng/mL of IFNβ-1a and its deamidated analog for 24 h at 37°C with 5% CO2. Cell lysis step and the real-time quantitative polymerase chain reaction (qPCR) were performed using the FastLane Cell Multiplex Kit (cat 216513; Qiagen). For real-time PCR, all genes were evaluated with TaqMan chemistry on a 7500 Fast real-time PCR instrument. Primers used for real time-polymerase chain reaction are reported below: MX1 (Hs00895608_m1 cat. 4453320; Thermo Fisher Scientific); CCR1 (Hs00174298_m1 cat. 4331182; Thermo Fisher Scientific).
The cyclic parameters are reported in Supplementary Table S1.
Data were obtained from 3 independent experiments performed in triplicate. The expression levels of the target genes relative to that of GAPDH (cat. 4326321E; Thermo Fisher Scientific) were determined using the comparative CT method (fold change in target genes relative to untreated samples = 2−ΔΔCT).
SPR analysis
In SPR analysis, the ligand of interest is immobilized on the chip surface through a commonly applied chemistry. Different concentrations of the analyte are flown over it to characterize its interactions with the immobilized ligand. Monitoring the change in the SPR signal over time produces a sensorgram, a plot of the binding response (resonance unit) versus time. Fitting the sensorgram data to an appropriate kinetic binding model allows calculation of kinetic parameters, such as the association (kon) and dissociation (koff) rate constants, and the binding affinity of the tested interactions. The binding affinity, defined as that of protein::protein interaction, is typically measured and reported by the equilibrium dissociation constant (KD), which is used to evaluate the strengths of biomolecular interactions.
The smaller the KD value, the greater the binding affinity of the ligand for its target. The larger the KD value, lesser the target molecule and ligand are attracted to each other.
The interaction between IFNβ-1a and IFNAR1/IFNAR2 was evaluated by SPR with the Biacore T200 instrument. IFNAR2 was captured by an anti-IFNAR2 monoclonal Ab (mAb) (MS-T clone 35.9; Merck), previously immobilized onto a CM-dextran surface (CM5 sensor chip, cat. BR-1005-30; Biacore) by amine coupling chemistry. The anti IFNAR2 mAb was injected over the chip with a flow rate of 5 μL/min and 5 min of injection time. Then, IFNAR2 (25 nM; flow rate: 20 μL/min; injection time: 2.5 min) was injected over the mAb in the measurement flow cell, while reference flow cell was used as blank control.
A range of 5 IFN concentrations (50, 25, 12.5, 6.25, 3.125 nM) was flown over the chip in a multicycle kinetic, injecting each concentration at 75 μL/min. At the end of each cycle the chip surface was regenerated by injection of glycine pH 2.5 solution at 20 μL/min for 30 s. Before each sample, a blank cycle was performed injecting the running buffer (HBS-EP, cat. BR-1001-88; GE) instead of the interferon concentration range that was then subtracted to the sample curve in the elaboration phase. Sensorgram data were processed and fitted using BIA evaluation software (Version 3.1). The sensorgram was produced plotting the time (s) (on X-axis) versus the binding response (resonance unit) (on Y-axis).
Quantitative analysis of IFNβ-1a samples binding to the IFNAR2 was performed applying the 1:1 binding model. The equilibrium dissociation constant (KD) was estimated, as well as the association and dissociation rate (kon and koff, respectively). SPR/Biacore results characterizing the IFNAR2 interaction with each ligand were expressed as absolute (KD) and relative binding (%KD). Each KD value was obtained from the average of 3 independent experimental runs, while the %KD was obtained from the ratio percentage of IFNβ-1a KD to deamidated sample KD.
AlphaScreen for IFNβ-1a/IFNAR proximity evaluation
The AlphaScreen method was used to measure the binding of IFNβ-1a to its receptor subunits IFNAR1 and IFNAR2 as described in Supplementary Table S2.
IFNβ-1a and its deamidated analog were prepared at 20 μg/mL, with serial dilution of 1:2 for 10 points in immunoassay buffer (cat. AL000C; PerkinElmer) and added to the alpha assay plate. IFNAR1-HisTag (cat. 13222-H08H; Sino Biological) and IFNAR2-FcTag (cat. 10359-H02H; Sino Biological) were prepared as mix at 6 μg/mL and added to IFN curves. Finally, bead mix (Protein A Alpha Donor beads, AS102D and Nickel Chelate AlphaLISA Acceptor Beads, AL108C; PerkinElmer) was prepared at 10 μg/mL and added to the alpha assay plate. The plate was incubated for 1 h at 25°C in the dark. After incubation, the plate was red using AlphaScreen protocol provided by Envision software. IFN concentrations (X values) are log10 transformed and the analytical response (Y values) expressed as counts per second.
The dose–response curve of IFNβ-1a and deamidated analog were fitted by 4PL, and the IFN concentration able to induce the binding to IFNAR at 50% of the maximum possible (EC50) was automatically calculated using the GraphPad Prism software. However, due to the rejection of the null hypothesis obtained by the software, it was not possible to calculate the potency. For this reason, the binding affinity was calculated as drug efficacy using the ratio of the Top value obtained from GraphPad Prism software.
Statistical analysis
Where indicated, significance was analyzed using 1-way analysis of variance (ANOVA). Significance was defined at *P < 0.05, **P < 0.01, ***P < 0.001. Paired sample statistical analysis was used to compare 2 method performance. If the standardized skewness and standardized kurtosis obtained are inside the range of −2 to +2, it means that no significant deviations from normality have been found.
Homology modeling
The three-dimensional (3D) structure of IFNAR1::IFNβ-1a::IFNAR2 ternary complex was built by a chimeric homology modeling approach, using the “Homology model” tool of the Molecular Operating Environment (MOE) 2020.09 (MOE, Chemical Computing Group, Montreal, QC, Canada).
The crystallographic structure of the IFNAR1::IFNω::IFNAR2 complex (PDB ID: 3SE4) (Thomas and others 2011) and the X-ray structure of IFNβ (PDB ID: 1AU1) (Karpusas and others 1997) were used as a template to model receptors and to orient IFNβ-1a in the correct binding mode, respectively. IFNβ and IFNβ-1a show a sequence identity of 100%. First, a sequence alignment between IFNω and IFNβ-1a was performed by “Protein alignment” tool of MOE, using a Blosum62 score matrix, resulting in ∼30% of sequence homology among the 2 molecules (Supplementary Fig. S5).
According to this result, the model was built after a structural alignment between the 2 IFNs. Specifically, the crystallized structure of IFNβ-1a was superposed to that of IFNω in complex with receptors. Then IFNβ-1a, IFNAR1, and IFNAR2 were remodeled on themselves, to correctly orient amino acid side chains. Both templates were prepared by the “Structure preparation” module to fill sequence gaps, correct any crystallographic issue, add missing hydrogens, and adjust residue protonation states. Missed residues in IFNAR1 (Trp49-Asn58) were rebuilt de novo by the “Loop modeler” tool. Thus, 10 intermediate models of the ternary complex were obtained, and the final structure was selected basing on the best-scoring intermediate one. The score was computed according to the Coulomb and generalized Born (Labute 2008) interaction energies (GB/VI) of the models.
A final refinement step, based on energy minimization, was carried out for the final model until the root mean square (RMS) gradient value is lower than 0.5 kcal/mol/Å2. Starting from this structure, G2S2F glycans were manually added to Asn80 by the “Carbohydrate builder,” and the final glycosylated model was optimized by a further energy minimization (RMS gradient 0.01 kcal/mol/Å2).
A model of the deamidated IFNβ-1a analog in complex with the receptor was built by introducing the single amino acid substitution N25D in the IFNβ-1a molecule using the “Protein design” tool and specifically by the residue scan methodology. A prediction of the thermostability and the receptor binding affinity of the mutant with respect to the wild type form is provided within this tool. The change in stability is computed as the difference of free energy of folding between the mutant and wild type in the folded and unfolded states of the protein. In the “Protein design” application, the stability scoring function has been trained on over 3,000 single point mutations taken from the FoldX (Guerois and others 2002) and PoPMuSiC-2.0 (Dehouck and others 2009) datasets.
In contrast, the binding affinity score is calculated according to the force field-based GBVI/WSA dG scoring function with the Generalized Born solvation model (Wojciechowski and Lesyng 2004) that estimates the free energy of binding of the ligand for the receptor from a given pose. It has been trained using the MMFF94x and AMBER99 force field on the 99 protein-ligand complexes of the Solvated Interaction Energy training set (Naïm and others 2007).
The mutated model was then further minimized until the RMS gradient was lower than 0.01 kcal/mol/Å2. All the calculations in the modeling procedure were performed with the AMBER10:EHT force field (Case and others 2008), and the Reaction field (R-field) was applied to treat electrostatics contribution (Barker and Watts 1973; Watts 1974).
MD simulations
Two 500 ns long MD simulations were carried out for both the wild type and deamidated IFNAR1::IFNβ-1a::IFNAR2 complexes by NAMD 2.13 package (Phillips and others 2020). In both systems, before the MD production phase, an energy minimization was run for 5,000 steps, followed by 100 ps of heating and 20 ns of equilibration. The simulations were performed in the NPT ensemble, by considering constant number of particles, constant pressure, and constant temperature (P = 101.3 kPa; T = 300 K). The Langevin thermostat was used to set constant temperature, and the Langevin piston was used for pressure control.
Proteins were capped at N- and C-termini with an acetyl (ACE) and an N-methyl amide group, respectively. Both systems were solvated by TIP3P water model and centered in a rectangular periodic water box of the following XYZ dimensions: 120.97 Å × 98.54 Å × 79.76 Å (wild type system) and 129.5 Å × 106.2 Å × 88.1 Å (deamidated system). NaCl 0.1 M was added for system charge neutralization. The sample time was set to 10 ps and the integration time step to 2 fs. The system preparation was performed by the MOE GUI (Graphical User Interface).
MD analysis
The analysis of trajectories was performed by MDTraj (McGibbon and others 2015), in-house Python scripts, and MOE 2020.09 (MOE, Chemical Computing Group, Montreal, QC, Canada). The hydrogen bond calculation was run according to the Baker–Hubbard criterion (Stanifer and others 2019) that identifies H-bonds based on cutoffs for the Donor-H-Acceptor distance (r) and angle (θ). The criterion used is θ > 120° and r < 2.5 Å in at least 30% of the trajectory for protein–protein interactions and 10% for protein-sugar bonds.
A hierarchical divisive cluster analysis was performed to isolate the most populated conformations sampled during the simulation according to the Ward's linkage method and by “scipy.cluster.hierarchy.linkage” tool (Müllner 2011; Parr and Schmidt 2018; Bar-Joseph and others 2001). Clusters were computed by “scipy.cluster.hierarchy.fcluster” with the “maxclust” criterion that is based on a specific cophenetic cutoff distance. The Electrostatic Feature Map of IFNβ-1a snapshots was computed by MOE 2020.09 “Surfaces and maps” tool as an application of the Poisson–Boltzmann Equation to the prediction of electrostatically preferred locations of hydrophobic, H-bond acceptor, and H-bond donor locations.
Results
Deamidation increases the biological activity of IFNβ-1a
Two new qualified methods mimicking the antiviral and immunomodulatory mechanism of action of IFNβ-1a were used to accurately evaluate the potency of the deamidated analog in comparison with the native IFNβ-1a, used as reference material. To assess antiviral activity, ISRE-luc2P/HEK293 cell line was treated with deamidated and native IFNβ-1a for 24 h. As reported in Fig. 1A and B, the relative potency of the deamidated sample was 207%, 2-fold higher compared to the native IFNβ-1a.
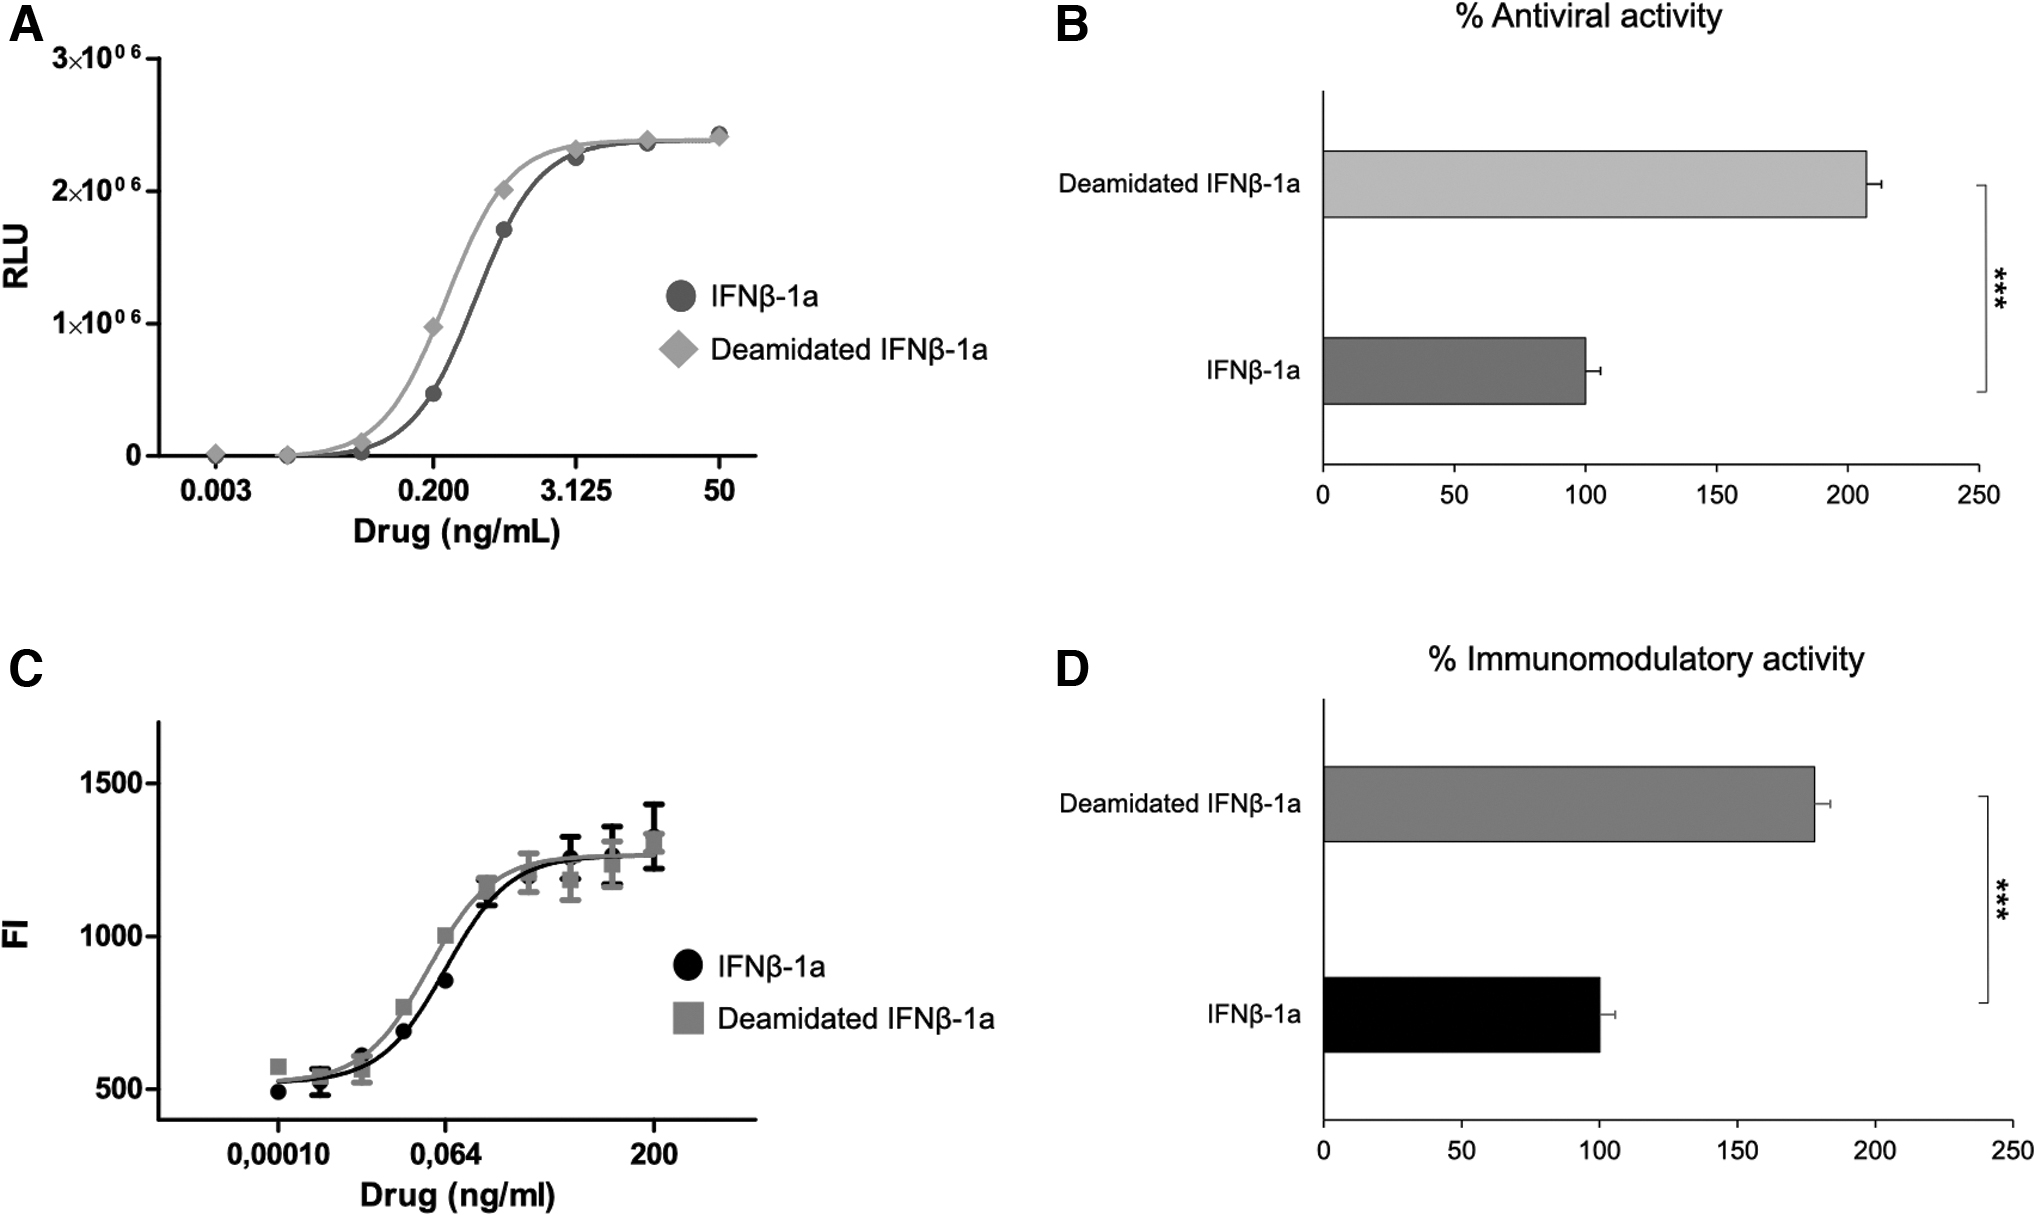
In vitro antiviral
Immunomodulatory activity has been evaluated by measuring MHC-I expression on target cell surface under interferon exposure. To this purpose, A549 cell line was treated with deamidated/native IFNβ-1a treatment for 48 h. In this case too, deamidated sample shows a 2-fold higher biological activity compared to native IFNβ-1a (Fig. 1C, D). Taken together, both methods, AVA RGA and the immunomodulatory assay, confirmed the higher biological activity of deamidated IFNβ-1a analog than the native molecule.
IFNβ-1a deamidation increases receptor binding affinity to IFNAR
To explain the increase of biological activity related to deamidated IFNβ-1a treatment, the binding affinity to IFNAR was investigated by SPR analysis. The commercial IFNβ-1a (used as reference material) and its deamidated analog were separately injected over IFNAR2 at the same concentration range (50, 25, 12.5, 6.25, 3.125 nM) to measure the equilibrium dissociation constants (KDs). The sensorgrams obtained from each interferon interaction with IFNAR2 are shown in Fig. 2. In Table 1 the binding affinity of deamidated IFNβ-1a to IFNAR2, expressed in terms of KD, surprisingly shows that the deamidated sample has a higher KD value than the native one, resulting in a lower affinity to IFNAR2 compared to its native form.
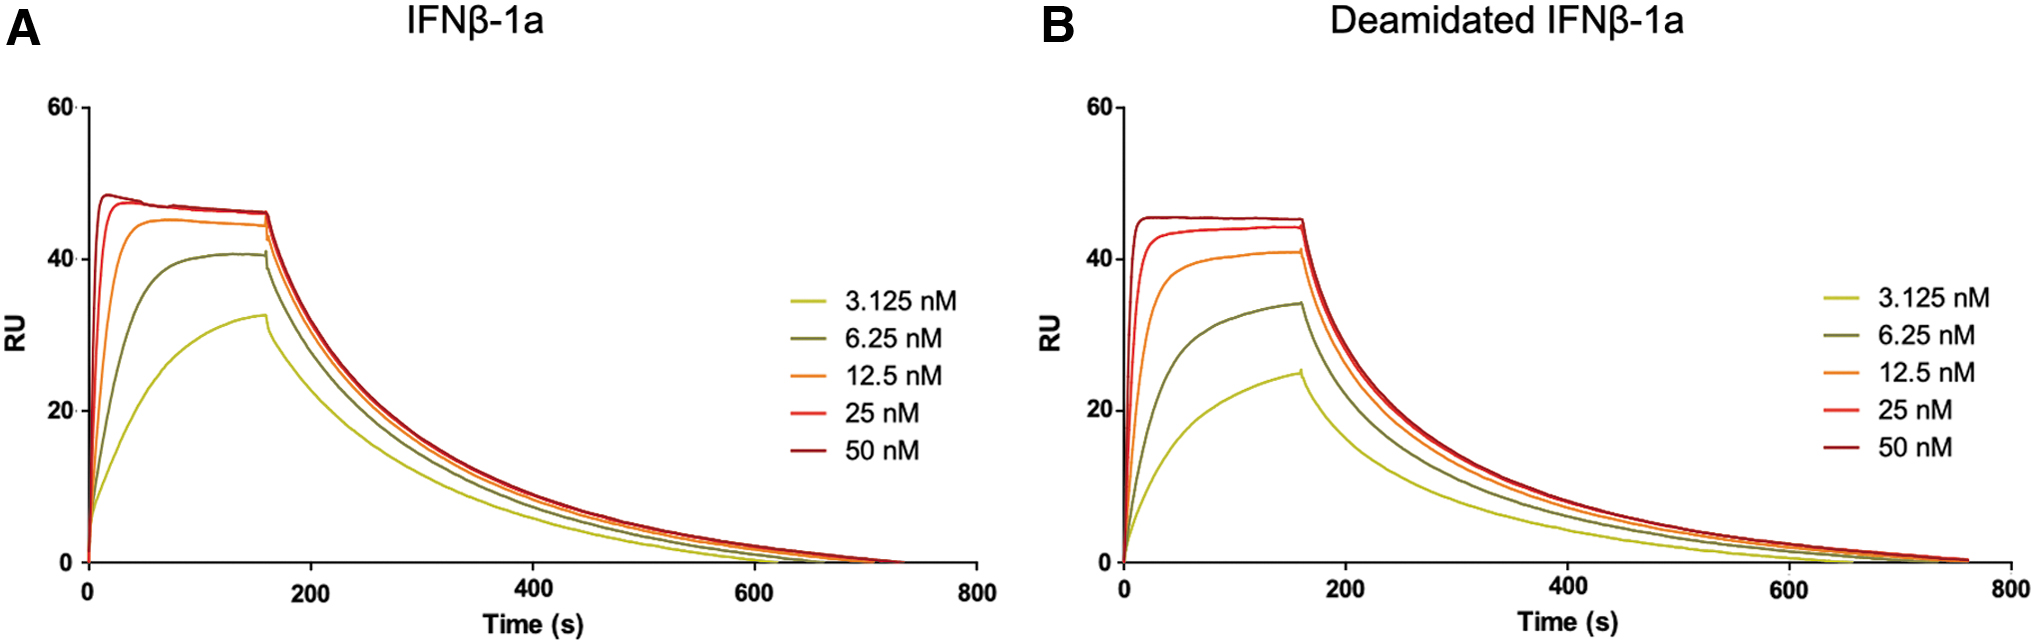
Interferon binding affinity to IFNAR2.
Binding Affinity to IFNAR2
Absolute KD of native and deamidated IFNβ-1a is reported as estimation of binding affinity to IFNAR2. Data were generated from 3 independent analytical runs.
P < 0.05 as determined by 1-way ANOVA.
ANOVA, analysis of variance.
To assess if this difference was statistically significant, a 1-way ANOVA analysis was performed between native and deamidated IFNβ-1a samples. A P value = 0.02 was found, confirming the statistically significant lower affinity of the deamidated interferon to IFNAR2. Focusing on IFNβ kinetic constants, while the kon of deamidated and native IFNβ-1a is very similar, a higher dissociation rate (koff) was observed for the deamidated sample, resulting in a reduced affinity to IFNAR2 (Table 2).
Kinetic Constants of IFNβ-1a and Deamidated Analog
Differences in kinetics profile are reported as ratio of deamidated kon and koff versus IFNβ-1a ones. Data were generated from 3 independent analytical runs.
To evaluate the affinity of the deamidated IFNβ-1a to IFNAR1, a different SPR layout was implemented (please see Supplementary Methods). Despite the obtained sensorgrams suggest a higher binding affinity of deamidated samples to IFNAR1 with respect to the native IFNβ-1a (Supplementary Fig. S1), the obtained results were not reproducible and for this reason they cannot be considered reliable for this study. So, the binding of the 2 IFNβ-1a species into the whole ternary receptor complex was evaluated using AlphaScreen. The dose–response curves obtained were significantly different with a P value <0.001 and a higher signal in the deamidated sample curve (Fig. 3A). Since P value <0.05, the 2 curves cannot be compared, and the potency cannot be calculated.

Evaluation of native and deamidated IFNβ-1a binding efficacy in the ternary complex.
For this reason, we decided to evaluate the efficacy of both IFNβ-1a forms in receptor binding. The efficacy is defined as the ability of a drug to produce a maximum pharmacological response, and the differences in the drug efficacy of the 2 IFNβ-1a analogs were evaluated by comparing the maximal response at high drug doses or concentrations (Neubig 2003, Holford 1981). Despite both interferons being tested at the same concentration range, at the highest tested concentrations deamidated sample binds the ternary receptor complex with a higher efficacy (136%) than the native form (Fig. 3B). So, the observed effect does not depend on the drug dose but on the intrinsic activity of the drug, that is intended as a different capacity to activate the drug–receptor interaction (Ariëns 1983).
Deamidated IFNβ-1a differently affects STAT1 phosphorylation and ISG expression
Once the increased binding affinity to the ternary complex was confirmed, the effect of deamidation on the signaling pathway was investigated by evaluating the STAT1 phosphorylation and ISG expression in A549 cell line. STAT1 phosphorylation was measured on untreated A549 cell line and after treatment with native and deamidated IFNβ-1a. As shown in Fig. 4A, the 2 interferons differently affect phospho-STAT1. While native IFNβ-1a only slightly increases STAT1 phosphorylation, the deamidated analog can induce an increase of up to ∼70% and ∼40% of phosphorylation with respect to the untreated cells and the native IFNβ-1a treated cells, respectively. Then, the expression of ISGs was assessed to evaluate whether the higher STAT1 activation, induced by deamidated IFNβ-1a, correlates with an increased target gene expression.
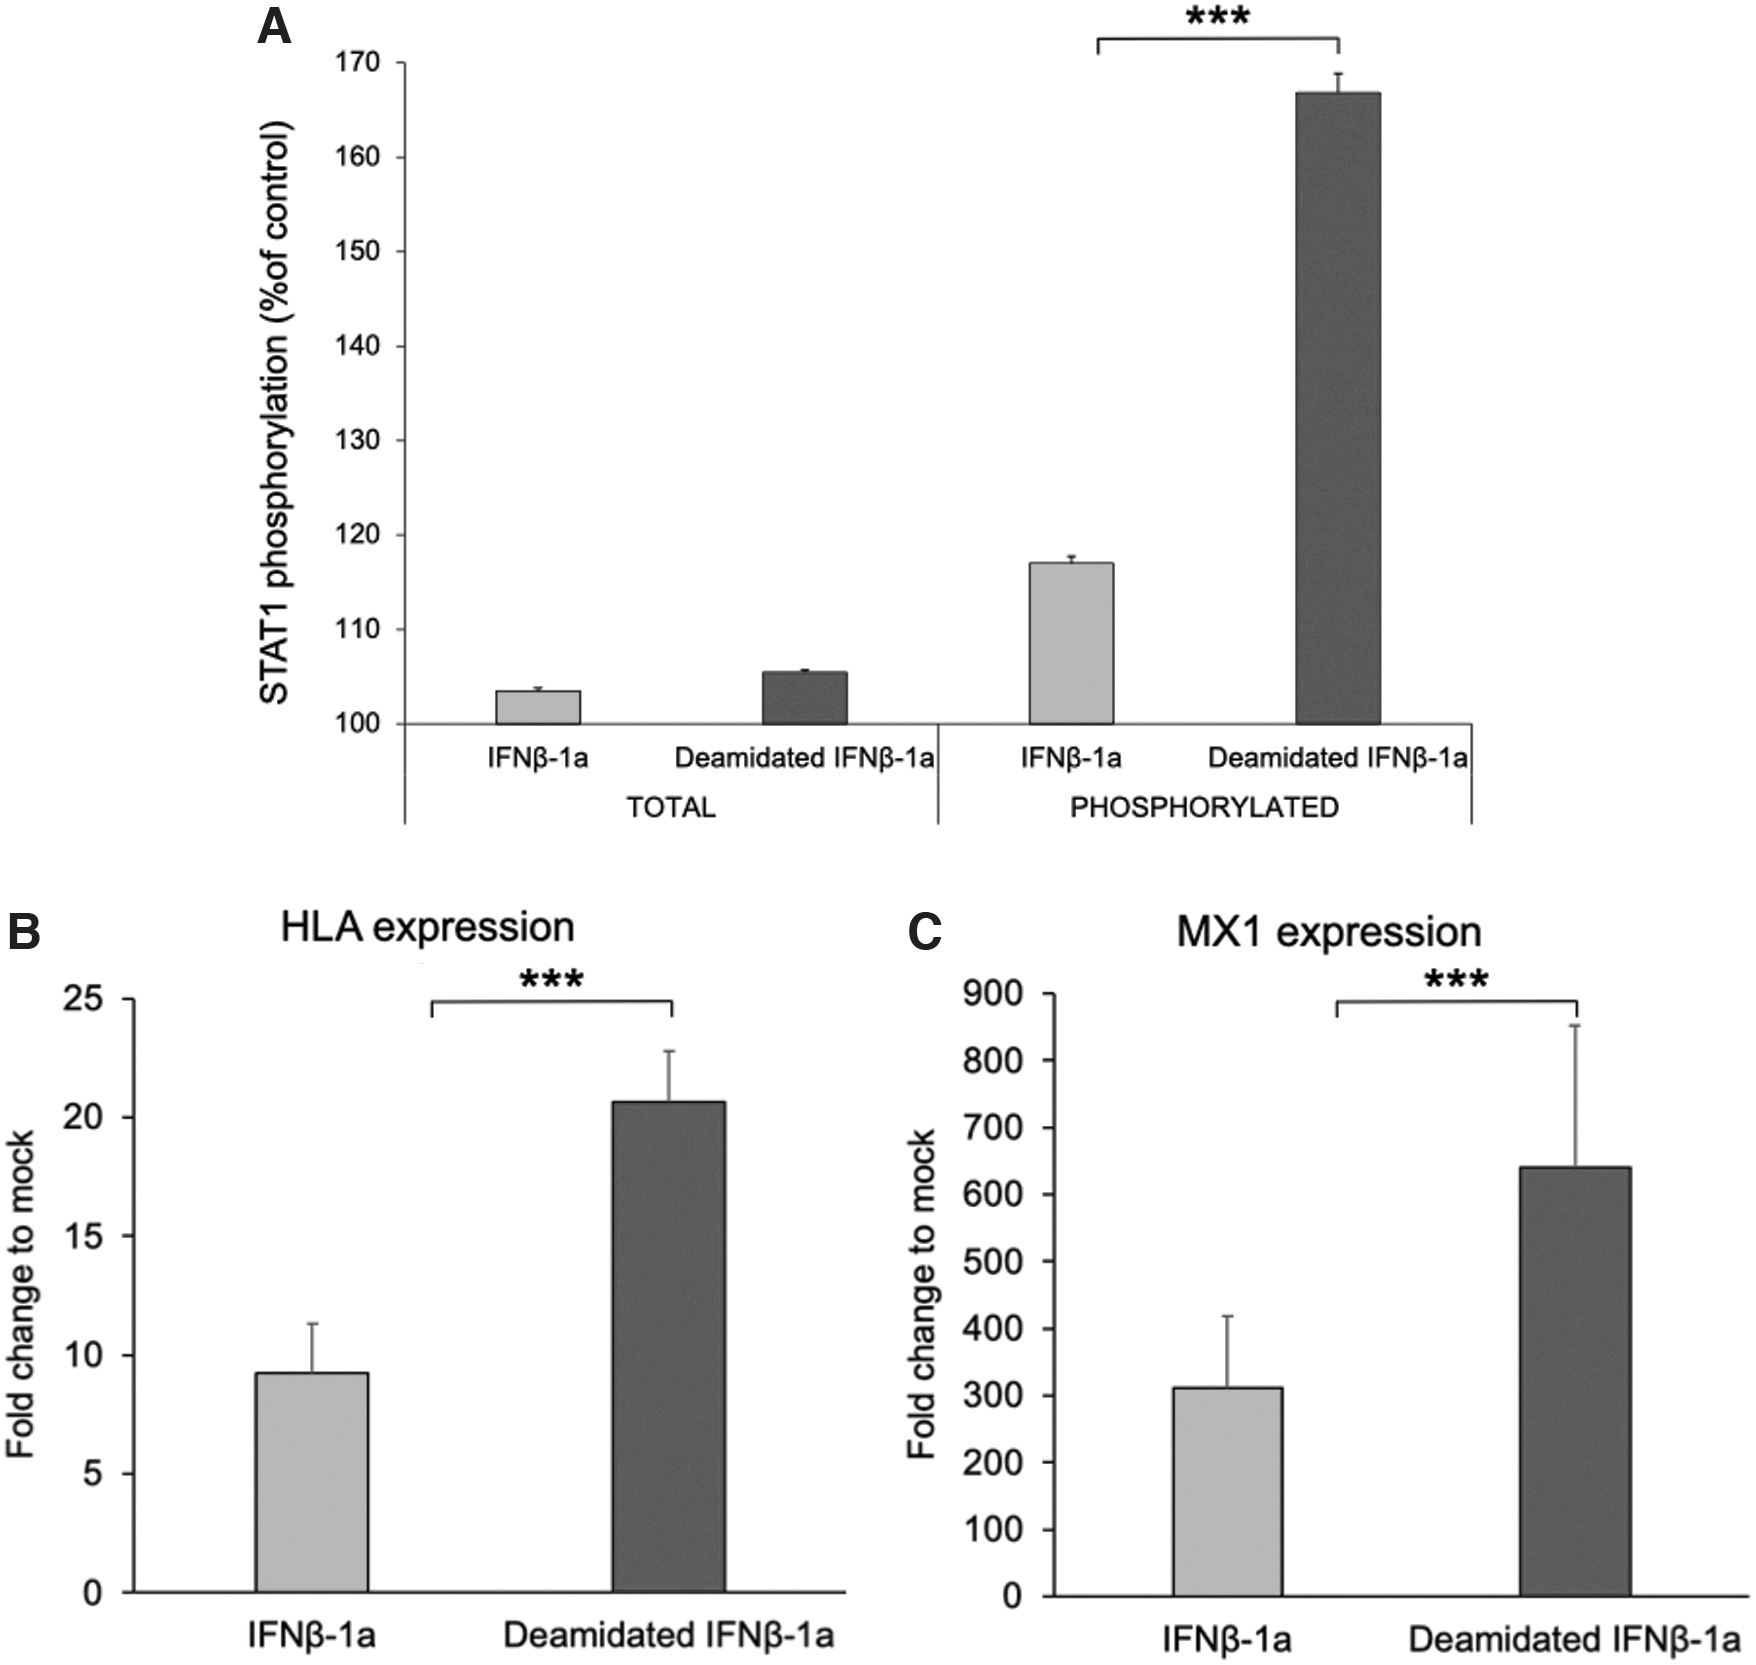
STAT1 phosphorylation and ISG expression after interferon treatment.
To this purpose, the expression of MX dynamin like GTPase 1 (MX1) and major histocompatibility complex, class I, C (HLA-C), 2 genes involved in antiviral and immunomodulatory activity, respectively, were evaluated after interferon exposure through real-time qPCR. As shown in Fig. 4B and C both MX1 and HLA-C genes resulted to be upregulated in A549 cells when exposed to both native and deamidated IFNβ-1a for 24 h. Interestingly, deamidated IFNβ-1a increases significatively the expression of both genes of ∼2-fold, with respect to the native form. These results show a greater effect of the deamidated IFNβ-1a analog on the JAK-STAT signaling pathway compared to the native IFNβ-1a.
Homology modeling and MD simulations
An in silico analysis was carried out to further characterize the interaction profile between human IFNβ-1a and its receptors (IFNAR1 and IFNAR2) and to deeply elucidate the different binding affinities to the receptors observed for the native and deamidated analogs. The structural analysis was performed building the 3D structure of IFNAR1::IFNβ-1a::IFNAR2 ternary complex using a homology modeling approach (Fig. 5A). The model was N-glycosylated by adding the G2S2F glycan chain at the Asn80 position in IFNβ-1a molecule (Fig. 5B). A single amino acid substitution, N25D, was inserted in the IFNβ-1a by the residue scan methodology to obtain the deamidated form (Fig. 5B).
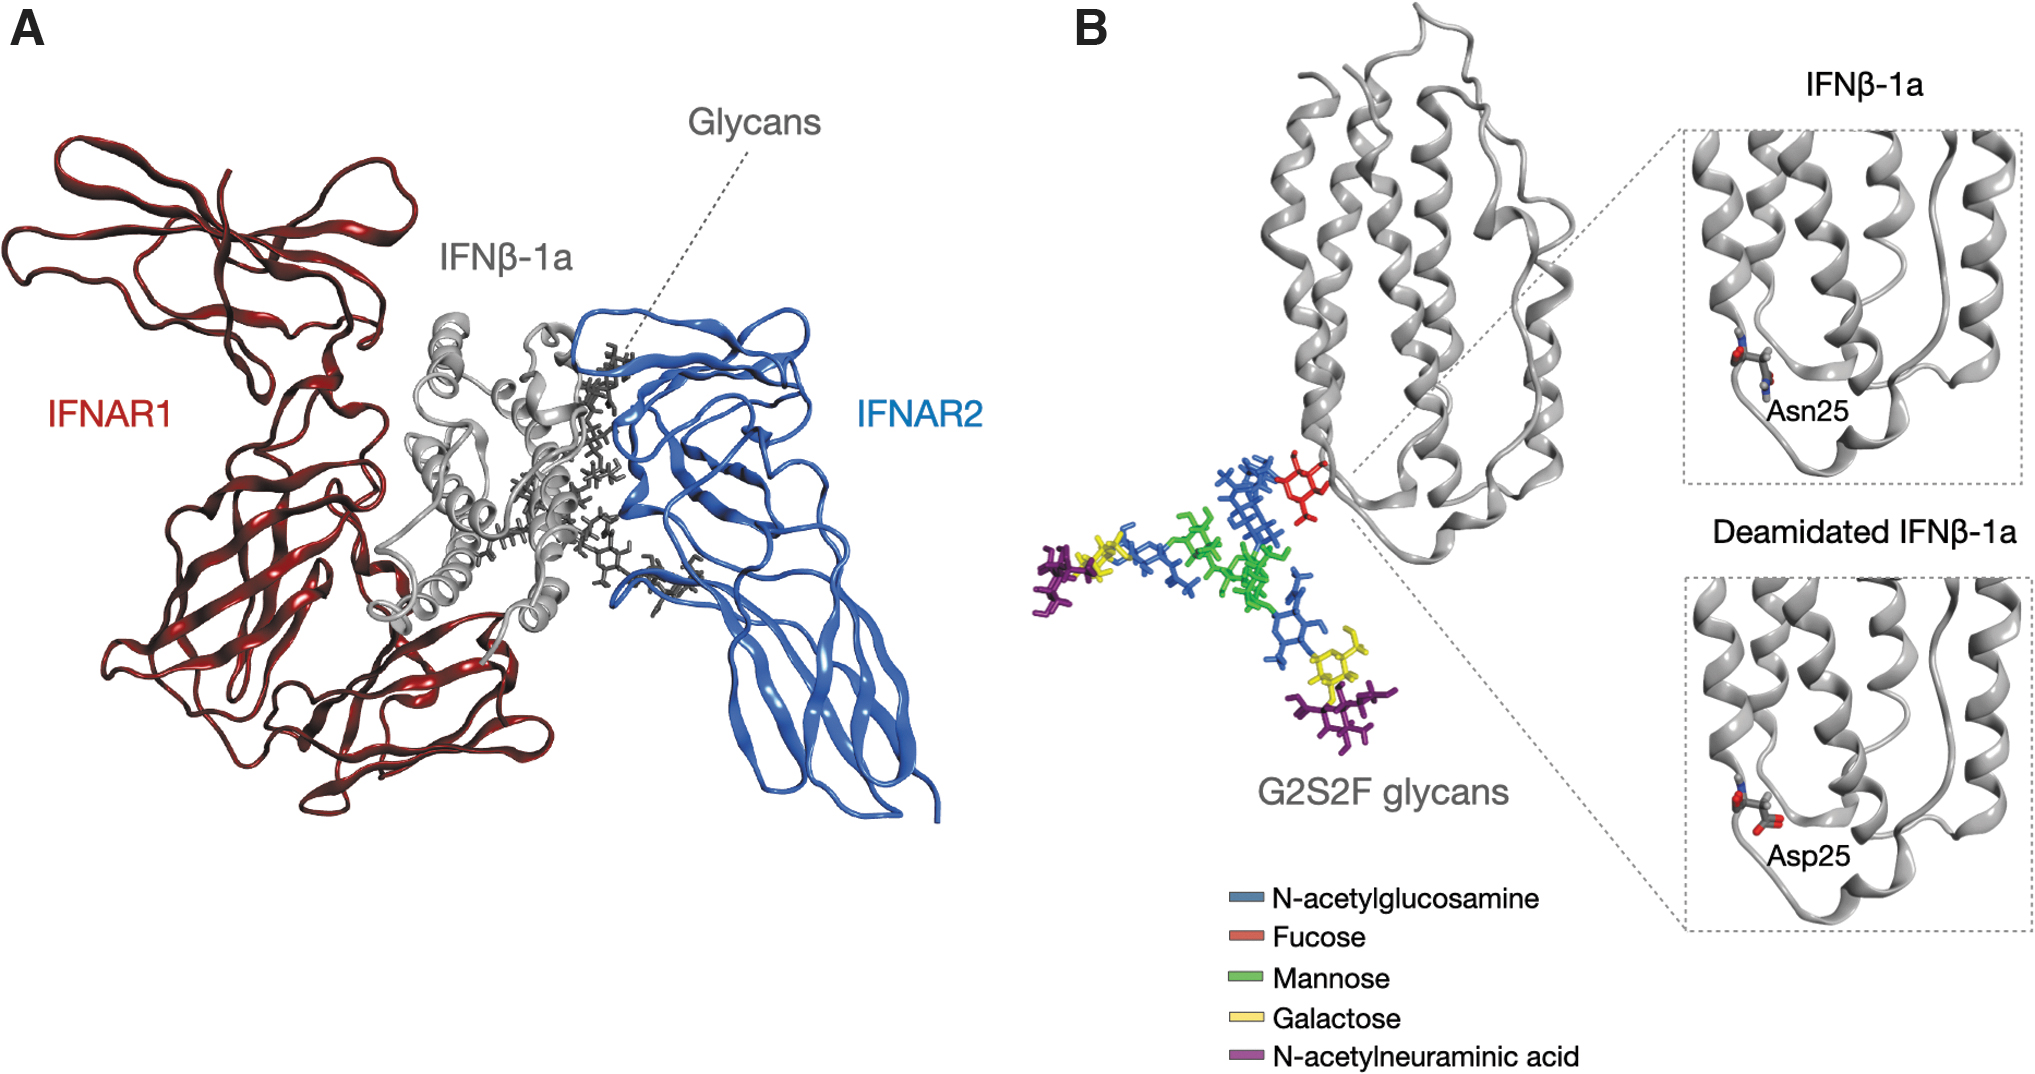
Three-dimensional structure of the IFNAR1::IFNβ-1a::IFNAR2 complex and structural differences among the native IFNβ-1a and the deamidated variant.
As a result, the energy values associated to the thermostability of the mutation and to the binding affinity of the mutant for the receptors were computed. Consequently, the relative stability and affinity of the mutant (dStability and dAffinity, respectively) with respect to the wild type form were produced showing that the stability of the model is not thermodynamically affected by the mutation and also that the binding affinity for receptors does not undergo significative changes in the mutated form (Table 3). These data suggest that the 2 starting models are comparable and equally suitable for further investigations.
Affinity and Stability Values Computed for Wild Type and Deamidated IFNβ-1a
A table summarizing values of Affinity, Stability, dAffinity, and dStability computed for the wild type and the mutated model. All parameters are expressed in kcal/mol.
MD simulations 500 ns long were carried out in replicate for each complex to thermodynamically validate the reliability of the models and to describe their conformational behavior during a specific time window. The stability of systems was evaluated by computing the RMS deviation of C-alpha atoms position of single proteins and whole complexes, suggesting that both systems in all the replicas reach a structural equilibrium after 100 ns of MD (Supplementary Fig. S2). According to these data, the following analyses were produced excluding from calculation the first 100 ns of the production phase.
The analysis of fluctuation profiles was performed by calculating the root mean square fluctuation (RMSF) of C-alpha atoms. This parameter is used to identify protein regions with the highest fluctuation and for this reason more susceptible to conformational changes. Focusing on IFNβ-1a molecules and comparing results obtained by replicas, as expected, a certain flexibility of the loops connecting helices was observed in both systems (Supplementary Fig. S3). Since they are not structured regions, protein loops are more susceptible to conformational changes during the dynamics with respect to other protein domains. Based on these data, simulated systems can be considered equilibrated enough to perform further analysis.
Analysis of IFNβ and IFNAR1/IFNAR2 interaction network
An analysis of H-bonds occurring between IFNβ-1a forms and IFNAR1/IFNAR2 receptors was performed to identify differences in the binding mode among the native and the deamidated protein. Since equally probable, all the interactions identified in the replicas were considered in this evaluation, and the cumulative list is reported in Supplementary Tables S3 and S4. The identified residues were compared to those reported as critical for receptor recognition by mutagenesis studies performed by Runkel and others (1998, 2000). Moreover, in Supplementary Tables S3 and S4 those interactions that are consistent with experimental data are highlighted.
Specifically, in the interaction with both IFNAR1 and IFNAR2, many of the identified IFNβ-1a residues correspond to those essential for the receptor binding and signaling cascade activation according to the reference literature, further supporting our results and the reliability of the starting model.
Furthermore, a comparison of the interaction network between IFNβ-1a forms and receptors was performed. Looking at IFNβ-1a::IFNAR2 binding interface, 7 out of 10 bonds are present in both systems, suggesting a conserved recognition mechanism.
Oppositely, the binding surface between IFNβ-1a and IFNAR1 presents some differences between the 2 analogs in terms of both number and type of bonds. In particular, comparing the systems, only 3 interactions are conserved in this case (Asn86::Gln299, Arg124::Glu98, Arg128::Glu98), suggesting a different recognition mechanism of the IFNAR1 by the 2 IFNβ-1a forms (Fig. 6).
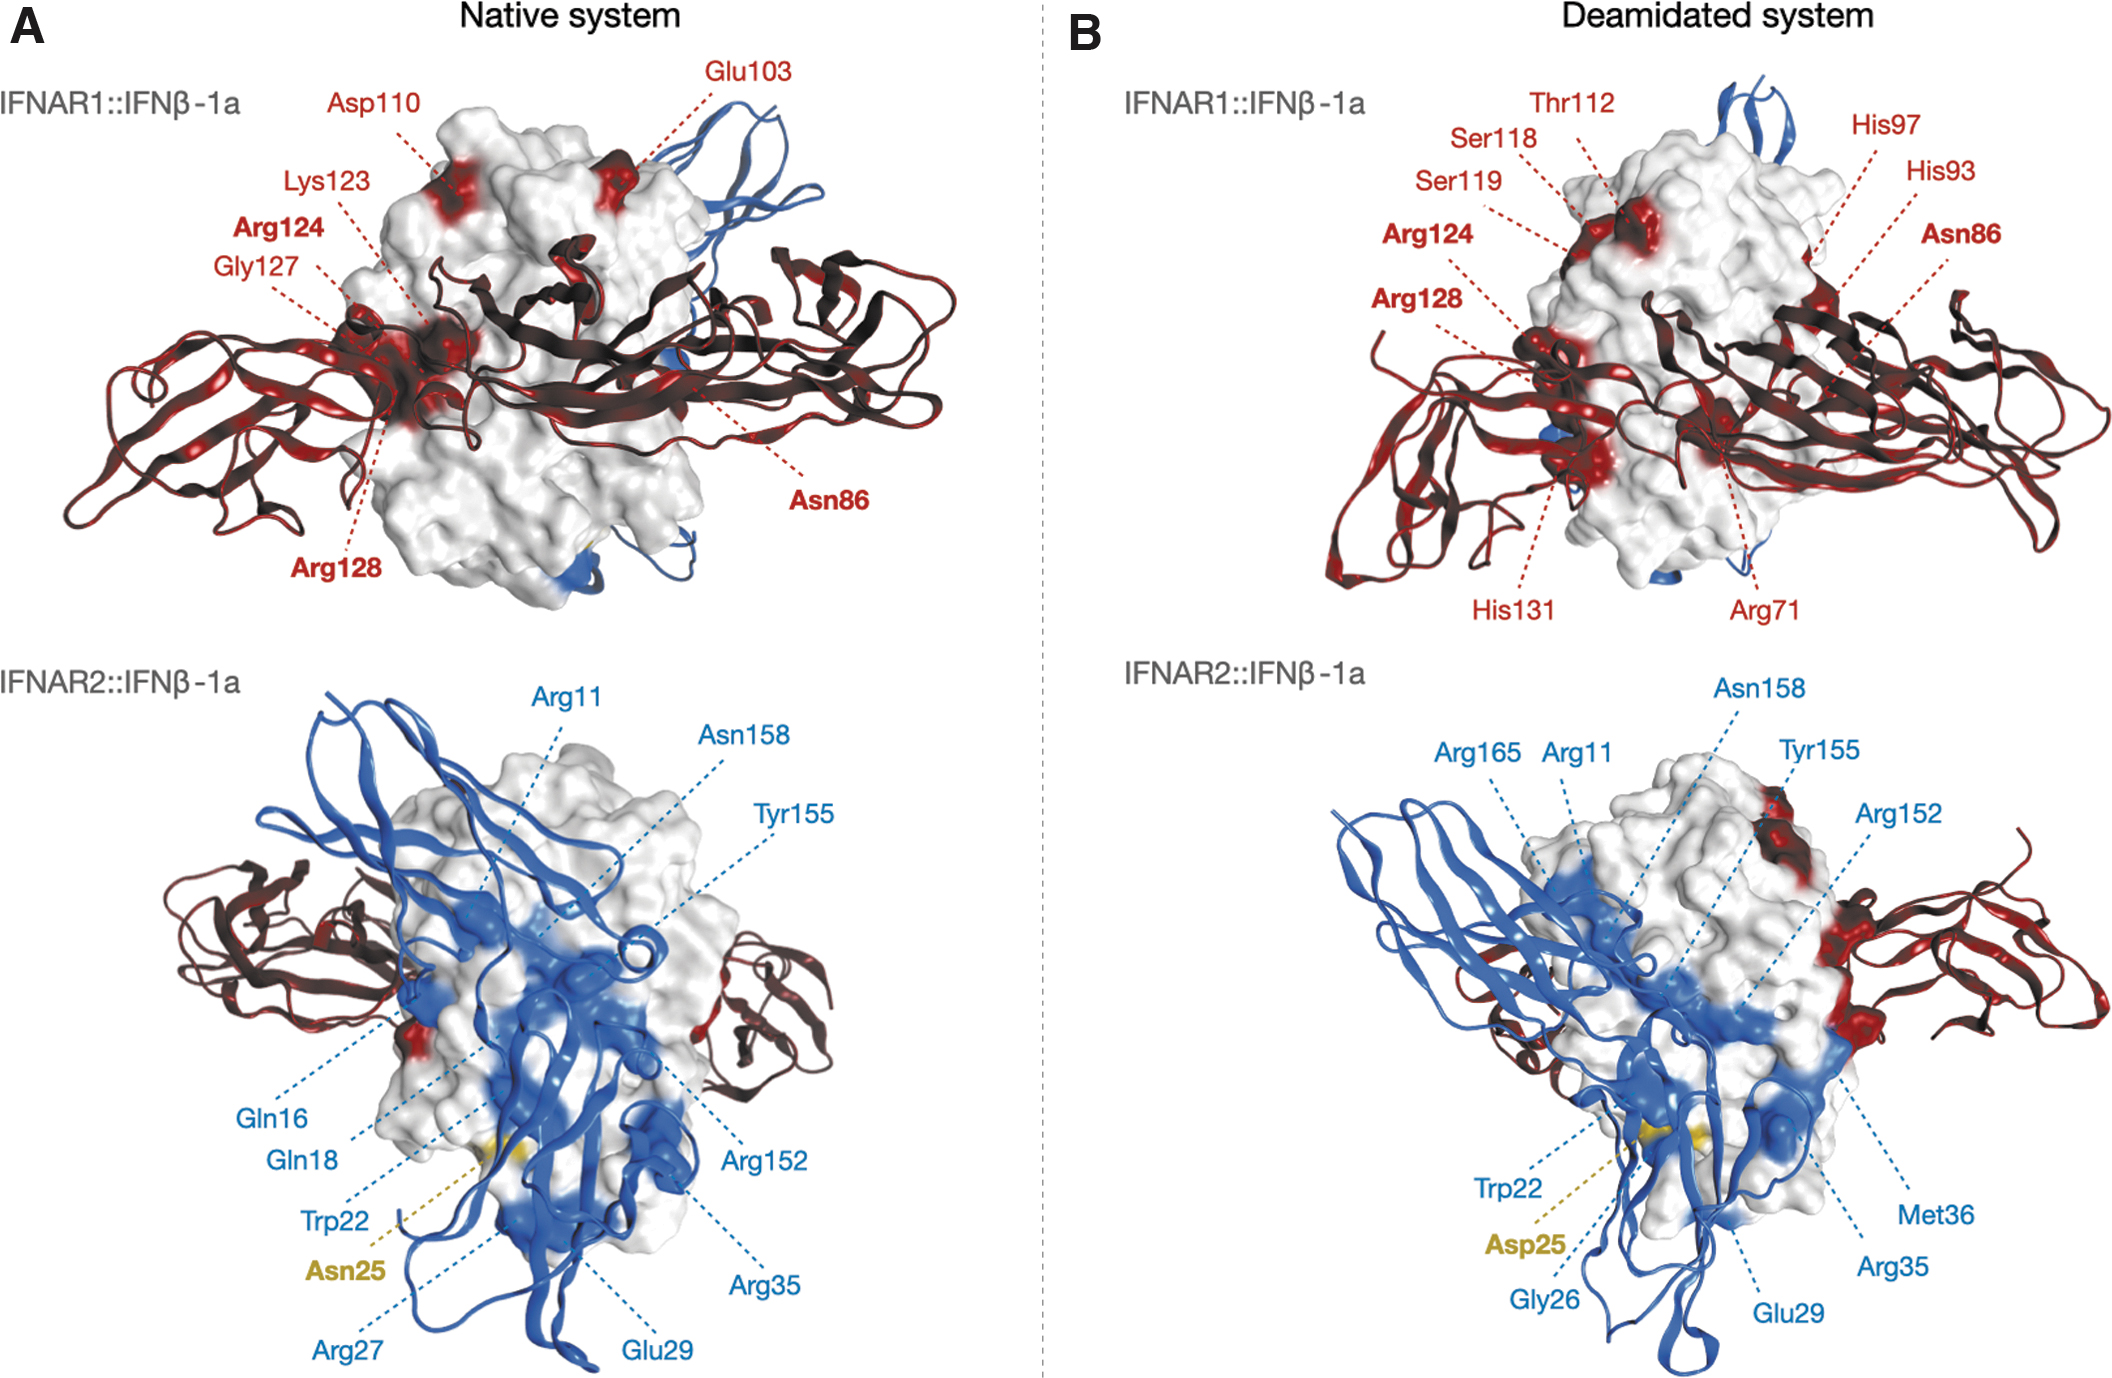
H-bonds interaction network between IFNβ-1a forms and receptors.
In the frame of these MD simulations, some of the key residues identified by Runkel and others (2000) as essential for the binding were found to be part of the interaction network of deamidated species and not of the native one, namely Arg71, His93, His97, and His131. Since a cutoff has been applied to identify the stable interactions among IFNAR1 and IFNβ-1a, we can state that the perseverance of the interaction among these residues is higher in the deamidated form than in the native one.
As secondary evidence, most of the residues identified in silico are considered noncritical by Runkel analysis, namely Ser119, Thr112, and Ser118, and according to this, we propose that the N25D mutation could induce a reorientation both of IFNβ-1a regions that are typically not involved in the interaction with IFNAR1 (ie, the CD loop) and of those considered crucial for it, involving more residues in the binding to the receptor and enhancing the signaling cascade.
Asn25/Asp25 interaction network
To explain the differences in interaction network of IFNβ-1a and receptors, an investigation on the structural behavior of Asn25/Asp25 residues and on their chemical environment was performed. In particular, the H-bonds network of these amino acids was computed showing that they are characterized by similar interactions. Specifically, Asn25 interacts with Gly26, Trp79, and Arg147, while Asp25 interacts with the same residues plus Arg27 and His140.
However, the difference in the binding occupancy of Asp25, that makes 2 bonds more, suggests a change in the structural equilibrium of the mutated region with respect to the wild type. To better quantify this change, the solvent accessible surface area (SASA) analysis was performed. Accordingly, Asn25 results in being more exposed to the solvent than Asp25 (Fig. 7A). Since Asp25 proximal residues are mainly positively charged, just like Arg27 and His140, it results are more prone to interact with these groups that favor its orientation toward the internal surface of the protein than to the solvent. A lower fluctuation profile was also observed for Asp25 than Asn25, suggesting in another way its stabilization due to these interactions (Fig. 7B).
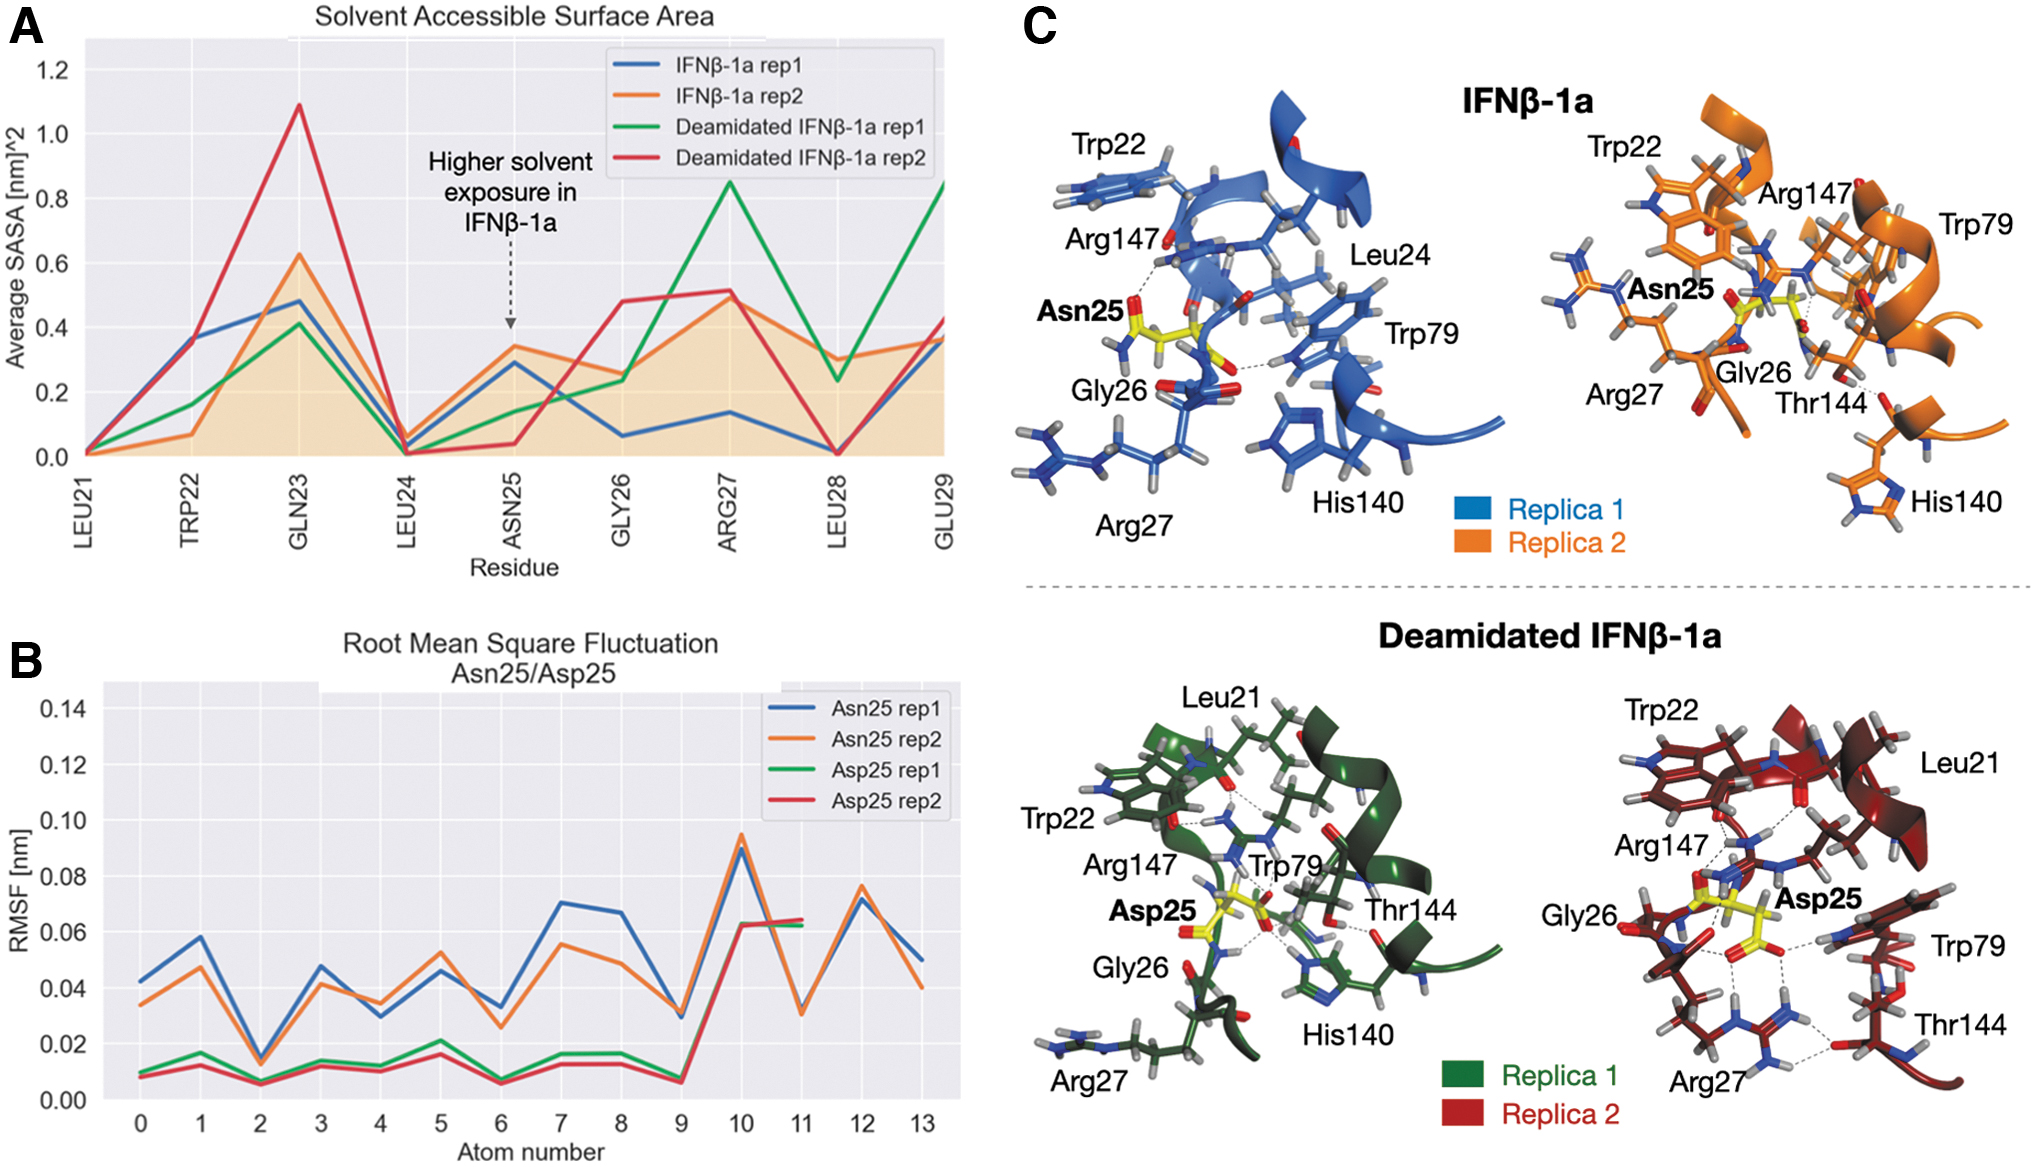
SASA, RMSF, and chemical environment of Asn25/Asp25 residues.
The analysis of conformations isolated by clustering showed that the orientation of Asn/Asp residues, and of those amino acids located in their proximity, is completely different among the 2 systems. Basically, Asn25 can be completely or partially exposed to the solvent, while Asp25 is always buried within the protein and involved in strong interactions with the surrounding amino acids. This chemical environment, in fact, is composed of a pool of positively charged residues, such as Arg27, His140, and Arg147, that trap the aspartate in a specific network (Fig. 7C).
Considering that despite the mutation being in a loop region we did not observe unfolding events, the changes in the interactions and conformation suggest that the N25D substitution should not be detrimental for the protein folding and stability, but probably advantageous, potentially inducing a stabilizing effect in the structure. The stabilization of the structure could be likely due to the propensity of Asp to make H-bonds with surrounding residues, making that loop less flexible.
Electrostatic feature maps were computed for representative structures sampled during the dynamics (1 every 100 ns) to characterize the electrostatic environment in the Asn/Asp25 region. As reported in Fig. 8, in the native IFNβ-1a there is a clear pool of H-donor groups exposed on the protein surface and conserved along with dynamics, while in deamidated analog the electrostatic potential surface is prevalently composed of H-acceptor groups. This result, together with previous data, suggests a change in the orientation of positively charged amino acids upon the mutation. So, beside the same aminoacidic composition of that region, the mutation can favor the reorientation of such groups that tend to interact with Asp rather than with the solvent.

Electrostatic feature maps of MD snapshots. The electrostatic potential surface and the molecular surface (in gray) of native (top) and deamidated (bottom) IFNβ-1a in Asn/Asp25 region. H-donor groups are colored in red, H-acceptor in blue, and hydrophobic in white. In deamidated IFNβ-1a a change in the orientation of positively charged groups and the loss of Asn amide group result in a more negatively charged electrostatic surface than in the native molecule. MD, molecular dynamics. Color images available online.
In Supplementary Fig. S4 the comparison among the surfaces computed for the other 2 replicas is reported, showing a variability in the dynamics of Arg27, that gives the main contribution to the positively charged surface, but also confirming the orientation of Asp25 within the hydrophobic core of the protein.
Globally, these data suggest that the local effect of the mutation can propagate throughout the molecule inducing a change in the propensity to interact with IFNAR1 and being responsible of the major efficacy observed for the deamidated variant.
Analysis of glycan behavior
A conformational analysis of sugars was performed as a preliminary investigation of their dynamical behavior in native and deamidated complexes. Ten structures, 1 every 50 ns, were isolated from each replica for a total of 20 conformations per system. A structural superposition of these conformations was then performed with respect to IFNβ-1a molecules, showing 2 different exploration trends between the sugars of native and deamidated interferons. As highlighted in Fig. 9, while in the native system glycans can reach very similar conformations in which they seem to interact with IFNAR2, looking at the deamidated variant, sugars assume mainly 2 orientations: in the first replica, they are completely lying on the IFNAR2 surface, potentially forming interactions with the receptor, while in the second simulation sugars are oppositely oriented to IFNAR2.
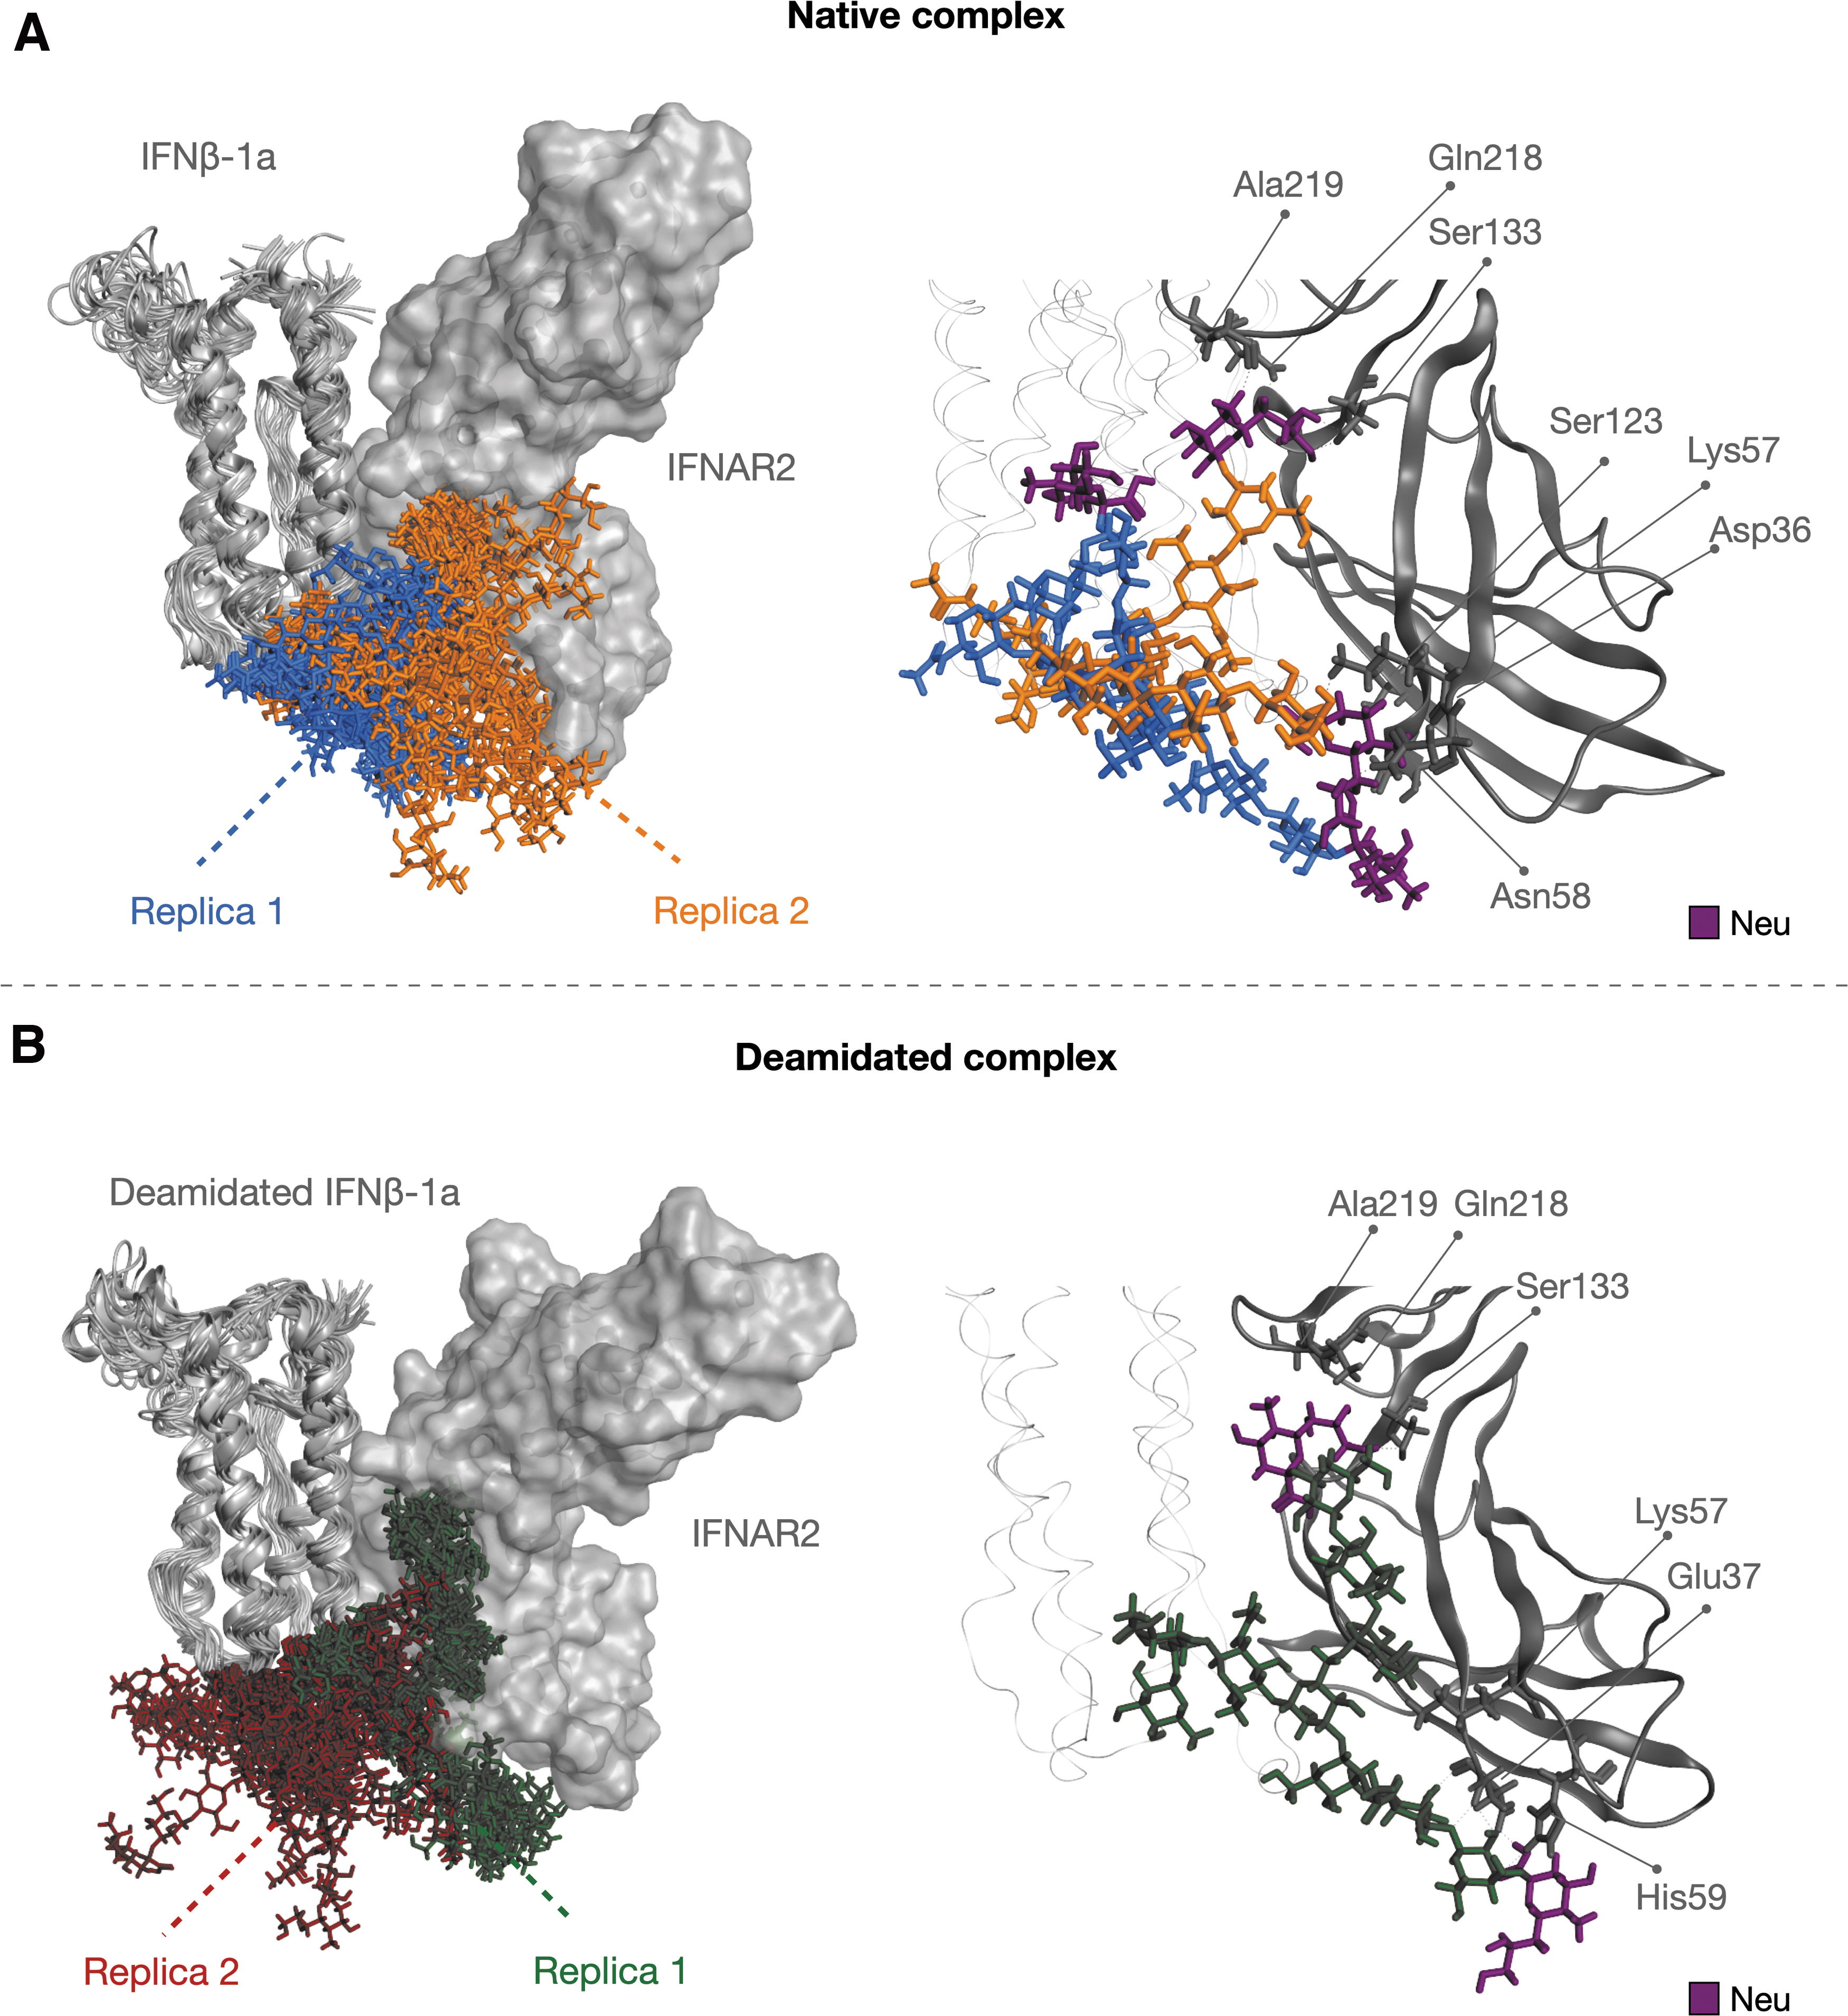
Analysis of sugar behavior and sialic acid interaction network with IFNAR2.
Consequently, the number of H-bonds is well conserved in both replicas of native system, while it is not in the deamidated form, confirming the existence of different glycan conformations in the deamidated complex (Supplementary Table S5). As secondary evidence, an involvement of sialic acids in the receptor binding was observed. In both complexes, in fact, Neu units are involved in interactions with similar IFNAR2 residues, suggesting that there may be a common pattern of recognition for these carbohydrates (Fig. 9).
Since the N25D mutation is localized nearly to the glycosylated Asn80, the observed changes in the behavior of Asp25 could also influence the orientation of glycan chain. To further confirm this hypothesis, an investigation of H-bonds interactions between glycans and both IFNs was performed, as summarized in Supplementary Table S6 and Fig. 10. According to this analysis, in native system, there are 4 interactions involving Trp22, Asn25, Tyr30, and His140. Looking at the structure, while Trp22 interacts with a terminal sugar, namely Neu12, the others, together with Arg27, are involved in a specific network that seems to stabilize Man5-Glc7 couple.
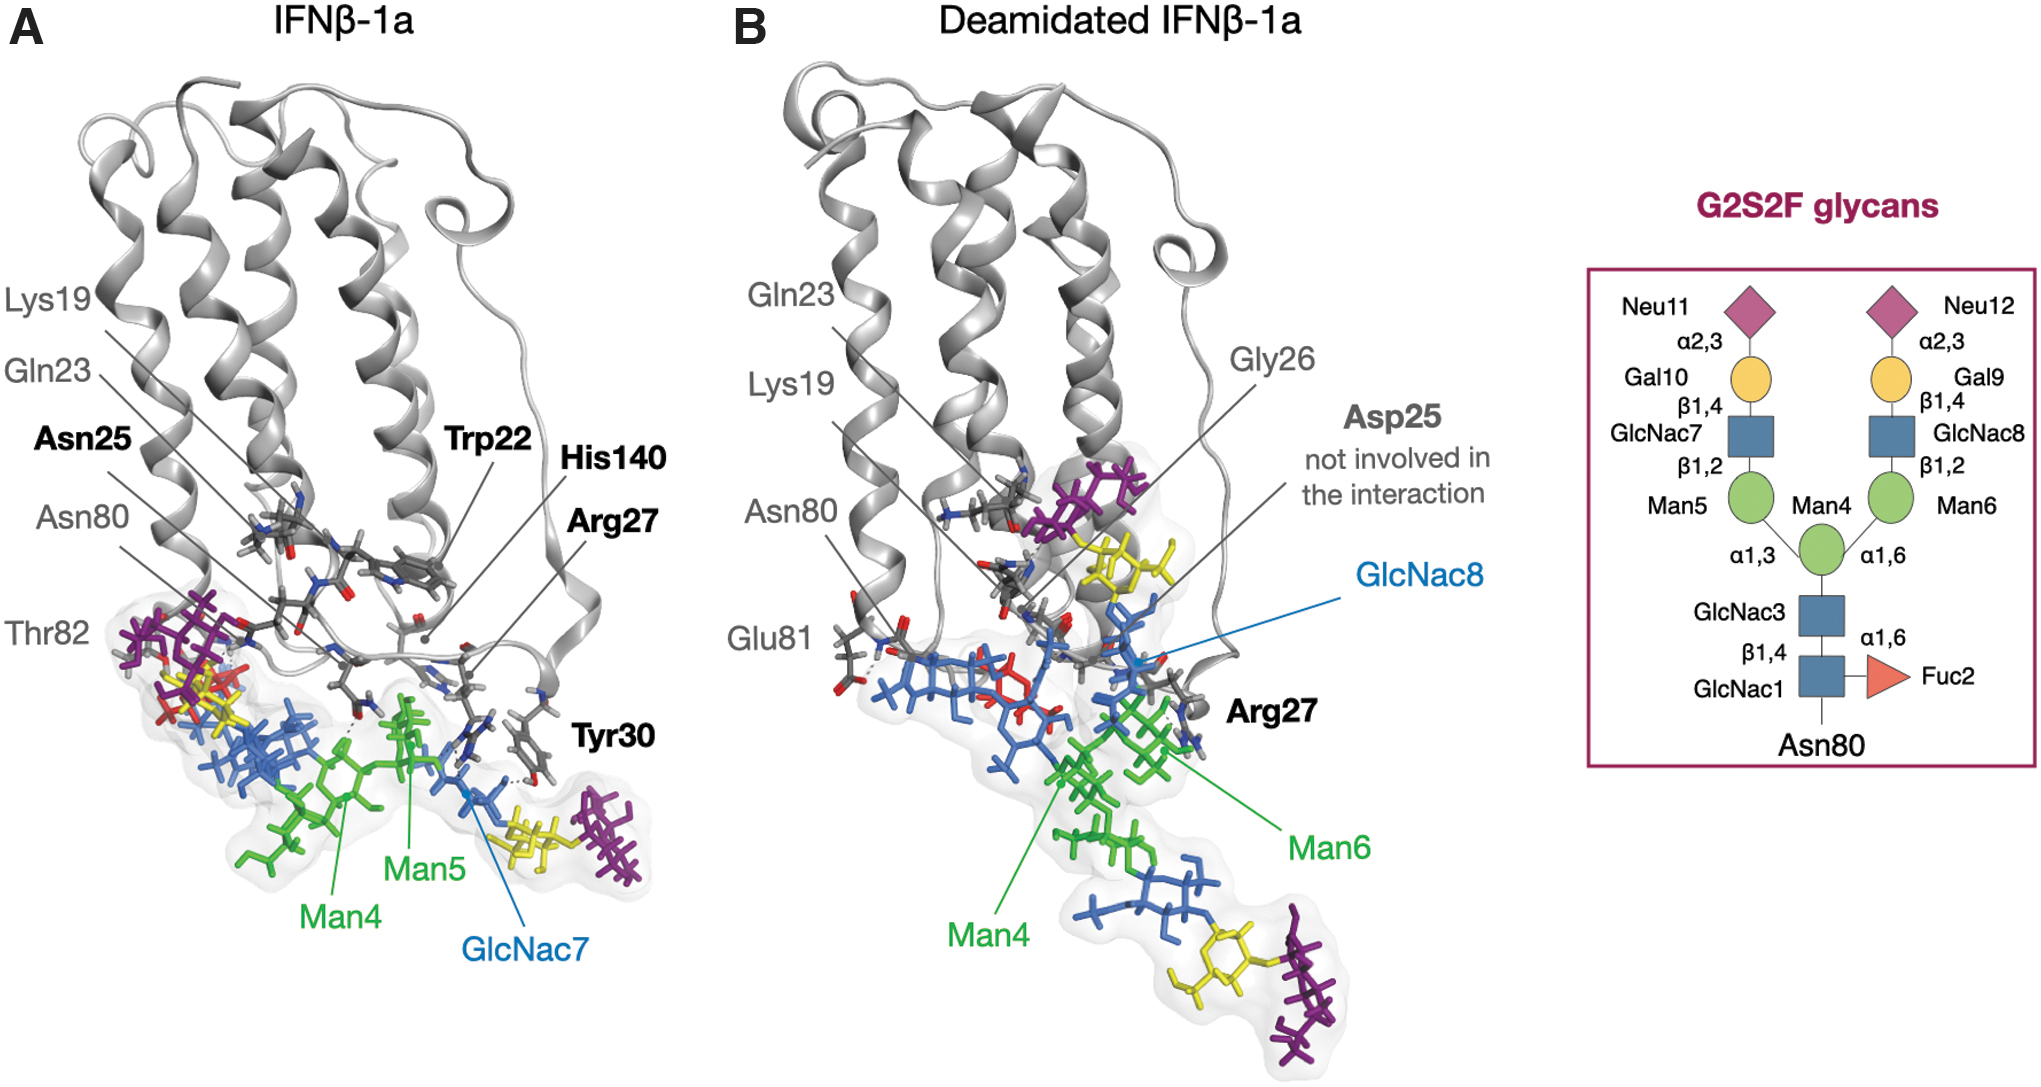
Interaction network between IFNβ-1a and G2S2F glycans.
Oppositely, in the deamidated system, this network does not exist, since Asn25 is mutated in Asp, and as shown above, it is involved in different interactions, including also His140 and Arg27. However, even if Arg27 still binds sugars in deamidated variant, particularly Man5, Man6, and Glc8, we suppose that this interaction is not sufficient to induce the sugar conformation able to stabilize the binding to IFNAR2.
Thus, we propose that the loss of some interactions between IFNβ-1a and glycans in the deamidated system can influence the behavior of sugars and reduce their interaction with IFNAR2, inducing the affinity loss experimentally observed.
Discussion
Deamidation is a common post-translational modification of
First, the biological activity of IFNβ-1a in its native and deamidated forms was assessed by applying specific dedicated methods with high precision and accuracy to ensure reliable results. Our data showed a 2-fold higher antiviral and immunomodulatory activity of deamidated analog compared to the native IFNβ-1a, thus confirming the results reported in the previous study (Mastrangeli and others 2016) and in the description of patent WO2015150468A2 (Palinsky and others 2015) according to a state of the art method (AVA RGA).
Then, the attention was focused on receptor binding. SPR analysis revealed a faster dissociation rate of deamidated IFNβ-1a from IFNAR2, leading to a statistically significant decrease in binding affinity of ∼20% for this receptor. These results were not expected because of the well-known 2-step mechanism that regulates the ternary complex formation in which the formation of the binary complex between IFNβ-1a and the high affinity receptor chain IFNAR2 is the first necessary step. Thus, in principle, a higher affinity for this receptor could have explained the higher biological response of deamidated IFNβ-1a.
So, a change in affinity of deamidated IFNβ-1a for IFNAR1 was supposed to be the main cause of this phenomenon, and the related binding was assessed. Since the very low reliability and reproducibility obtained from IFNAR1 binding experiments, we evaluated the capacity of each IFNβ-1a species to form the IFNAR1::IFNβ-1a::IFNAR2 ternary complex by AlphaScreen. As expected, deamidation leads to a higher binding efficacy (136%) of IFNβ-1a to the ternary complex compared to the native form.
Overall, according to these results, we hypothesized that the increase of the binding of the deamidated analog to IFNARs is mainly due to a greater affinity toward IFNAR1 induced by deamidation process. The intracellular signaling was also investigated by evaluating STAT1 phosphorylation that represents the first step in the signaling cascade, upon the treatment with native and deamidated IFNβ-1a. As a result, an increase of phospho-STAT1 was observed in the deamidated system. This effect is transposed in the consequent increase of target gene expression. Indeed, HLA-C and MX1 genes were found to be 2-fold upregulated after 24 h of deamidated interferon treatment with respect to the native form, further confirming the higher response induced by this IFNβ-1a analog.
Moreover, both gene expression and biological activity show the same trend (2-fold increase) when exposed to the deamidated analog, suggesting a strong correlation between the 2 effects.
Our hypothesis is in line with that proposed by Mastrangeli and others (2016) that to explain the increased biological activity of deamidated IFNβ-1a suggested that Asn25 deamidation can induce an increase of electrostatic interactions mediated by Asp25 that can influence also the receptor binding (Mastrangeli and others 2016).
Experimental results were further supported by an in silico analysis, in which comparative modeling and MD simulations were applied. After rebuilding by homology the 3D structure of glycosylated IFNAR1::IFNβ-1a::IFNAR2 ternary complex in both native and deamidated (N25D mutation) forms, MD simulations in replicates were run to assess the behavior of complexes.
H-bond network was analyzed to map the interactions between IFNβ-1a and IFNARs. According to the results, while the interactions with IFNAR2 are almost conserved in the 2 forms, suggesting that this conserved network is responsible for the comparable association constant, considering the interaction with IFNAR1, a difference between native and deamidated IFNβ-1a was observed. In particular, a different number and type of residues involved in the molecular recognition mechanism was highlighted, suggesting that a conformational change due to the mutation, even if only indirectly observed by our simulations, can induce the involvement of such residues in the IFNAR1 binding that in the native form do not participate in the interaction.
Moreover, the most of identified residues (both for IFNAR1 and IFNAR2 binding) were demonstrated to be critical for the interaction by mutagenesis studies (Runkel and others 2000), validating our models and strongly supporting our findings. This analysis suggests that the N25D mutation can facilitate the exposure toward IFNAR1 of more key residues that interact with it, enhancing the biological response. Also other residues, typically considered not involved in the interaction, were found to bind the receptor, suggesting that an involvement of regions not commonly considered critical may occur. Since the only difference between the 2 simulated systems is represented by the N25D mutation, we investigated the behavior of Asn25/Asp25 residues along the trajectories.
The analysis pointed out a different ability of Asp25 residue to interact with positively charged amino acids located in its proximity with respect to Asn25, as already hypothesized by Mastrangeli et al, 2016. This evidence was further confirmed by SASA and RMSF analysis that highlighted a different solvent exposure and a different fluctuation trend of Asn25 and Asp25, respectively. In particular, Asn25 residue was found to be more prone to interact with the solvent and to fluctuate than Asp25. This behavior was better explained by a different interaction network in which the 2 residues are involved and was supported by their well-known different propensity to make electrostatic interactions.
In fact, as shown by the analysis of electrostatic potential surfaces, the presence of Asp is favored by the surrounding environment, characterized by positively charged residues that create a network in which Asp is completely involved. In contrast, Asn resulted to be more flexible and freer to explore different orientations. So, according to both experimental and computational data, as a first conclusion of this work we propose that the deamidation effect is propagated throughout the molecule, modulating the IFNβ-1a activity. The mutation can induce a reorientation of IFNβ-1a regions and can promote the involvement of novel residues in the IFNAR1 recognition, enforcing the interaction and the activation of its signaling cascade.
As a secondary aspect, since the structural proximity of Asn/Asp to the glycosylated Asn80, we investigated the effect of the mutation on the conformational variability of G2S2F sugars. From this investigation, even if preliminary, a different ability to explore the conformational space of the native and the deamidated IFNβ-1a glycans was observed. This analysis pointed out that while in the native form glycans maintain similar orientations in both replicas, interacting with IFNAR2, in the deamidated variant they seem to be more prone to change their conformation, reducing the stability of the interactions with the receptor.
Since the importance of glycans for the molecule activity (Runkel and others 1998) and since no differences were found in the H-bonds network between IFNβ-1a forms and IFNAR2, we hypothesized that the instability of the glycan chain observed in the deamidated system can be an important factor of the 20% affinity loss for IFNAR2. The analysis of interactions between IFNβ-1a and sugar chain pointed out that while in the case of native molecule, glycans (especially Man5-GlcNac7 couple) are stabilized by specific interactions with interferon, including Asn25 and the surrounding amino acids, in deamidated system these interactions are missing due to the Asn/Asp mutation. Upon the mutation, in fact, a structural rearrangement of residues around Asp occurs inducing the loss of some interactions with glycans.
These data lead us to hypothesize that the N25D substitution can have an effect also on the dynamic behavior of carbohydrates and not only on that of the protein and, together with the experimental results, support the second conclusion of the work: the loss of specific interactions among glycans and IFNAR2, mainly due to the mutation, may be the main cause of the observed 20% of affinity loss between deamidated IFNβ-1a and the receptor.
Another preliminary evidence came out from the in silico analysis: in both systems an involvement of sialic acids in the IFNAR2 binding can be detected. This finding is strongly supported by published data (Dissing-Olesen and others 2008) that demonstrate a role of terminal sialic acids in modulating the activity of IFNβ in vivo. Despite that, it should be more extensively investigated; this observation further supports our hypothesis and suggests that the reduction in affinity of IFNβ-1a for IFNAR2 could be due also to the loss of sialic acid interactions. Nevertheless, we acknowledge that an in-depth investigation of sugar dynamics should be performed with additional simulation settings (ie, specific force field for glycan treatment, simulation of desialylated species) and further experimental studies.
In conclusion, we propose the molecular bases of the increased biological activity of the deamidated analog of IFNβ-1a, suggesting that there may be a significant effect of this PTM on the behavior of the whole molecule, including glycans, paving the way to novel therapeutic strategies.
Footnotes
Authors' Contributions
E.L. performed the investigation and the writing of the experimental part; S.S. performed the investigation and the writing of the in silico section; I.E. supervised and reviewed the in silico section; L.M., E.M., G.A., and F.D. helped with formal analysis of the experimental part; M.R. and C.P. were responsible for funding acquisition; W.P. reviewed the article; C.W.D. and F.C. conceptualized the work and reviewed the final article.
Author Disclosure Statement
No competing financial interests exist.
Funding Information
This study was supported by “Department of Excellence” grant program from Italian Ministry of University and Research (MIUR) 2018-2022.
Supplementary Material
Supplementary Methods
Supplementary Figure S1
Supplementary Figure S2
Supplementary Figure S3
Supplementary Figure S4
Supplementary Figure S5
Supplementary Table S1
Supplementary Table S2
Supplementary Table S3
Supplementary Table S4
Supplementary Table S5
Supplementary Table S6