




Abstract
Dietary fiber fermentation decreases luminal pH by the production of short-chain fatty acids (SCFAs). Additional proposed physiological benefits of fiber fermentation include decreased growth of pathogenic bacteria, increased mineral absorption, and serving as an energy source for the colon epithelium. This study examined three common fiber supplements—wheat dextrin (WD) (Benefiber®, Novartis Consumer Health Inc., Parsippany, NJ, USA), psyllium (PS) (Metamucil®, Procter & Gamble, Cincinnati, OH, USA), and inulin (Fiber Sure®, Procter & Gamble)—for pH, SCFAs, and gas production. An established in vitro fermentation model was used to simulate colonic fermentation at 0, 4, 8, 12, and 24 hours. At 24 hours, WD and inulin significantly decreased pH compared to PS. Inulin produced significantly more hydrogen and total gas. All treatments produced similar total SCFA concentrations at 24 hours; however, the rate of production was different. PS had a declining rate of SCFA production from 12 to 24 hours, whereas WD and inulin had a higher rate during that period. Fast-fermenting substrates may not provide as much SCFAs to the distal colon as slow-fermenting substrates. Differences in fermentation rate, gas production, and SCFA production observed for WD, PS, and inulin may affect their gastrointestinal tolerance and require further study.
Introduction
D
Fiber fermentation in the intestine produces gases and SCFAs. The main gases produced are carbon dioxide, hydrogen, and methane. Gas produced by the fermentation of fibers may cause undesirable cramps, bloating, and flatus. 9 Hydrogen gas may be excreted in breath and flatus or converted to methane, hydrogen sulfate, or acetate. 10 The conversion product of hydrogen can be influenced by microflora, concentrations of hydrogen gas, and dietary sulfate. 11 SCFAs include mainly acetate, propionate, and butyrate and provide an energy source for the body. Acetate is the most prevalent SCFA and after absorption is metabolized for energy by muscles. 12 Propionate is a gluconeogenic substrate reported to inhibit cholesterol synthesis in some animal models. Butyrate is the preferred energy source for the colonic mucosa cells, supplying as much as 60–70% of energy needs, 13 and limited data exist that it is a tumor suppressor in colon cancer. 14
In vitro fermentation systems are models of human colon fermentation. Validation studies show similar degradations of non-starch polysaccharides in vitro and in vivo. 15 We examined fermentation patterns, pH, hydrogen gas concentration, total gas volume, and SCFAs profiles of wheat dextrin (WD), psyllium (PS), and inulin in an in vitro batch fermentation system.
Materials and Methods
Materials
The fiber treatments were WD (Benefiber®, Novartis Consumer Health Inc., Parsippany, NJ, USA), inulin (Fiber Sure®, Procter & Gamble, Cincinnati, OH, USA), and PS (Metamucil®, Procter & Gamble). No added fiber was used as a negative control to test for SCFA present in the fecal inoculum.
Chemical reagents used were obtained from Cambrex Bio Science Walkersville, Inc. (Walkersville, MD, USA), Fisher Scientific (Rochester, NY, USA), Sigma-Aldrich (St. Louis, MO, USA), and Ricca Chemical Co. (Arlington, TX, USA).
Fermentation
WD, PS, inulin, and control with no added fiber were fermented for 0, 4, 8, 12, and 24 hours as previously described. 16 All treatments were assayed in triplicate. A 500-mg portion of each fiber was added to 100-mL serum bottles. Fibers were hydrated 12 hours prior to the start of the fermentation with 40 mL of sterile trypticase peptone fermentation medium at 4°C. Two hours prior to inoculation the bottles were heated to 37°C in a shaking water bath.
Feces from three individuals consuming a nonspecific Western diet were collected under anaerobic conditions, pooled, and homogenized. After homogenization, phosphate buffer solution was combined with the feces in the ratio of 6:1. Following further mixing, 2 parts reducing solution (950 mL of distilled water, 6.25 g of cysteine hydrochloride, 40 mL of 1 N NaOH, and 6.25 g of sodium sulfide nonhydrate) was combined with 15 parts fecal slurry. Ten milliliters of fecal inoculum was added to each bottle. To ensure anaerobic conditions, bottles were flushed with carbon dioxide followed by addition of 0.8 mL of an oxygen scavenger (Oxyrase®, Oxyrase Inc., Mansfield, OH, USA) and immediately sealed with a rubber stopper. Bottles were gently shaken in a water bath at 37°C until removal. Once the bottles were removed from the water bath, gas volume was determined by puncturing the rubber stopper with a syringe and allowing the syringe to fill with gas. The overpressure in the flask forced gas to fill the syringe, which allowed for quantification of gas. The gas was then transferred from the syringe to a sample holding bag (QuinTron Instrument Co., Milwaukee, WI, USA), where it was stored until hydrogen analysis could be conducted. The pH of each bottle was measured using a PerpHecT® LogR™ meter (model 350, Orion Research, Inc., Beverly, MA, USA). To stop the fermentation, 1 mL of copper sulfate (200 g/L) was added to each bottle. Lastly, 2-mL aliquots were taken from each bottle and promptly frozen at −20°C until SCFA extraction could be completed.
Gas analysis
The concentration of hydrogen was determined by injecting 20 mL of extracted gas into a MicroLyzer (model DP, QuinTron Instrument Co.). The accuracy of the detector for a single sample is ±3–4 ppm hydrogen. In instances when the gas volume was less than 20 mL, atmospheric air was added to the syringe until a 20-mL volume was attained. Additionally, a dilution factor was used to detect hydrogen beyond the upper limit of detectability. Atmospheric air was determined to have negligible hydrogen gas concentration.
SCFA analysis
Extraction of SCFAs was completed according to the procedure of Schneider et al. 17 Aliquots were removed from the freezer and allowed to thaw at 4°C. When they were completely thawed, 0.4 mL of sulfuric acid (50%), 2 μL of 2-butyric acid, and 2 mL of diethyl ether were added. Tubes were briefly vortex-mixed and placed in an orbital shaker for 45 minutes. Next the tubes were centrifuged at 2,000 g for 5 minutes. The supernatant was removed, and calcium chloride was added to remove any residual water. Finally, the solution was filtered using a 1-mL syringe (Sherwood Medical, St. Louis) and a FisherBrand 13-mm nylon filter with pore sizes of 0.2 mm (Fisher Scientific, St. Louis).
SCFA concentrations were determined by gas chromatography using a flame ionization detector. All samples were analyzed using an HP 5890 series gas chromatograph (Hewlett Packard, Palo Alto, CA, USA) and Stabilwax®-DA fused silica column (30 m long; inner diameter, 0.52 mm; film thickness, 1 μm; Restek, Bellefonte, PA, USA). Inlet and detector temperatures were 200°C. The sample injection volume was 0.5 μL. The sample was injected at 90°C and held for 2 minutes. Then the temperature increased at a rate of 60°C/minute to 120°C and held for 10 minutes. The flow rates for helium, hydrogen, and air were 33 mL/minute, 32 mL/minute, and 401 mL/minute, respectively.
Statistical analysis
All statistical analyses were performed using SAS statistical software version 9.1 (SAS Institute, Cary, NC, USA). The general linear model procedure was used to determine differences of means. Statistical significance was achieved at P < .05.
Results
Effect on pH
At 4 hours, all the treatments showed statistically significant differences from the control. PS had the lowest pH (P < .05) at 4 hours (Table 1). All treatments were significantly different from each other at 8 hours, with inulin having a lower pH (P < .0001) than WD and WD having a lower pH (P < .01) than PS. The same trend was observed at 12 hours, but the differences were higher (P < .0001). Between hours 4 and 8, there was a steep drop in pH for inulin (from 6.8 to 5.4), whereas the pH of PS and WD decreased steadily throughout the entire fermentation period (Table 1). At 24 hours there was no longer a difference in pH between inulin and WD, but PS was significantly higher than both (P < .0006).
Data are mean ± SD values calculated from three replicates.
Within each row, values with different letters are statistically different (P < .05).
Comparison of gas volume
There was no measurable gas production during the first 4 hours (Fig. 1). At hour 8, gas production of inulin was significantly higher (P < .0001) than the other fibers. Inulin still had the highest (P < .0004) gas volume at hour 12, but gas production of PS and WD increased to higher than the control. Gas volumes at 24 hours were as follows: inulin > WD > PS (P < .005).
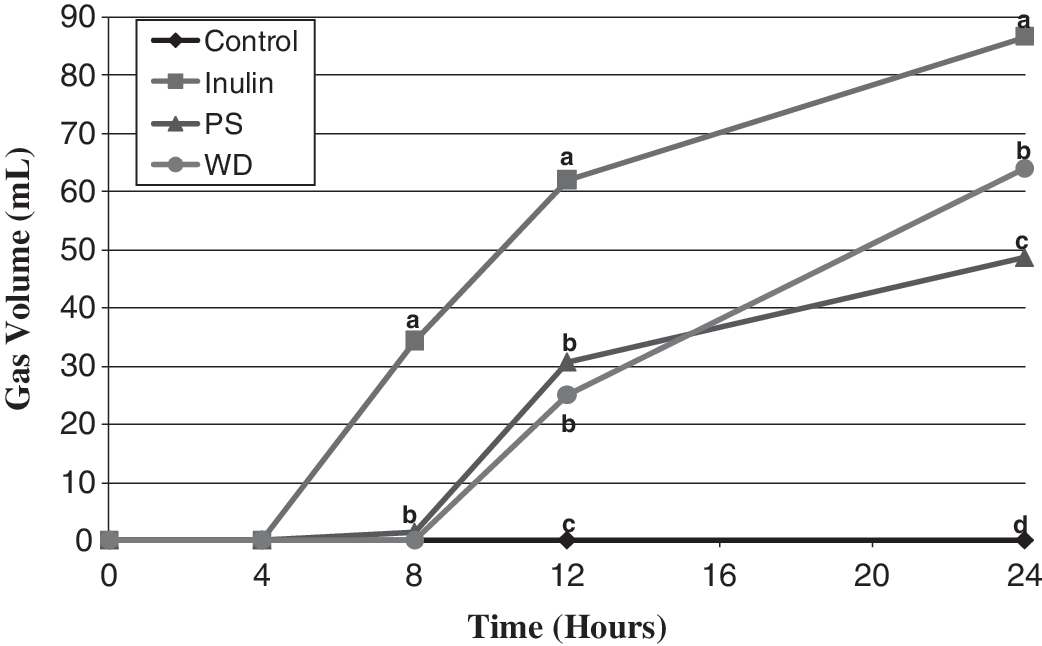
Gas production.
Effect on hydrogen gas concentration
At hour 4 the hydrogen gas concentration of inulin was similar to PS, but significantly higher (P < .01) than WD (Table 2). Inulin had a significantly higher hydrogen (P < .0001) concentration than both PS and WD at 8 and 12 hours. At 24 hours, the hydrogen gas concentration of the fibers was as follows: inulin > PS > WD. The decrease in hydrogen gas concentration at 24 hours for inulin, WD, and control is likely due to the conversion of hydrogen gas to another gas such as methane.
Data are mean ± SD values calculated from three replicates.
Within each row, values with different letters are statistically different (P < .05).
Effects on SCFA production
Acetate concentrations were significantly higher in inulin than the other fibers at 8 and 12 hours (Table 3). At 24 hours acetate production with inulin was similar to WD, but higher (P < .05) than PS. PS produced the most propionate at 4, 8, and 12 hours; however, WD had the highest concentration (P < .05) at 24 hours. PS had significantly higher (P < .05) butyrate concentration than the other treatments at 4, 8, and 12 hours. In contrast, inulin had a higher (P < .0001) butyrate concentration than PS and WD at 24 hours. PS had the highest (P < .05) total SCFA concentration at hour 4. At hour 8, inulin was significantly higher than WD (P < .02), but similar to PS. All fibers were significantly different (P < .01) from each other at 12 hours in the following order: PS > WD > inulin. WD had the highest total SCFA concentration at 24 hours, but this was not significantly different (P < .1) from the other fibers.
Data are mean ± SD values calculated from three replicates.
Within each SCFA and column, values with different letters are statistically different (P < .05).
SCFA molar ratio
When examining the molar ratios of SCFA produced from each fiber at 24 hours, we observed several significant differences (Table 4). Inulin had a higher (P < .01) acetate molar ratio than PS and WD. All fibers varied (P < .05) in propionate molar ratio, with WD having the highest followed by PS and inulin. The highest (P < .0001) butyrate molar ratio was observed in inulin. PS also had a significantly higher (P < .03) butyrate molar ratio than WD.
Data are mean ± SD values calculated from three replicates.
Within each row, values with different letters are statistically different (P < .05).
Discussion
In vitro fermentation models produce estimates of in vivo fiber fermentation. The strength of the model we used is its simplicity and repeatable results. No in vitro method can mimic the complex gastrointestinal environment, so results from in vitro studies must be interpreted cautiously. The techniques work well to screen the hundreds of fiber supplements that are currently on the market and attempt to classify fibers for the rate of fermentation, SCFA production, and hydrogen gas production.
We observed a decrease in pH as a function of time except at 24 hours, where the pH of inulin increased. The decrease in pH is expected because fiber fermentation produces SCFAs, which decrease pH. A decrease in intestinal pH may reduce pathogenic bacteria such as Clostridium perfringens without affecting bifidobacteria. In addition, decreases in pH may increase calcium and magnesium absorption. 6 In this study, a steep drop in pH for inulin was observed between 4 and 8 hours (from 6.8 to 5.4). At the 4- and 8-hour time points, the pH of WD was 6.8 and 6.5, respectively, and for PS it was 6.6 for both time points, indicating steady fermentation. Interestingly, the pH of inulin increased from hours 12 to 24 (from 5.2 to 5.9). The reason for an increase in pH is unknown; however, a similar occurrence was observed in a previous in vitro fermentation without explanation. 18
High rates of gas production in the intestine can cause pain or discomfort. Few data exist on gas production of dietary fibers fermented with an in vitro model. In vitro gas production of WD and PS has not been investigated previously. Gas production with inulin was less in the current study (172 mL/g to 330 mL/g) than an earlier in vitro fermentation study. 19 This could be due to different amounts of inulin being fermented (500 mg vs. 100 mg) or differences in structure of inulin studied.
Gas volume is an important measure; however, gas retention and distribution are also important in vivo. 20,21 Gas retention may be a better indicator of gastrointestinal tolerance than total volume because most individuals develop equilibrium between gas production and gas excretion. 21 Individuals who do not develop this equilibrium tend to have higher discomfort scores than individuals who do. 21 In addition, the location of pressure may alter the perceived discomfort. 20 Jejunal gas infusions resulted in much higher perceived pain than rectal infusion, indicating that the distal colon is much more resilient to large gas volumes than the small bowel. 20 Therefore, site and rate of fermentation may influence tolerance of fermentable fibers. Based on our results, inulin may not be as well tolerated as PS and WD because it produced more gas than the other treatments.
Gas production increases the frequency and volume of flatus, which is an undesirable outcome. 21 Based on in vivo data the frequency and volume of flatus should correlate with the total volume of gas, which was as follows: inulin > WD > PS. Overall, the volume of gas produced may only cause discomfort in a small subset of individuals, but may increase the frequency of undesirable flatus in all individuals.
Hydrogen gas is produced in approximately 70–98% of people as a result of colonic fermentation of undigested carbohydrate, but different criteria for producing status may account for this wide range. 22 Hydrogen gas is not normally present in the human body, so any gas is the result of fiber fermentation. Hydrogen gas has several fates once produced: it can be absorbed into the bloodstream and excreted through the lungs, exit via the anus as flatus, or be converted to acetate, methane, or hydrogen sulfide. 10 Hydrogen sulfide may harm the colonic epithelium. 10
There is disagreement on which routes for hydrogen production predominate. It appears that the concentration of hydrogen, as well as dietary sulfate, influences which pathway predominates. 23 A study on the effect of pH on hydrogen gas fate showed that a decrease in pH from 7 to 6 caused a 50% reduction in hydrogen sulfide production. 23 We did not measure hydrogen sulfide in this experiment; however, the presence of hydrogen gas could provide a substrate for its formation. Inulin produced the most hydrogen gas in this experiment followed by PS and WD at all time points. Decreases in hydrogen gas concentrations were observed at 24 hours, which is likely due to conversion of hydrogen to methane, hydrogen sulfide, or acetate. This trend was also observed in previous in vitro studies. 19 At the 24-hour time point, the hydrogen concentration pattern was inulin > PS > WD. WD produced similar levels of hydrogen concentration as the control.
Animal studies show that higher concentrations of butyrate in the distal colon reduce the incidence of tumor formation. 24 In rodent studies, fiber fermentation increases the apoptosis rate, suppresses aberrant crypt foci formation, and decreases tumor development. 25,26 Verghese et al. 27 found a decrease in aberrant crypt foci formation and tumor size when inulin was fed after carcinogen treatment, but not before, indicating that the timing of fiber supplementation may also play a role in reducing tumor propagation. All fibers in this study produced butyrate, but inulin produced significantly more butyrate than PS and WD.
The fermentation of WD, PS, and inulin increased concentrations of individual SCFAs (acetate, propionate, and butyrate) compared with the control. The observed SCFA production in the control treatment is likely due to the residual fiber in the fecal inoculum. There was no difference in the total concentration of SCFA produced among the three fibers tested. Despite no difference in total SCFA production we did observe differences in the molar ratio of the SCFA production. The molar ratios tend to vary because of substrate structure and constituent sugars, as well as variations in microflora used to inoculate the fibers. 28 We observed a respective molar ratio of 46:27:27 for WD, 42:43:15 for PS, and 40:49:11 for inulin. The molar ratio of WD in a previous study was 49:39:12, which varies from the current study mainly in acetate and propionate. 29 Previous studies 30 have found quite different molar ratios of 51:14:35, 62:16:22, 68:15:14, and 67:8:24 for inulin than the 46:27:27 ratio found in this study.
In conclusion, distinct differences were observed in pH, gas volume, hydrogen gas concentration, and SCFA concentrations with fermentation of WD, PS, and inulin. The volume of gas produced during fermentation may influence the tolerance to these fibers. Overall, differences in fermentation rate and SCFA molar ratio may have therapeutic implications in distal colon health and require further study.
Footnotes
Acknowledgments
This study was funded in part by Novartis Consumer Health. The authors would also like to thank Abby Klosterbuer for her assistance in the laboratory.
Author Disclosure Statement
A.H. is an employee of Novartis Consumer Health Inc. D.A.T., M.L.S., and J. L.S. declare no competing financial interests exist.