
Abstract
γδ T cells are important immune surveillance cells residing in epithelial layers lining the intestine, lung, and reproductive tract. The main objective of this study was to test the hypothesis that consumption of dietary compounds from grapes would modify γδ T-cell function. Other factors related to immune function after grape juice consumption were also tested. A randomized, double-blind, placebo-controlled, parallel intervention was conducted: 100% grape juice made from Concord grapes or a placebo beverage was consumed by 85 individuals daily for 9 weeks. Subjects were asked not to consume other red, blue, and purple fruits during the study. Blood samples, taken at the beginning and the end, were analyzed for γδ T-cell numbers and proliferation, vitamin C, antioxidant capacity, and the ability to protect DNA from strand breaks. Those consuming the grape juice had significantly greater numbers of circulating γδ T cells and higher serum vitamin C levels compared to the placebo by two-way repeated-measure analysis of variance (P < .05). Individuals consuming the placebo had lower serum antioxidant activity, less γδ T-cell proliferation, and increased DNA strand breaks when challenged with H2O2. Analysis of the data by structural equation modeling confirmed that 61% of the variance in biological functions at 9 weeks was due to grape juice consumption. Based on conventional statistical analyses, as well as on sophisticated modeling techniques, regular consumption of purple grape juice in the absence of other red, blue, or purple fruits benefited immunity in healthy, middle-aged human subjects.
Introduction
Overview of immunity and the role of γδ T cells
In an animal knockout model, an inflamed condition results from a lack of γδ T cells. Studies suggest that the γδ T cell also plays a role in killing macrophages once the macrophage's task is complete, 8,9 indicating that these cells have both effector and regulatory functions. Although they constitute only a small portion of circulating lymphocytes, their numbers in the epithelial linings suggest that they play a major role in protecting the host against pathogens, as well as preventing chronic inflammation.
Diet and γδ T cells
The potential for γδ T cells to be influenced by diet has been suggested by in vitro studies 6,10 and in vivo nutrition intervention studies. 11,12 These human studies show that, indeed, consumed dietary components can influence activation and/or proliferation of γδ T cells. 13 Green tea contains alkylamines and several members of the catechin family. Drinking a tea beverage 14 or consuming a capsule based on a green tea formula 12 resulted in an increase in γδ T-cell proliferation, as well as increased synthesis and secretion of interferon-γ.
Rationale for study
Previous studies in our laboratory investigated the effect of grapes and grape products on immune function 15 and γδ T cells in humans. 11,12 The antigen-independent priming of γδ T cells resembles the response of the innate immune system via the Toll-like receptors and pathogen-associated molecular patterns. 7,16 Given the diverse, molecular structures that have been shown to be recognized by γδ T cells, we wanted to ask whether grapes contain compounds that might have a similar effect on γδ T-cell function. Purple Concord grape (Vitis labrusca) juice is rich in polyphenolics, such as catechins (monomers and procyanidins) and anthocyanins. 17,18 As new ligands are discovered for γδ T cells, it appears that food components, particularly plant-based compounds, might be able to influence immunity through priming of the γδ T cell. We hypothesized that γδ T cells would be primed by molecules found in grapes and result in greater proliferation. Based on their regulatory activity, we also anticipated that priming these cells through dietary means would lead to lower indices of inflammation. If regular consumption of 100% grape juice made from Concord grapes primed γδ T cells, we would expect to see enhanced proliferation ex vivo and a reduction of inflammatory biomarkers.
Materials and Methods
Subjects
Healthy men (n = 26) and women (n = 59), ranging in age from 50 to 75 years (mean 57.9 ± 6.3 years), were recruited to participate in a 9-week double-blind, randomized, placebo-controlled parallel intervention. The University of Florida Institutional Review Board approved the study protocol, and informed written consent was obtained from each subject. The number of subjects was determined by power analysis with an α level of 0.05 and a power of 0.80, based on a previous study 12 where the average percentage of γδ T cells in peripheral blood of subjects in the placebo group was 4.7 ± 2.7% and that in the intervention group averaged 9.9 ± 5.3%. The analysis indicated that at least 15 individuals in each group would significantly detect a baseline difference in that parameter. We choose to increase the number of subjects because we were measuring other parameters for which we had no preliminary data. Screening for the study occurred by telephone, and exclusion criteria consisted of the following: refusal to discontinue drinking red wine or Concord grape juice and to restrict consumption of red, blue, and purple fruits and juices during the study; strict vegan or vegetarian diet; regular use of immunosuppressive drugs, antibiotics, or anti-inflammatory medicine; ongoing illness or infection; and dementia or other serious cognitive difficulty. Age was self-reported, and body mass index (BMI) was calculated from weight in kilograms divided by height in meters squared.
Test beverages
Welch Foods, Inc. (Concord, MA, USA) supplied the grape juice and the placebo beverages in coded labels to ensure blinding of both subjects and investigators. The 100% grape juice made with Concord grapes (grape juice from concentrate [filtered water, grape juice concentrate], grape juice, and ascorbic acid) contained, per 8 ounces (240 mL), 170 calories, 20 mg of sodium, 42 g of total carbohydrates (40 g of sugars), and 100% of the daily value for vitamin C (60 mg/day). The 100% grape juice from Concord grapes is not a significant source of fat, cholesterol, protein, fiber, vitamin A, calcium, or iron. The Concord grape–flavored placebo beverage matched the color, calorie, and sugar profile of the 100% juice but did not contain any juice, polyphenolics, or ascorbic acid. Other characteristics of these beverages as determined by the manufacturer are shown in Table 1.
Values reported were determined by Welch Foods Inc. by the method referenced. The Brix is a unit of measure described as g of sucrose/100 g; however, only fructose and glucose are found in both products, not sucrose. The concentration of total phenols was determined by the Folin-Ciocalteu procedure. 19 Anthocyanins were determined by a spectrophotometric method and expressed as mg of malvidin equivalents/L. 20 Procyanidins were determined by normal-phase high-performance liquid chromatography 21 after solid-phase extraction of the juice with a Sephadex LH-20 column. 21,22 Oxygen radical absorbance capacity (ORAC) was determined by an improved version of the assay using fluorescein as the probe and is expressed in Trolox equivalents (TE). 23
ND, not detected.
Study design
Prior to beginning the intervention phase of the study, participants underwent a 1-week washout period. Subjects arrived for the initial blood draw (d1) and were randomly assigned to one of two groups by drawing colored marbles from a container. Each participant was instructed to drink 360 mL (12 ounces) of beverage throughout the day, every day for 9 weeks. Subjects were told the calorie content of the beverage and were advised to adjust their caloric intake accordingly to avoid weight gain during the study. They were asked to refrain from drinking other red, blue, or purple beverages, including red wine, and to avoid red, blue, and purple fruits and vegetables during the study so that we could isolate the benefits due to the grape juice from those of other anthocyanin-containing foods.
At 9 weeks, study participants returned for their final blood draw and to complete an exit questionnaire. The exit questionnaire included questions to determine if subjects experienced any side effects from the juice, drank red wine, consumed red, blue, or purple fruits, or took medication(s) that were on the exclusion list. To determine the efficacy of blinding, subjects were asked to report whether they thought they had received the research juice or the placebo juice and why they believed that. Overall study compliance was assessed by participants' self-reporting if they missed drinking any juice during the study and by counts of remaining beverage bottles at the end of the study.
Primary outcomes were γδ T cell numbers and proliferation, serum vitamin C levels, DNA strand breaks in lymphocytes, serum amyloid α (SAA), and C-reactive protein (CRP).
Blood, serum, and peripheral blood mononuclear cell collection
Autologous serum was used in assays set up on the day of each blood draw. Another aliquot of serum was diluted 1:5 in 6% (vol:vol) m-phosphoric acid to preserve ascorbic acid and frozen at −80°C. Additional aliquots of serum were frozen at −80°C for subsequent analysis.
To obtain peripheral blood mononuclear cells (PBMCs), whole blood was diluted 1:1 with 0.15 mol/L NaCl and placed on a separation gradient (Lympholyte H® cell separation medium, Cedarlane Laboratories Ltd., Hornby, ON, Canada) and centrifuged (800 g, 20 minutes, 20°C). Cell pellets were resuspended in 2 mL of RPMI 1640 medium containing 100,000 U/L penicillin, 100 mg/L streptomycin, 0.25 mg/L amphotericin B, 50 mg/L gentamicin, 2 mmol/L
Culture of PBMCs for γδ T cell expansion and 3-(4,5-dimethylthiazol-2-yl)-2,5-diphenyltetrazolium bromide proliferation assay
On the day of blood collection, 0.5 × 10⁶ PBMCs were stained with cell surface markers (see Flow cytometry) to determine the percentage of the γδ T-cell population in the entire PBMC suspension. Also on the day of blood collection, 1.0 × 10⁶ PBMCs in 1 mL of RPMI 1640 complete medium containing 10% autologous serum, 25 μmol/L isopentenyl pyrophosphate ammonium salt (Sigma-Aldrich, St. Louis, MO, USA), and 32.5 U/mL of recombinant human interleukin-2 (BD Biosciences, San Diego, CA, USA), were placed in duplicate wells of a 24-well tissue culture plate (Costar, Corning, NY, USA). Plates were incubated in a humidified, 5% CO2 atmosphere at 37°C for 6 days.
To determine general cell proliferation, 2.5 × 10⁵ PBMCs in 100 μL of RPMI 1640 complete medium were placed in duplicate wells of a 96-well, U-bottom plate, with and without 10 μg/mL phytohemagglutinin-L (Sigma-Aldrich). Plates were incubated in a humidified, 5% CO2 atmosphere at 37°C for 3 days. On day 3, 10 μL of 3-(4,5-dimethylthiazol-2-yl)-2,5-diphenyltetrazolium bromide (Sigma-Aldrich) in phosphate-buffered saline at 5 mg/mL was added to each well, and the plate was again incubated for 4 hours at 37°C. Then, 100 μL of acid isopropanol was added to all wells and mixed well to dissolve crystals. Plates were immediately read at 570–630 nm on a SpectraMax 340PC plate reader (Molecular Devices, Sunnyvale, CA, USA). Data were analyzed using SOFTmax® Pro version 5.0 (Molecular Devices).
Flow cytometry
The percentages of γδ T cells in whole PBMC suspensions were determined by two-color flow cytometry, using cell surface markers for identification on d1 (day of blood collection) and day 6 of culture. Phycoerythrin-conjugated anti-human CD3+ and fluorescein isothiocyanate (FITC)-conjugated anti-human T-cell surface marker γδ T-cell receptor (eBioscience, San Diego) were used to stain PBMCs. PBMCs in staining buffer were incubated on ice for 30 minutes. Cells were fixed with 1% paraformaldehyde in phospahte-buffered saline containing 0.1% NaN3 and read within 24 hours on a FACScan™ (Becton-Dickinson, San Jose, CA, USA). Data were analyzed using WinMDI software (build 1301-19-2000, Scripps Institute, La Jolla, CA, USA). Data collected were from gated CD3+ cells. Final data are reported as mean ± SD percentages of cells expressing the γδ T-cell receptor cell surface marker.
DNA strand break assay
A 2-mL aliquot of PBMCs (1 × 10⁹/L) in complete RPMI 1640 medium with 10% autologous serum was placed into each of two wells of a 12-well plate on the day of blood collection. Hydrogen peroxide (H2O2) was added to one of the wells to a final concentration of 25 mmol/L, with the untreated well serving as the control. The cells were incubated at 37°C for 2 hours, washed twice with cold phosphate-buffered saline, and processed using the ApoAlert DNA fragmentation assay kit (BD Biosciences Clontech, Palo Alto, CA, USA). This assay is based on the terminal deoxynucleotidyl transferase-mediated dUTP nick-end-labeling assay. The fluorescein-labeled DNA was quantified by flow cytometry. Data were analyzed using WinMDI software. Results are reported as the percentage of cells in the propidium iodide-negative/FITC+ quadrant of total cells minus debris.
SAA and CRP determination
Levels of serum SAA were detected using an enzyme-linked immunosorbent assay kit following the manufacturer's directions (Biosource/Invitrogen, Camarillo, CA, USA). The minimum detectable amount of human SAA was <4 ng/mL. CRP levels in serum were detected using an enzyme-linked immunosorbent assay kit according to the directions of the manufacturer (ALPCO Diagnostics, Salem, NH, USA). The minimum detectable level of human CRP was 0.124 ng/mL.
Serum vitamin C analysis
Total serum vitamin C was determined using a modification of the dinitrophenylhydrazine assay used by the Centers for Disease Control and Prevention. 24 Serum was diluted 1:5 with 6% m-phosphoric acid and frozen at −80°C to preserve ascorbic acid. On the day of analysis, samples were thawed and centrifuged to precipitate proteins. Serum (900 μL) was combined with dinitrophenylhydrazine-thiourea-copper sulfate reagent (300 μL) in 12- × 75-mm borosilicate glass tubes and incubated in a 37°C water bath for 2 hours, with vortex-mixing every 30 minutes. Cold 65% H2SO4 (1.5 mL) was added, and the tubes were incubated in the dark for 30 minutes at room temperature. Samples (270 μL) were transferred to wells of a 96-well flat-bottom plate, and the absorbance was measured at 520 nm on the SpectraMax 340PC plate reader. Data were analyzed using SOFTmax® Pro version 5.0. Values were expressed as μmol/L vitamin C.
Serum oxygen radical absorbance capacity
Antioxidant activity in protein-free sera was determined using the oxygen radical absorbance capacity (ORAC) assay 23,25 for a 96-well microplate reader with some modifications. Sera that had been previously diluted 1:5 in 6% m-phosphoric acid and frozen at −80°C were thawed, and protein was removed by centrifugation (12,000 g, 5 minutes, 4°C). Samples were diluted further 1:10 in phosphate buffer, and 50 μL of each sample was pipetted into wells of a 96-well microplate. Then, 100 μL of 20 nM fluorescein was added to the plate. The 96-well plate was placed in a SpectraMax GeminiXPS fluorescent plate reader (Molecular Devices), prewarmed to 37°C. The plate was mixed for 3 minutes and then incubated for an additional 7 minutes at 37°C. During plate incubation, the free radical was prepared by adding 0.228 g of 2,2′-azobis(2-amidinopropane) dihydrochloride to a total volume of 6 mL of phosphate buffer and vortex-mixed before use. After the initial 10-minute incubation period, 50 μL of 2,2′-azobis(2-amidinopropane) dihydrochloride was added to the plate wells (except for the control wells), and FITC fluorescence decay was monitored at 32-second intervals for 40 minutes (excitation, 485 nm; emission, 538 nm; cutoff, 530 nm). Data from d1 and 9 weeks were expressed in μmol of Trolox equivalents/L of serum. ORAC values were calculated by the use of the area under the curve with SOFTmax Pro version 5.0.
Statistical analysis
A repeated-measure two-way analysis of variance was performed with a post hoc Student-Newman Keuls test for all pairwise comparisons using SigmaStat version 3.11 (Systat Software, Point Richmond, CA, USA). Data were still blinded for all statistical analyses. Time (d1 vs. 9 weeks) and treatment (placebo vs. grape juice) were the two main outcome objectives with P < .05 and interactions tested at P < .25. Group demographics were tested for significance using a Student's t test; analysis of data that were not normally distributed was by Mann-Whitney rank sum test. All results are expressed as mean ± SEM values, unless otherwise noted.
To further understand the impact of grape juice on biological outcomes, we utilized a statistical model in which several physiological indicators were used in combination, to represent biological function. Structural equation modeling was accomplished using Amos™ (SPSS, Chicago, IL, USA). Specifically, in this model we examined an unobserved or latent variable of Time 1 biological function, which represented the combined statistical effect of d1 measures of serum vitamin C (VitC1), DNA strand breaks with and without H2O2 (DNA1), serum ORAC (ORAC1), and γδ T cell number and proliferation (designated GDT1). In the model we tested, Time 2 biological function (VitC2, DNA2, ORAC2, and GDT2) was a similar latent variable explained by observed measures of the same six specific biomarkers at the Time 2 (9-week) measurement.
We hypothesized that age and BMI would predict biological function and that, for Time 2 only, juice consumption would also predict biological function. Finally, we correlated errors in the model for each of our Time 1 and Time 2 variables (e.g., error variance in measuring VitC1 should be correlated with error variance in measuring VitC2 because the method of measurement is the same and the individuals are the same; for ease of comprehension, these relationships are not visually represented in Fig. 1). This analysis should be viewed as exploratory because it is, to our knowledge, the first attempt to test this type of model of biological function and because the sample size in the study is relatively small for structural equation modeling, which typically utilizes samples of 100 or more. In testing the proposed model, we examined the full model shown in Figure 1, except we had not originally proposed that age would directly predict vitamin C levels at Time 1 (this path in the model is in bold); however, the addition of this relationship was needed to fully account for the variance in the data.
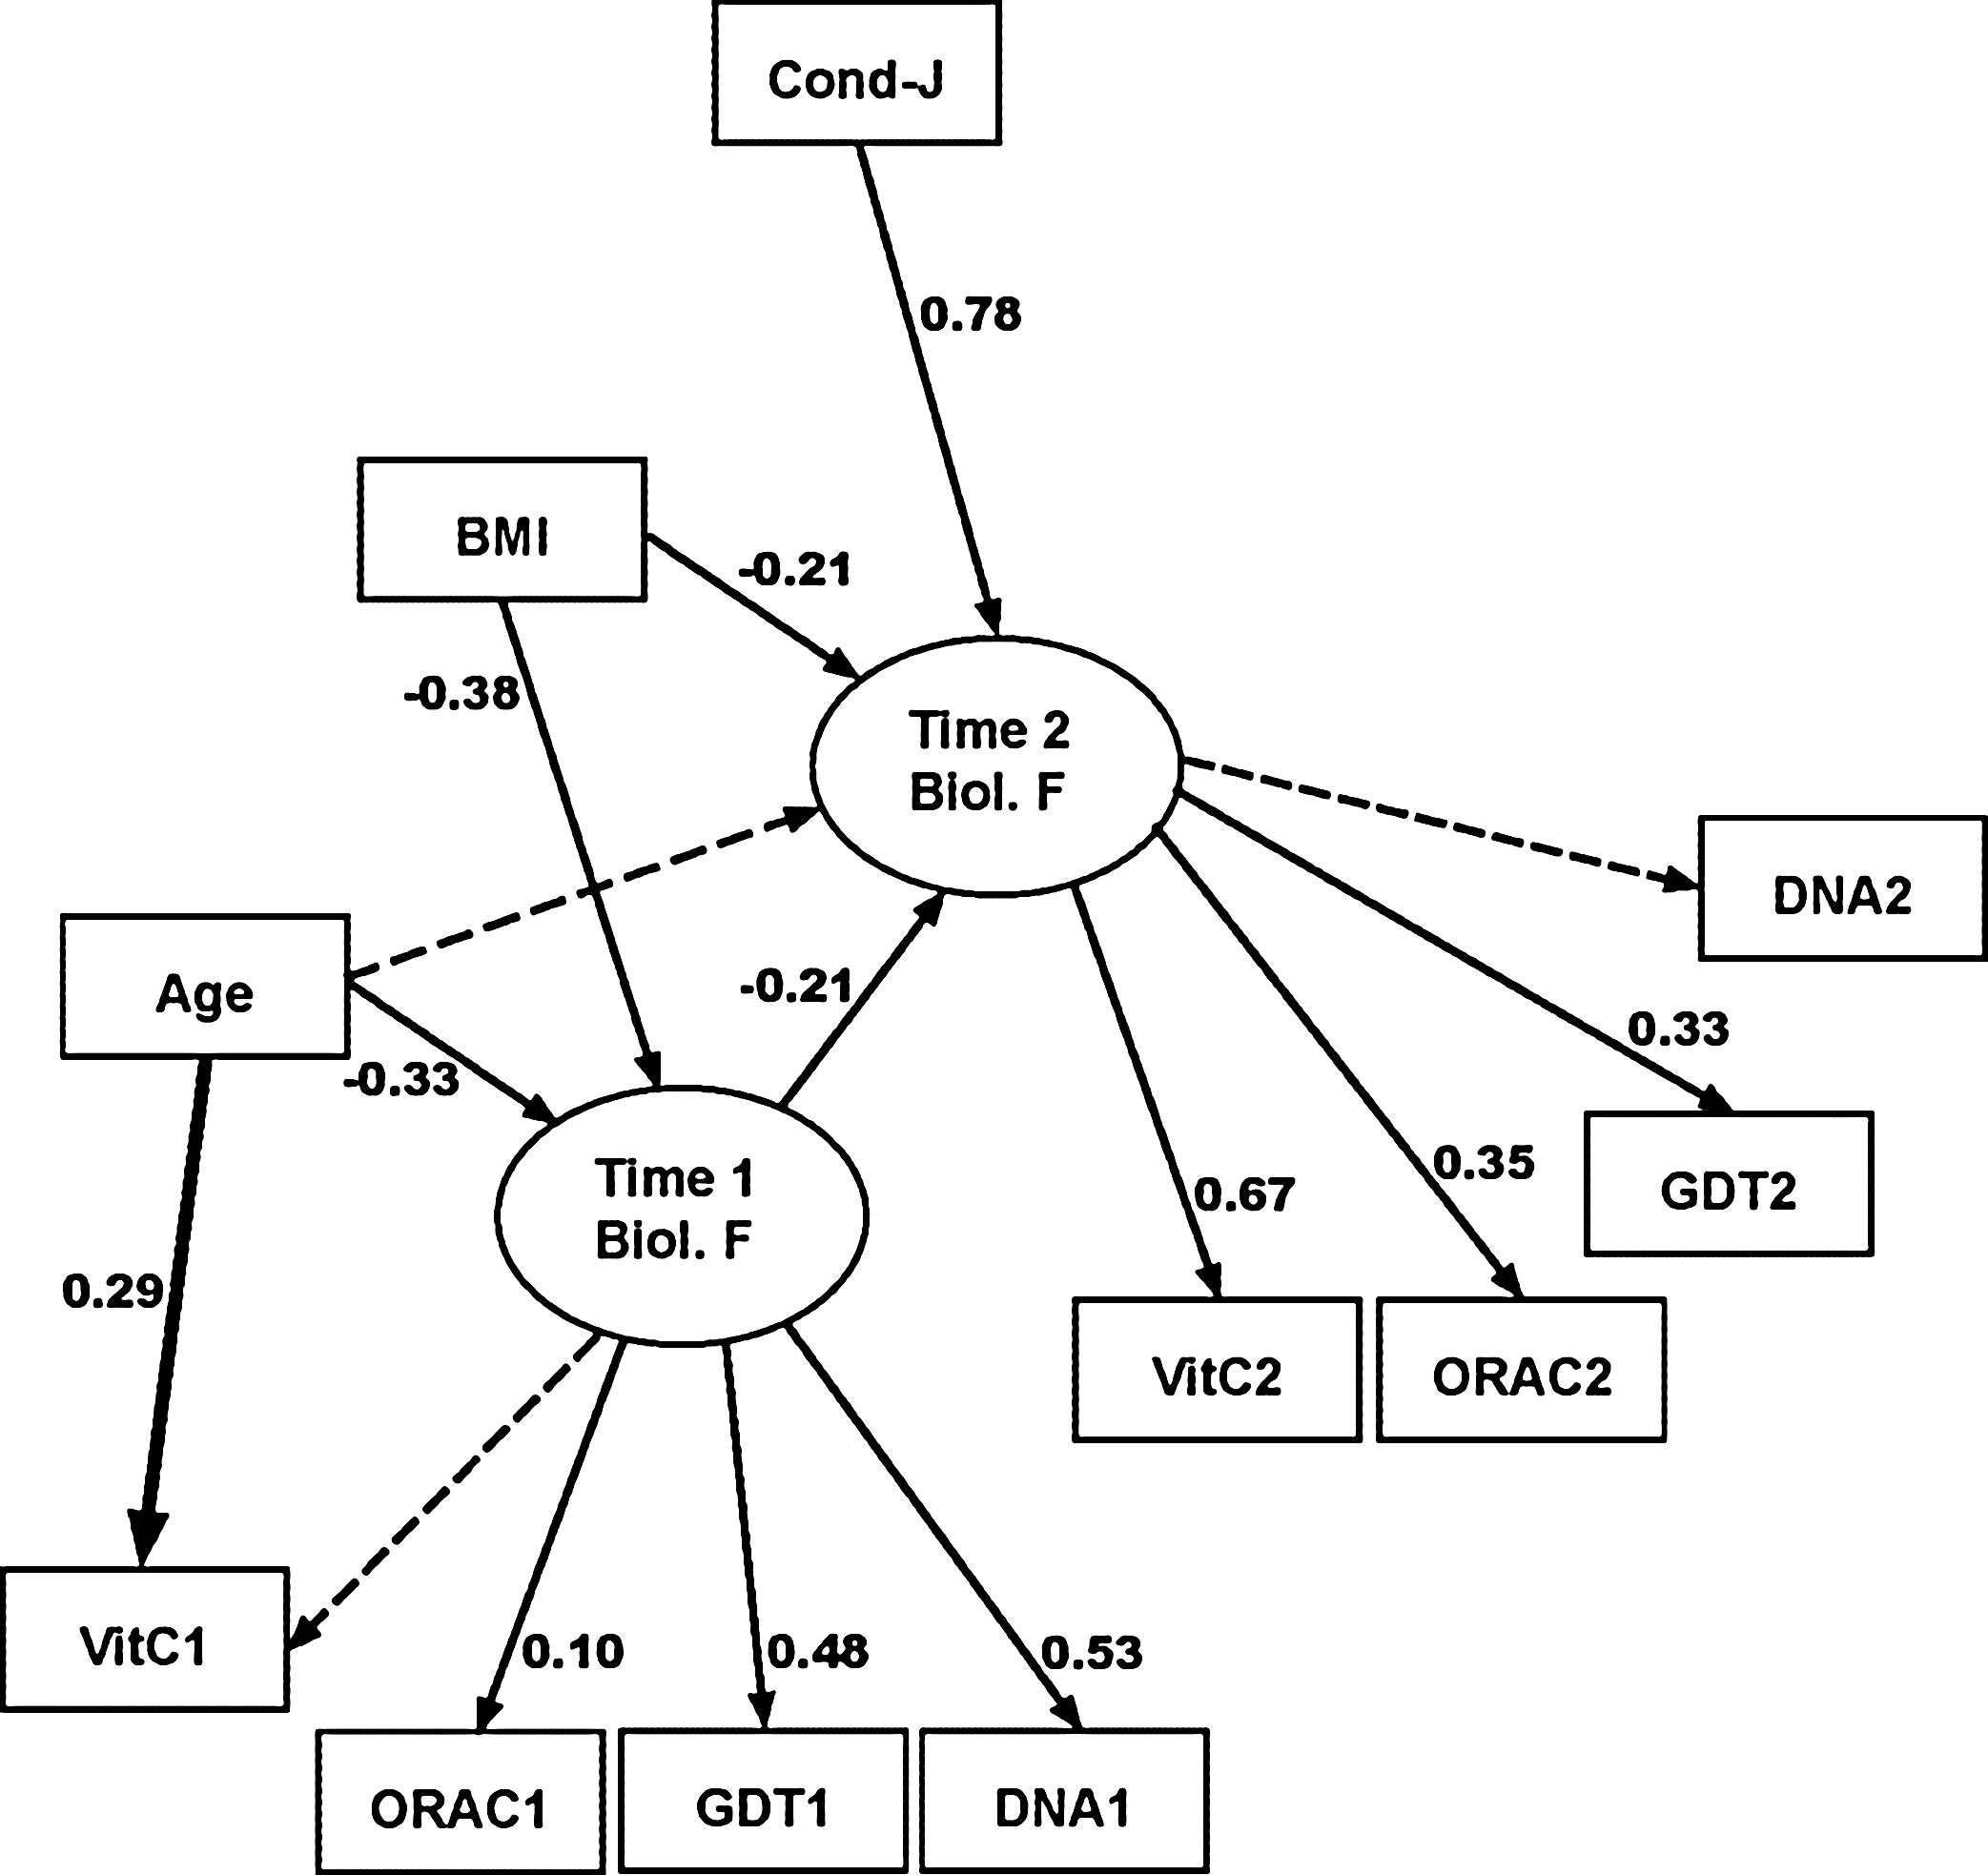
Structural equation model. A latent factor of biological function was examined and measured with several biomarkers at Time 1 (pretest [values followed by 1]) and at Time 2 (9 weeks [values followed by 2]). Each path coefficient should be interpreted as if it was a standardized regression coefficient. The arrow from Age to vitamin C (VitC) levels at Time 1 is in bold type, to show that this relationship was not part of our hypothesized model. The dashed lines represent relationships that were hypothesized but are not needed in the model to account for the data, so no coefficients were provided for those paths. Cond-J is the condition under which juice is consumed, in other words, the treatment group. BMI, body mass index; DNA, DNA strand breaks; GDT, γδ T cell cell number and proliferation.
Results
Subjects
Eighty-five people were enrolled in the study, with 46 drinking 100% grape juice and 39 drinking the placebo beverage (Fig. 2). Six dropouts occurred in the grape juice group (two related to the study and four for reasons not related to the study), while one person dropped out of the placebo group (for reasons not related to the study). Statistics were performed on the intent-to-treat population, as well as on those participants who completed the study, and no differences in statistical significance were found. The data reported are based only on participants who completed the study. The average age of the subjects was 57.9 (±6.3) years, with a range from 50 to 75 years (Table 2). More women participated in the study than men, but there were equal numbers of each gender within the two groups. Height, weight, and BMI were similar between the groups. Compliance was self-reported, as well as determined by asking how many bottles of juice remained at the end of the study. Subjects reporting having half a bottle remaining were considered 100% compliant. The study was adequately blinded, with around 55% of participants guessing which beverage they had correctly.
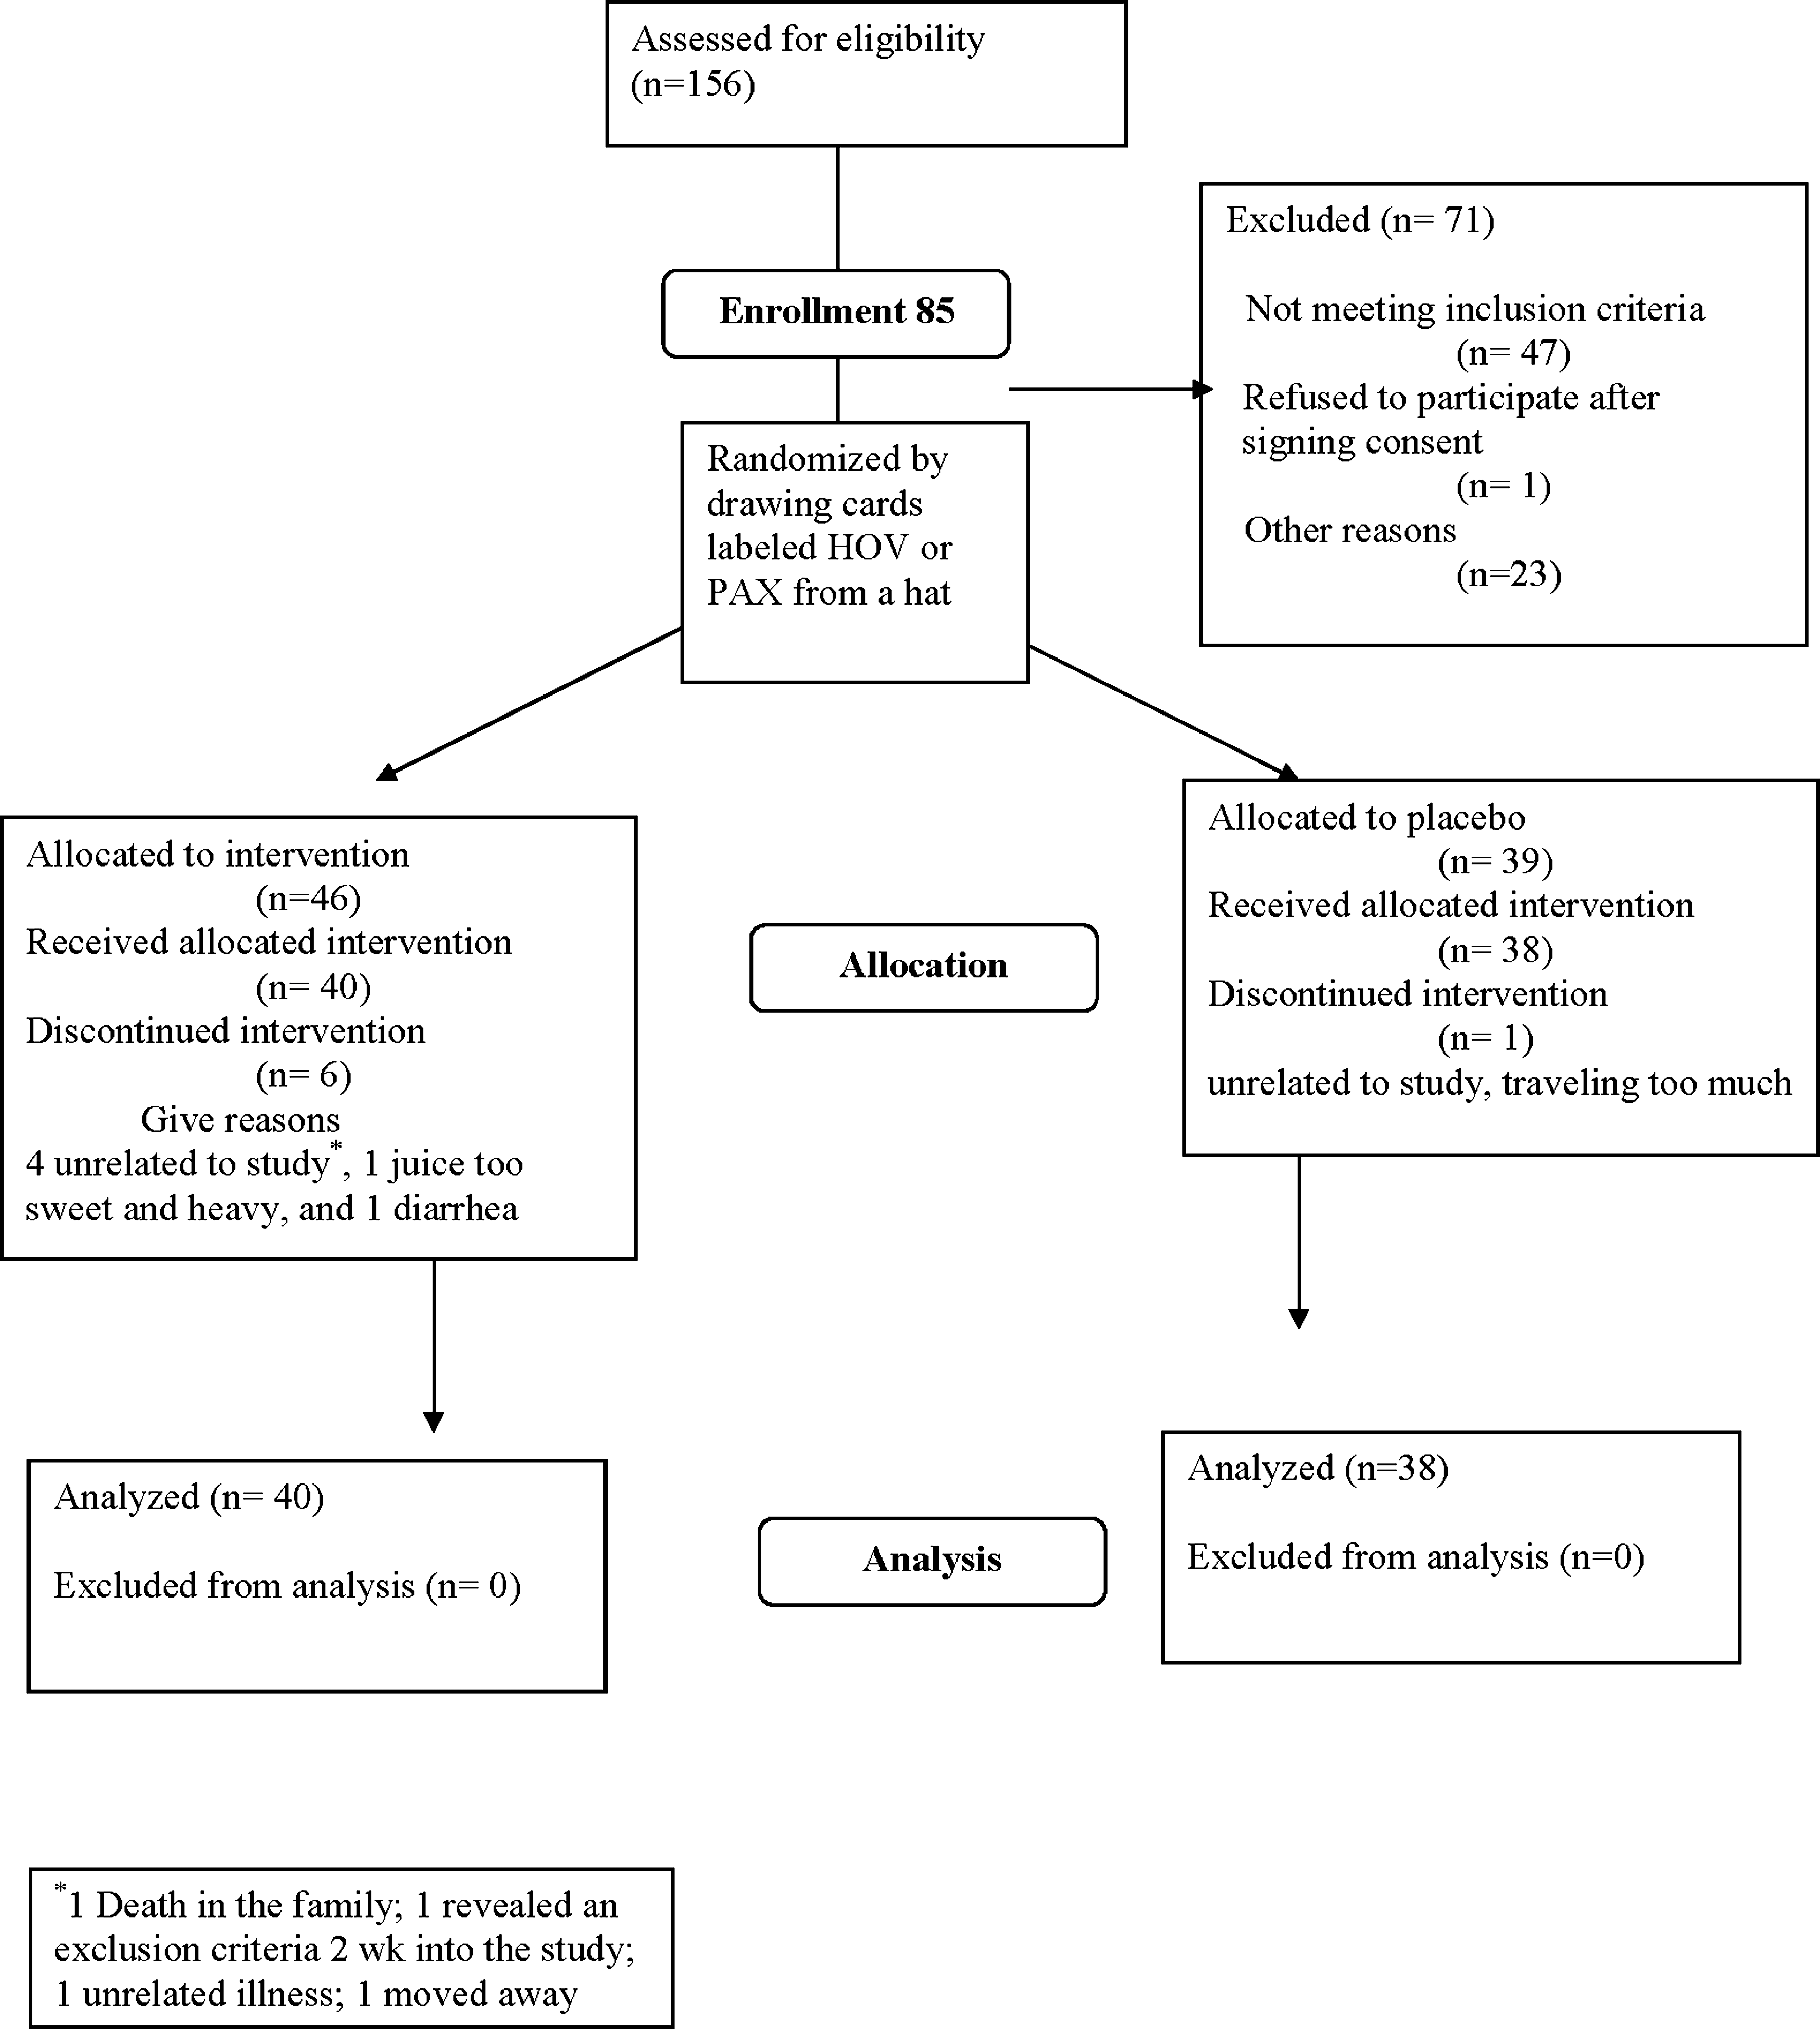
Flow diagram of those persons assessed for eligibility, enrolled in the study, allocated to the juice or placebo and statistically analyzed. HOV and PAX were the code names used to preserve blinding.
Data are mean ± SD values. Statistical comparisons were made with Student's t test.
Serum analyses
The serum antioxidant capacity of those consuming the placebo beverage dropped significantly over the 9-week study period, whereas that of those drinking grape juice did not (Table 3), as determined by the ORAC method. Vitamin C concentration was significantly higher after 9 weeks of grape juice consumption and unchanged in the placebo. On average, plasma vitamin C levels increased by 25% in grape juice drinkers.
Data are mean ± SEM values. Statistical differences were determined by a repeated-measure two-way analysis of variance.
Values with different superscripts in a column are statistically different.
PBMC proliferation
Total PBMC proliferation, and more specifically γδ T cell proliferation, was measured after 6 days of culture in 10% autologous serum. No differences were found in the total PBMC proliferation (Table 4). After 9 weeks of juice consumption, the percentage of γδ T cells in the peripheral blood rose significantly as a percentage of the CD3+ population in grape juice drinkers, whereas that of those drinking the placebo did not change. When γδ T cells were stimulated to proliferate with isopentenyl pyrophosphate and interleukin-2 after 9 weeks, the response of the placebo-consuming group was statistically lower than that of the grape juice-consuming group. However, there was no statistical difference in γδ T-cell proliferation between d1 and 9 weeks in grape juice consumers.
Data are mean ± SEM values. Statistical differences were determined by a repeated-measure two-way analysis of variance. Numbers of γδ T cells were enumerated by flow cytometry in freshly prepared peripheral blood mononuclear cells (PBMCs), whereas proliferation was determined after culturing with isopentenyl pyrophosphate for 6 days.
Values with different superscripts in a column are statistically different.
Biomarkers of inflammation
CRP and SAA, biomarkers of inflammation, did not respond significantly with regard to time or treatment (data not shown).
DNA strand breaks
Control PBMCs (those not challenged with H2O2) were labeled for DNA strand breaks as were the cells challenged with H2O2 (Table 5). The first measure allowed for a measurement of intrinsic strand breaks (strand breaks that are present due to normal metabolic activity). Incubation with H2O2 induced strand breaks and illustrated the level of protection that the cell might have in preventing DNA strand breakage. Intrinsic strand breaks were not significantly affected by time or treatment. After 9 weeks of consuming the placebo beverage, those subjects had significantly greater induced strand breaks than they had at d1. However, induced strand breaks after 9 weeks of grape juice consumption were not significantly different from the d1 values.
Data are mean ± SEM values. The percentage of cells refers to the percentage of cells in the propidium iodide-negative/fluorescein isothiocyanate-positive quadrant relative to the total. Intrinsic strand breaks represent those inherent to the person, while induced strand breaks are caused by incubation with H2O2. Statistical differences were determined by a repeated-measure two-way analysis of variance.
Values with different superscripts in a column are statistically different.
Structural equation modeling results
In structural equation modeling models such as this one, with 75–200 cases, a significant χ2 indicates that the proposed model differs significantly from a model that represents the data, whereas a nonsignificant χ2 value shows that the proposed model fits the data well. In addition, a low root mean square error of approximation (below 0.05) and a high comparative fit index (above 0.90) are indicators of fit, that is, they show that the model represents a good fit to the observed data. Figure 1 shows the final model that provided excellent fit to the data: χ2 (1, N = 78) = 24.05, P > .40, root mean square error of approximation = 0.005, comparative fit index = 1.0. As we proposed in the original modeling, there is a strong influence of BMI on both biological latent variables and a strong influence of juice condition on biological function at Time 2 (9 weeks).
The dashed lines in Figure 1 represent relationships that were hypothesized but are not needed in the model to account for the data, so no coefficients were provided for those paths. The relative influence of our measures varies from Time 1 to Time 2 in that age significantly influenced only Time 1 function and added no additional increment to Time 2 biological function. VitC1 did not contribute significantly to biological function, and DNA did not contribute significantly to Time 2 biological function. This change in influence is partly due to the fact that Time 1 biological function predicts Time 2 function in the model, so that Time 1 biological influences are part of the Time 2 prediction. As expected, higher age and higher BMI scores were associated with poorer biological function. Relationships that approached significance were retained in the model. The numbers shown in Figure 1 are the standardized estimates from the structural equation modeling analysis for primary relationships in the model and should be interpreted as a standard regression weight. Notice that the strongest prediction in the model is that the condition of consuming juice has a significant impact on Time 2 biological function. Also note that DNA (referring to DNA strand breaks) and GDT (representing γδ T-cell number and proliferation) are both strongly related to biological function at Time 1 and that Time 2 biological function is strongly related to ORAC, GDT, and vitamin C levels at 9 weeks.
Discussion
The human subjects in this study were specifically recruited from people 50 years of age or over. Some studies suggest a remodeling of immunity as we age, 26,27 and we postulated that subjects in this age group might display greater changes in immunity as a function of diet. The age group we recruited was not immune-senescent but was chosen because the older population may possibly be more responsive to dietary modifications than one composed of younger college-aged counterparts, because of age-related changes of the immune system.
Importance of dietary components on immunity
This study is the first to examine human immunity after regular consumption of purple grape juice. A literature search found nine studies in which humans consumed purple grape juice during an intervention trial, 28 –37 yet all of those studies were related to coronary heart disease and measured biomarkers such as platelet aggregation, oxidative stress, blood pressure, and vasodilation. An animal study showed a reduction in age-related cognitive decline after consumption of purple grape juice. 38,39 None of the human research studies addressed the impact of grape juice on immunity. The immune system plays a role in a majority of disease processes; therefore understanding its regulation is important in the prevention and treatment of disease.
Composition of purple grape juice and the relationship to immunity
Mullen et al.
18
examined 13 commercially available fruit juices and juice drinks in the United Kingdom and found that purple grape juice contained the largest number of individual phenolic compounds, as well as the highest concentration of total phenolics, largely hydroxycinnamic acids, procyanidins, and anthocyanins. Jutila's laboratory has demonstrated the effect of procyanidins on γδ T cells in an ex vivo culture.
6,10
We have shown that consumption of a capsule based on the chemical composition of green tea impacted γδ T-cell proliferation.
12
The capsule formula consisted of two procyanidin monomers, catechin and epicatechin, as well as
Serum analyses
In addition to the polyphenol and procyanidin content, regular consumption of purple grape juice may benefit immunity by providing 100% of the daily value of vitamin C. Higher vitamin C concentration, however, was not reflected by increased serum antioxidant activity, and serum antioxidant activity was lower in those who consumed placebo juice, likely because of the avoidance of red, blue, and purple fruits during the study. Vitamin C is an essential nutrient that has been linked to immunity. Exact mechanisms for vitamin C have not been linked to a specific immune function. Studies have shown, however, that vitamin C supplementation improved phagocytic function and T cell proliferation and enhanced maintenance of the skin barrier, while its general, nonspecific antioxidant activity may protect immune cells during activation (see previous reviews 40,41 ). The incidence of the common cold is not affected by vitamin C, whereas duration and severity may be reduced. 40,42 Also, while vitamin C might be of benefit for the treatment and prevention of pneumonia in those who have low serum vitamin C or acute physical stress, 43 it may not be of benefit to the general population. Thus, vitamin C in purple grape juice may contribute in a nonspecific way to immune function.
Finally, other compounds may exist in grape juice that modify immunity, such as melatonin. Melatonin has been reported in grapes 28 and also has been shown to impact immunity. 44
Proliferation as an index of immune function
The ability of immune cells to proliferate ex vivo is used as a sign of immune system strength. Immune cells should proliferate when stimulated by a foreign invader and, if they are primed, should proliferate more rapidly and to an even greater extent. Certain dietary components actually prime cells and make them react more rapidly to a stimulus. 2,6,7,14 Our results show an effect of the grape juice intervention was responsible for a significant increase in γδ T-cell proliferation, compared to the placebo.
DNA strand breaks as an index of antioxidant protection
The cells of the body are continually assaulted by reactive oxygen species. Both endogenous and exogenous (dietary) antioxidants are required to adequately protect cellular protein, lipid, and DNA.
The assay we use to measure antioxidant protection, DNA strand breaks, tells two things: the number of strand breaks that are inherent to the individual (intrinsic) and how susceptible the cells are to an oxidative challenge (induced). Intrinsic strand breaks were not different among the times and treatments, suggesting neither harm nor benefit due to the intervention treatment. Using H2O2 as a challenge agent, the number of strand breaks formed during the exposure can measure how much protection the cell has acquired from the diet. There were significantly more strand breaks in PBMCs in the placebo group when incubated with H2O2, possibly due to the reduced consumption of the purple, red, and blue fruits. It also suggests that the grape juice intervention offered a degree of protection for the cells when reactive oxygen species are present.
Study limitations
The hypothesis that γδ T cells would be affected by juice consumption was supported by an improvement in the number of circulating γδ T cells. In addition, GDT in the structural equation model shows significant prediction of both Time 1 and Time 2 biological function. Proliferation of γδ T cells did not change after juice consumption but was reduced after consumption of the placebo beverage compared to the juice consumers. Although greater than 90% of the subjects reported avoidance of red, purple, and blue fruits and those that did consume them were restricted to five to six servings at most for the duration, nonetheless, a limitation is the nature of the self-reported avoidance of these fruits. We stimulated PBMCs to proliferate with isopentenyl pyrophosphate, a well-known and characterized γδ T-cell antigen. 3,45 However, it may have been more successful if we had stimulated the cells with grape juice compounds because we hypothesized they were the priming agent. Although plant tannins have been shown to cause proliferation of γδ T cells in ex vivo culture, 6,16 research has not been conducted to elucidate the specific compound or family of compounds in the grape juice that may be responsible for the changes seen in the human intervention study. It was beyond the scope of this study to try to identify specific compounds in the purple grape juice that might be responsible for priming γδ T cells. Our hypotheses advocate for either the procyanidins or the anthocyanins as potential candidates.
Modeling
The changes that we observed in immune function using conventional statistics were not of a large magnitude and are not surprising, considering that this is a food, not a drug, and that there is considerable variability in humans, not only due to their genetic and environmental variability, but also due to the diversity in their immunological and vaccination history. It is notable that the placebo, representing the absence of purple grape juice and its inherent phenolics and avoidance of red, blue, and purple fruits and vegetables, had some slight negative consequences, suggesting the value of these foods in the everyday diet. The advantage of structural equation modeling is that it allows us to examine multiple relationships at once, as they are influencing each other. Because of this, structural equation modeling takes into account patterns of correlations among variables and allows us to examine whether a proposed set of relationships accounts for the variance in the data across multiple observed variables. It also has an advantage over traditional analyses in that structural equation modeling allows us to look at an unobserved construct that represents a combination of several observed variables, such as overall biological function. This modeling was critical to understanding the impact of the changes related to juice, on the whole biological system.
In conclusion, regular consumption of grape juice was beneficial in the absence of other purple, red, and blue fruits. Juice consumption was the strongest predictor of overall Time 2 biological function, accounting for 61% of the variance. Consumption of grape juice had a positive influence on vitamin C levels and on the number of γδ T cells in the circulation. Consumption of the placebo beverage led to lower antioxidant activity in the serum, less γδ T-cell proliferation, and increased DNA strand breaks after treatment with H2O2. Consumption of grape juice led to preservation of serum antioxidant activity, improved proliferation of γδ T cells, and provided protection to the immune cells from the damage induced by H2O2. Inflammatory biomarkers were not affected by either beverage, perhaps because of insufficient time or treatment. Based on conventional statistical analyses, as well as on sophisticated modeling techniques, regular consumption of purple grape juice benefited immunity in healthy, middle-aged human subjects.
Footnotes
Acknowledgments
We would like to acknowledge Neal Benson and Steve McClellan of the University of Florida Flow Cytometry Core Laboratory for their assistance with flow cytometry. We thank undergraduate students Cindy Montero, Jillian Lozada, Andrew Migliaccio, and Andrew Romero for their enthusiastic help, Erin Hastings for her dedication to the project, and Linda Sweet for phlebotomy. Research support was provided by Welch Foods, Inc. and the University of Florida Agriculture Experiment Station.
Author Disclosure Statement
C.A.R., M.P.N., and C.N.J. made substantial contribution to the generation, collection, assembly, and analysis of the data. R.L.W. was responsible for the conception and design, collection and interpretation of the data, and the drafting of the manuscript regarding the structural equation modeling. S.S.P. was responsible for the conception and design overall, analysis and interpretation of the data, drafting, revision, and final approval of the manuscript. No competing financial interests exist for any author.