
Abstract
Apigenin (4′,5,7-trihydroxyflavone) is one of the leading components supporting targeted treatment options. We explored the cytotoxic and apoptotic effects of various doses of apigenin administered alone and together with 5-fluorouracil (5-FU)—a chemotherapeutic agent with high cytotoxicity—for different incubation periods, on morphologic, DNA, RNA (messenger RNA [mRNA]), and protein levels on the p53 mutant HT29 human colon adenocarcinoma cell line. Treatment with apigenin alone for a 72-hour incubation at 90-μM dose resulted in an apoptotic percentage of 24.92% (P=.001). A higher percentage (29.13%) was observed after treatment with the same dose of apigenin plus 5-FU for the same incubation period (P=.001). These results were confirmed as mRNA and protein expression levels of caspase-3 increased 2.567-fold and mRNA expression levels of caspase-8 increased 3.689-fold compared with the control group. On the other hand, mRNA expression levels of mammalian target of rapamycin (mTOR) and cyclin D1 (CCND1) decreased by 0.423-fold and 0.231-fold, respectively. To our knowledge this is the first study showing that treatment with apigenin alone results in cell cycle arrest through activation of caspase cascade and stimulation of apoptosis in HT29 cells. It also shows that use of apigenin plus 5-FU further increases this effect. This study draws attention to the probable clinical effectiveness of apigenin plus a chemotherapeutic agent with high cytotoxicity. It also highlights the induction of desirable apoptotic effects by targeting the caspase cascade pathway through administration of reduced doses for shorter incubation periods.
Introduction
C
The growth-inhibitory and apoptotic potential of apigenin, which arrests cell-cycle G2/M phase, was observed in several cancer cells, including breast epithelial, 6,7 cervix, 8 prostate, 9 –11 skin, 12 colon, 13 neuroblastoma, 14 esophageal, 15 and pancreatic 16 cancers and lymphocytic leukemia. 17,18 Stimulation of various potential signal mechanism pathways by apigenin may induce cell cycle arrest and apoptosis in these cancer cells. Way et al. 19 proposed that apigenin-induced cellular effects result from loss of HER2/neu and HER3 expressions, with subsequent inactivation of phosphatidylinositol 3-kinase (PI3K) and Akt in cells that depend on this pathway for cell proliferation and inhibition of apoptosis. Another study has shown that Akt inactivation and dephosphorylation of proapoptotic protein BAD is a critical event in apigenin-induced decreased cell survival and apoptosis in human prostate cancer in vitro (PC-3 cells) and in vivo. 10 In addition, apigenin inhibits the GLUT-1 glucose transporter and the PI3K/Akt pathway in human pancreatic cancer cells. 16
In a recent study, apigenin acted a suppressor of the Akt/protein kinase B pathway in primary effusion lymphoma cells. 18 Molecular mechanisms during apigenin-mediated growth inhibition and induction of apoptosis in androgen-refractory human prostate carcinoma DU145 cells were due to the induction of WAF1/p21, alteration in the Bax/Bcl2 ratio in favor of apoptosis, and inhibition of nuclear factor-κB. 20 Treatment of the human esophageal squamous cell carcinoma cell line (KYSE-510) with apigenin caused G2/M arrest through upregulation of p21(waf1) and downregulation of cyclin B1 at the messenger RNA (mRNA) and protein levels and induced p53-independent mitochondrial-mediated apoptosis through upregulation of PIG3 and cleavage of caspase-9 and caspase-3 (CASP3). 15 The ubiquitin-proteasome pathway may also contribute to the cancer preventive effects of apigenin in human leukemia cells. 21 Signal transducer and activator of transcription 1-α in cycloheximide-dependent apoptosis was triggered by tumor necrosis factor-α in the human colorectal COLO 205 cancer cell line. 22 Apigenin provides selective activity to promote caspase-dependent-apoptosis of leukemia cells and uncover an essential role of protein kinase C-δ during the induction of apoptosis as well. 17 Exposure to apigenin led to increases in intracellular free Ca2+ along with calpain activation and mitochondria-mediated pathway in human malignant (N-type) neuroblastoma SH-SY5Y cells. 23 The mechanism by which apigenin causes cell cycle arrest was related to the regulation of cyclin-dependent kinase 1 and p21(Cip1) in human breast cancer SK-BR-3 cells. 24 Notwithstanding these studies, the molecular mechanisms by which apigenin induces apoptosis remain largely unknown.
Caspases, or cysteine-aspartic proteases, are a family of cysteine proteases that are crucial components of cell death pathways. Among the caspases identified, CASP3 (one of the effector caspases) stands out because it is commonly activated by numerous death signals and cleaves a variety of important cellular proteins. Caspase-8 (CASP8) is one of the initiator caspases that cleaves inactive pro-forms of effector caspases, thereby activating them. 25 The mammalian target of rapamycin (mTOR) has emerged as a critical effector in cell-signaling pathways that is commonly deregulated in human cancers. 26 Recently, mTOR signaling was found to be associated with the clinical pathologic measure of human colorectal cancer. 27 Cyclin D1 (CCND1), on the other hand, is a protein in the PI3K/Akt/GSK-3 pathway that regulates the cell cycle. Downregulation of CCND1 was observed in HT29 human colon adenocarcinoma cells after adding to the cells lycopene β-cyclase obtained from tomatoes by modulating carotenogenesis via genetic engineering. 28
Apigenin may play a role in modulating several key elements in cellular signal transduction pathways in cancers. Not much information is available on the apoptotic effects of this flavonoid against colon cancer. To our knowledge, this study provides the first evidence on the effects of treatment with apigenin plus 5-fluorouracil (FU), a clinically important chemotherapeutical agent used to treat colon cancer, on proliferation and apoptosis. It also shows the associated underlying mechanism by examining CASP3, CASP8, mTOR, and CCND1 in the p53 mutant HT29 human colon adenocarcinoma cell line.
Materials and Methods
Cell culture
The HT29 cell line (cell culture collection number 97042201) was obtained from Foot-and-Mouth Disease Institute (Ankara) of Ministry of Agriculture & Rural Affairs of Turkey. HT29 cells express mutant p53 protein. This cell line was cultured in Dulbecco modified eagle media (HyClone, Thermo) supplemented with 2mM L-glutamine, 10% heat-inactivated fetal bovine serum (FBS), 100 U/mL penicillin G, and 100 mg/mL streptomycin (all obtained from HyClone, Thermo) and kept at 37°C in a humidified atmosphere of 5% CO2. The cells were subcultured twice a week. The medium was regularly changed 3 times a week.
Cell treatment and measurement of cytotoxicity and apoptotic activities
XTT-based colorimetric assay
The effects of apigenin alone (Sigma) and apigenin plus 5-FU on the viability of cells were determined by cell proliferation XTT (tetrazolium salt; Roche) assay. Tumor cells were first cultured overnight in a medium containing 1% FBS for fixing cell numbers in each of the 96-well culture plates and were then placed in a medium containing 10% FBS. The cells were seeded as 1×10⁴ cells per well in 200 μL of complete culture medium containing 15, 45, 75, 90, and 100 μM concentrations of apigenin alone and apigenin plus 5-FU and incubated for 24, 48, and 72 hours. Cells treated with 0.1% dimethyl sulfoxide (DMSO) served as a solvent control. Cells treated with 50 μM 5-FU served as a positive control. The same amount (50 μM) of 5-FU was administered together with different doses of apigenin to colon cells throughout the series of experiments. This constant 5-FU concentration was selected because of its effectiveness in anticancer treatments. 29,30 Each concentration of apigenin alone and apigenin plus 5-FU for each incubation period was repeatedly incubated in 4 wells to determine the most efficient doses and incubation periods. Cell viability was determined after incubation for a specified time at 37°C in a humidified incubator. XTT (1 μL activation solution to 50 μL XTT reagent containing phenazine methyl sulfate and XTT) was added to each well and incubated for 4 hours to allow production of XTT formazan. The absorbance values were determined with a microplate enzyme-linked immunosorbent assay (ELISA) reader (Tecan) at a wavelength of 490 nm. The effect of apigenin alone and apigenin plus 5-FU on growth inhibition was assessed as percentage viability, where vehicle-treated (nontreated) cells were considered 100% viable.
Viability, necrosis, and apoptosis detection by fluorescence microscopy
The cells were treated with 15, 45, 75, 90, and 100 μM concentrations of apigenin alone and apigenin plus constant 50 μM 5-FU for 24, 48, and 72 hours. After this treatment, the cells, stained with 3 μL of a mixture of acridine orange/ethidium bromide (AO/EtBr) (Sigma, 100 μg/mL each), were examined by using a fluorescence microscope (Olympus BX-50) with triple filter. AO permeates viable cells and intercalates into the DNA, causing the viable cells to have green nuclei. Structure variations in fluorescence intensity in normal nuclei are due to the relative distribution of euchromatin and heterochromatin. In contrast, apoptotic nuclei have condensed chromatin, which is uniformly stained and takes the form of crescent or numerous featureless bright spherical bodies. Because EtBr stains only the nonviable cells, without penetrating the plasma membrane in viable cells, necrotic cells have orange nuclei. In this study, the cells were classified as viable cells, apoptotic cells, and necrotic cells. We analyzed 1,000 cells for each concentration of apigenin alone and apigenin plus 5-FU in each of the repeated experiments. The percentages of viable, necrotic, and apoptotic cells were then calculated.
Quantitation of DNA synthesis during cell proliferation by colorimetric ELISA with 5-bromo-2′-deoksiuridin
DNA synthesis in proliferating cells was determined by measuring 5-bromo-2′-deoksiuridin (BrdU) incorporation with the commercial cell proliferation ELISA (Roche Molecular Biochemicals). The cells were seeded in 96-well culture plates at a density of 104 cells/well and then incubated in 15, 45, 75, 90, and 100 μM concentrations of apigenin alone and apigenin plus 5-FU for 24, 48, and 72 hours. Medium was then removed and the cells were incubated for 2 hours at 37°C with a BrdU-labeling solution (provided by the kit) containing 10 μM BrdU. The assay was performed according to the manufacturer's instructions. Absorbance values were measured at 450 nm by using a microplate ELISA reader (Tecan). Culture medium alone was used as a control for nonspecific binding.
Lactate dehydrogenase release assay
Lactate dehydrogenase (LDH) is a stable enzyme present in all cell types, and it is rapidly released into the cell culture medium upon damage of the plasma membrane. The activity of this enzyme was measured by using the LDH-cytotoxicity assay kit (Roche Molecular Biochemicals) by conversion of lactate to pyruvate, which then reacts with tetrazolium salt [2-(4-iodophenyl)-3-(4-nitrophenyl)-5-phenyl tetrazolium] to form formazan. The cells were treated with various concentrations of apigenin alone and apigenin plus 5-FU for 24, 48, and 72 hours and incubated for 30 minutes at room temperature in the dark, with a 100 μM reaction solution (provided by the kit) in each well. The assay was performed according to the manufacturer's instructions. Reaction products were quantified by recording the absorbance at 490 nm. Maximal release was obtained after treating control cells with 1% Triton X-100 (provided by the kit) for 10 minutes at room temperature. Culture medium alone was used as a background control.
CASP3 activity at protein level
CASP3 activity was measured by using a colorimetric assay according to the manufacturer's experimental instructions (PathScan Cleaved Caspase-3 [Asp175] Sandwich ELISA, Cell Signaling Technology). The purpose was to detect proapoptotic effects of different doses (15–100 μM) of apigenin alone and apigenin plus 5-FU at specified incubation periods, given that this family of protease plays key effector roles in apoptosis in mammalian cells. Adding the reagent to the wells resulted in cell lysis, followed by caspase cleavage of the substrate and generation of a luminescent signal produced by luciferase, which is proportional to the amount of present endogenous levels of cleaved caspase-3 protein. The CASP3 activity was analyzed by reading the absorbance at 450 nm using a microplate ELISA reader (Tecan).
Cell death detection ELISA
The induction of apoptosis was assessed by using the Cell Death Detection ELISA PLUS kit obtained from Roche Diagnostics. This kit uses a photometric enzyme immunoassay that quantitatively determines the formation of cytoplasmic histone-associated DNA fragments (mono- and oligo-nucleosomes) after apoptotic cell death. For determination of apoptosis by ELISA, HT29 cells were treated with apigenin alone and apigenin plus 5-FU for 24, 48, and 72 hours in 96-well plates. The induction of apoptosis was evaluated by using cytosolic fractions obtained from pooled adherent and floating cells by assessing the enrichment of nucleosomes in the cytoplasm (by using antihistone biotin and anti-DNA peroxidase antibodies). Briefly, the 96-well plates were centrifuged (200 g) for 10 minutes. The supernatant was discharged, lysis buffer was added, and samples were incubated at room temperature for 30 minutes, as described in the manufacturer's protocol. Antihistone biotin and anti-DNA peroxidase antibodies were added to each well and incubated at room temperature for 2 hours. After 3 washes, the peroxidase substrate was added to each well and the plates were read at 405 nm. The enrichment of histone-DNA fragments in treated cells was expressed as fold increases in absorbance as compared with control (vehicle-treated) cells.
DNA fragmentation by agarose gel electrophoresis
HT29 cells were treated with different doses (15–100 μM) of apigenin alone and apigenin plus 5-FU for 24, 48, and 72 hours. DNA fragmentation was analyzed by agarose (Sigma) gel electrophoresis, as described elsewhere. 31 Equal volumes of the samples were loaded onto the 1.5% agarose gel, and electrophoresis was performed at 90 V for 60 minutes. DNA was visualized by using the Gel Logic 100 gel image system (Kodak) after staining with ethidium bromide. A 100 base pair ladder was used as a marker.
RNA extraction and mRNA analyses
Total RNA was isolated from each 6-well plate by using the High Pure RNA Isolation Kit (Roche Diagnostics) according to the manufacturer's instructions. The yield and quality of the RNA of each sample were determined by measuring the absorbance at 260 and 280 nm using the Nanodrop spectrophotometer (NanoDrop ND-1000, Montchanin). Total RNA (1 μg) was reverse-transcribed in a 20-μL reaction mixture using random hexamers and Transcriptor First Strand complementary DNA (cDNA) synthesis kit (Roche Diagnostics) according to the manufacturer's instructions.
CASP3, CASP8, mTOR, and CCND1 mRNA expression levels were measured by using a real-time polymerase chain reaction (PCR) method. Probes and primer sets for each gene were designed at the ProbeFinder Assay Design Center website (
Statistical analysis
Each test point was measured in quadruplicate in 3 individual experiments. Statistical significance levels of differences in mRNA expressions were analyzed by using the pairwise fixed reallocation randomization test. The REST software tool, 2008 version (2.07), 32 was used for groupwise comparison and statistical analysis of relative expression results. Cell viability, alterations in apoptosis, and necrosis were analyzed by using the one-way analysis of variance. Multiple comparison analysis was performed by using SPSS software, version 15.0 (SPSS, Inc.). A P value less than .05 was considered to represent a statistically significant difference. The results are expressed as the mean±standard deviation.
Results
Apigenin induces apoptosis and cell proliferation inhibition in HT29 cells
The XTT, AO/EtBr, ELISA-BrdU, LDH release, cell death detection ELISA, and DNA fragmentation assays demonstrated that apigenin (15–100 μM) treatment resulted in dose- and time-dependent inhibition of HT29 cell growth compared with untreated controls. In the highest concentration of apigenin (100 μM), cell viability was found to be 71.67%, 64.44%, and 56.42% for 24, 48, and 72 hours, respectively (Fig. 1A). This effect was more pronounced at post-treatment with apigenin plus 5-FU (Fig. 1B). Percentages of viability were found to be 54.27%, 53.54%, and 49.62% for 24, 48, and 72 hours, respectively, with the 100-μM apigenin plus 5-FU combination. Cell viability percentages for 50 μM 5-FU (positive control) were 85.93%, 76.69%, and 77.63% for 24, 48, and 72 hours, respectively. In other words, apigenin enhanced the antiproliferative effect of 5-FU.

Effect of apigenin alone (
The inhibition of cell viability could result from the induction of apoptosis or necrosis. Therefore, the cells were stained by AO/EtBr to determine whether they are apoptotic or necrotic. The rate of viability significantly decreased in cells treated with 15, 45, 75, 90, and 100 μM concentrations of apigenin alone and apigenin plus 5-FU (Fig. 2). As time of exposure to apigenin alone and apigenin plus 5-FU increased, viability rates decreased, in contrast to necrosis rates. Furthermore, we found dose- and time-dependent changes in apoptosis rates. When HT29 cells in culture were treated with 75 and 90 μM concentrations of apigenin alone and apigenin plus 5-FU for 72 hours (Fig. 2C and 2C′), the growth of cells was significantly inhibited because of apoptosis (P≤.001). Moreover, the rate of apoptosis decreased in cells treated with the highest concentration (100 μM) of apigenin alone and of apigenin plus 5-FU for 72 hours (the most efficient incubation period for apoptosis) when compared with the apoptosis rates of cells treated with 75 and 90 μM. In this way, the most profound effect of apoptosis was observed at 72 hours when cells were treated with 90 μM apigenin, yielding a relatively higher apoptosis than was seen with 75 μM. Treatment with apigenin alone for 72-hour incubation at a 90 μM dose resulted in a 24.92% apoptotic rate (P=.001), whereas a higher rate (29.13%) was observed after treatment with the same dose of apigenin plus 5-FU for the same incubation period (P=.001) (Fig. 3).
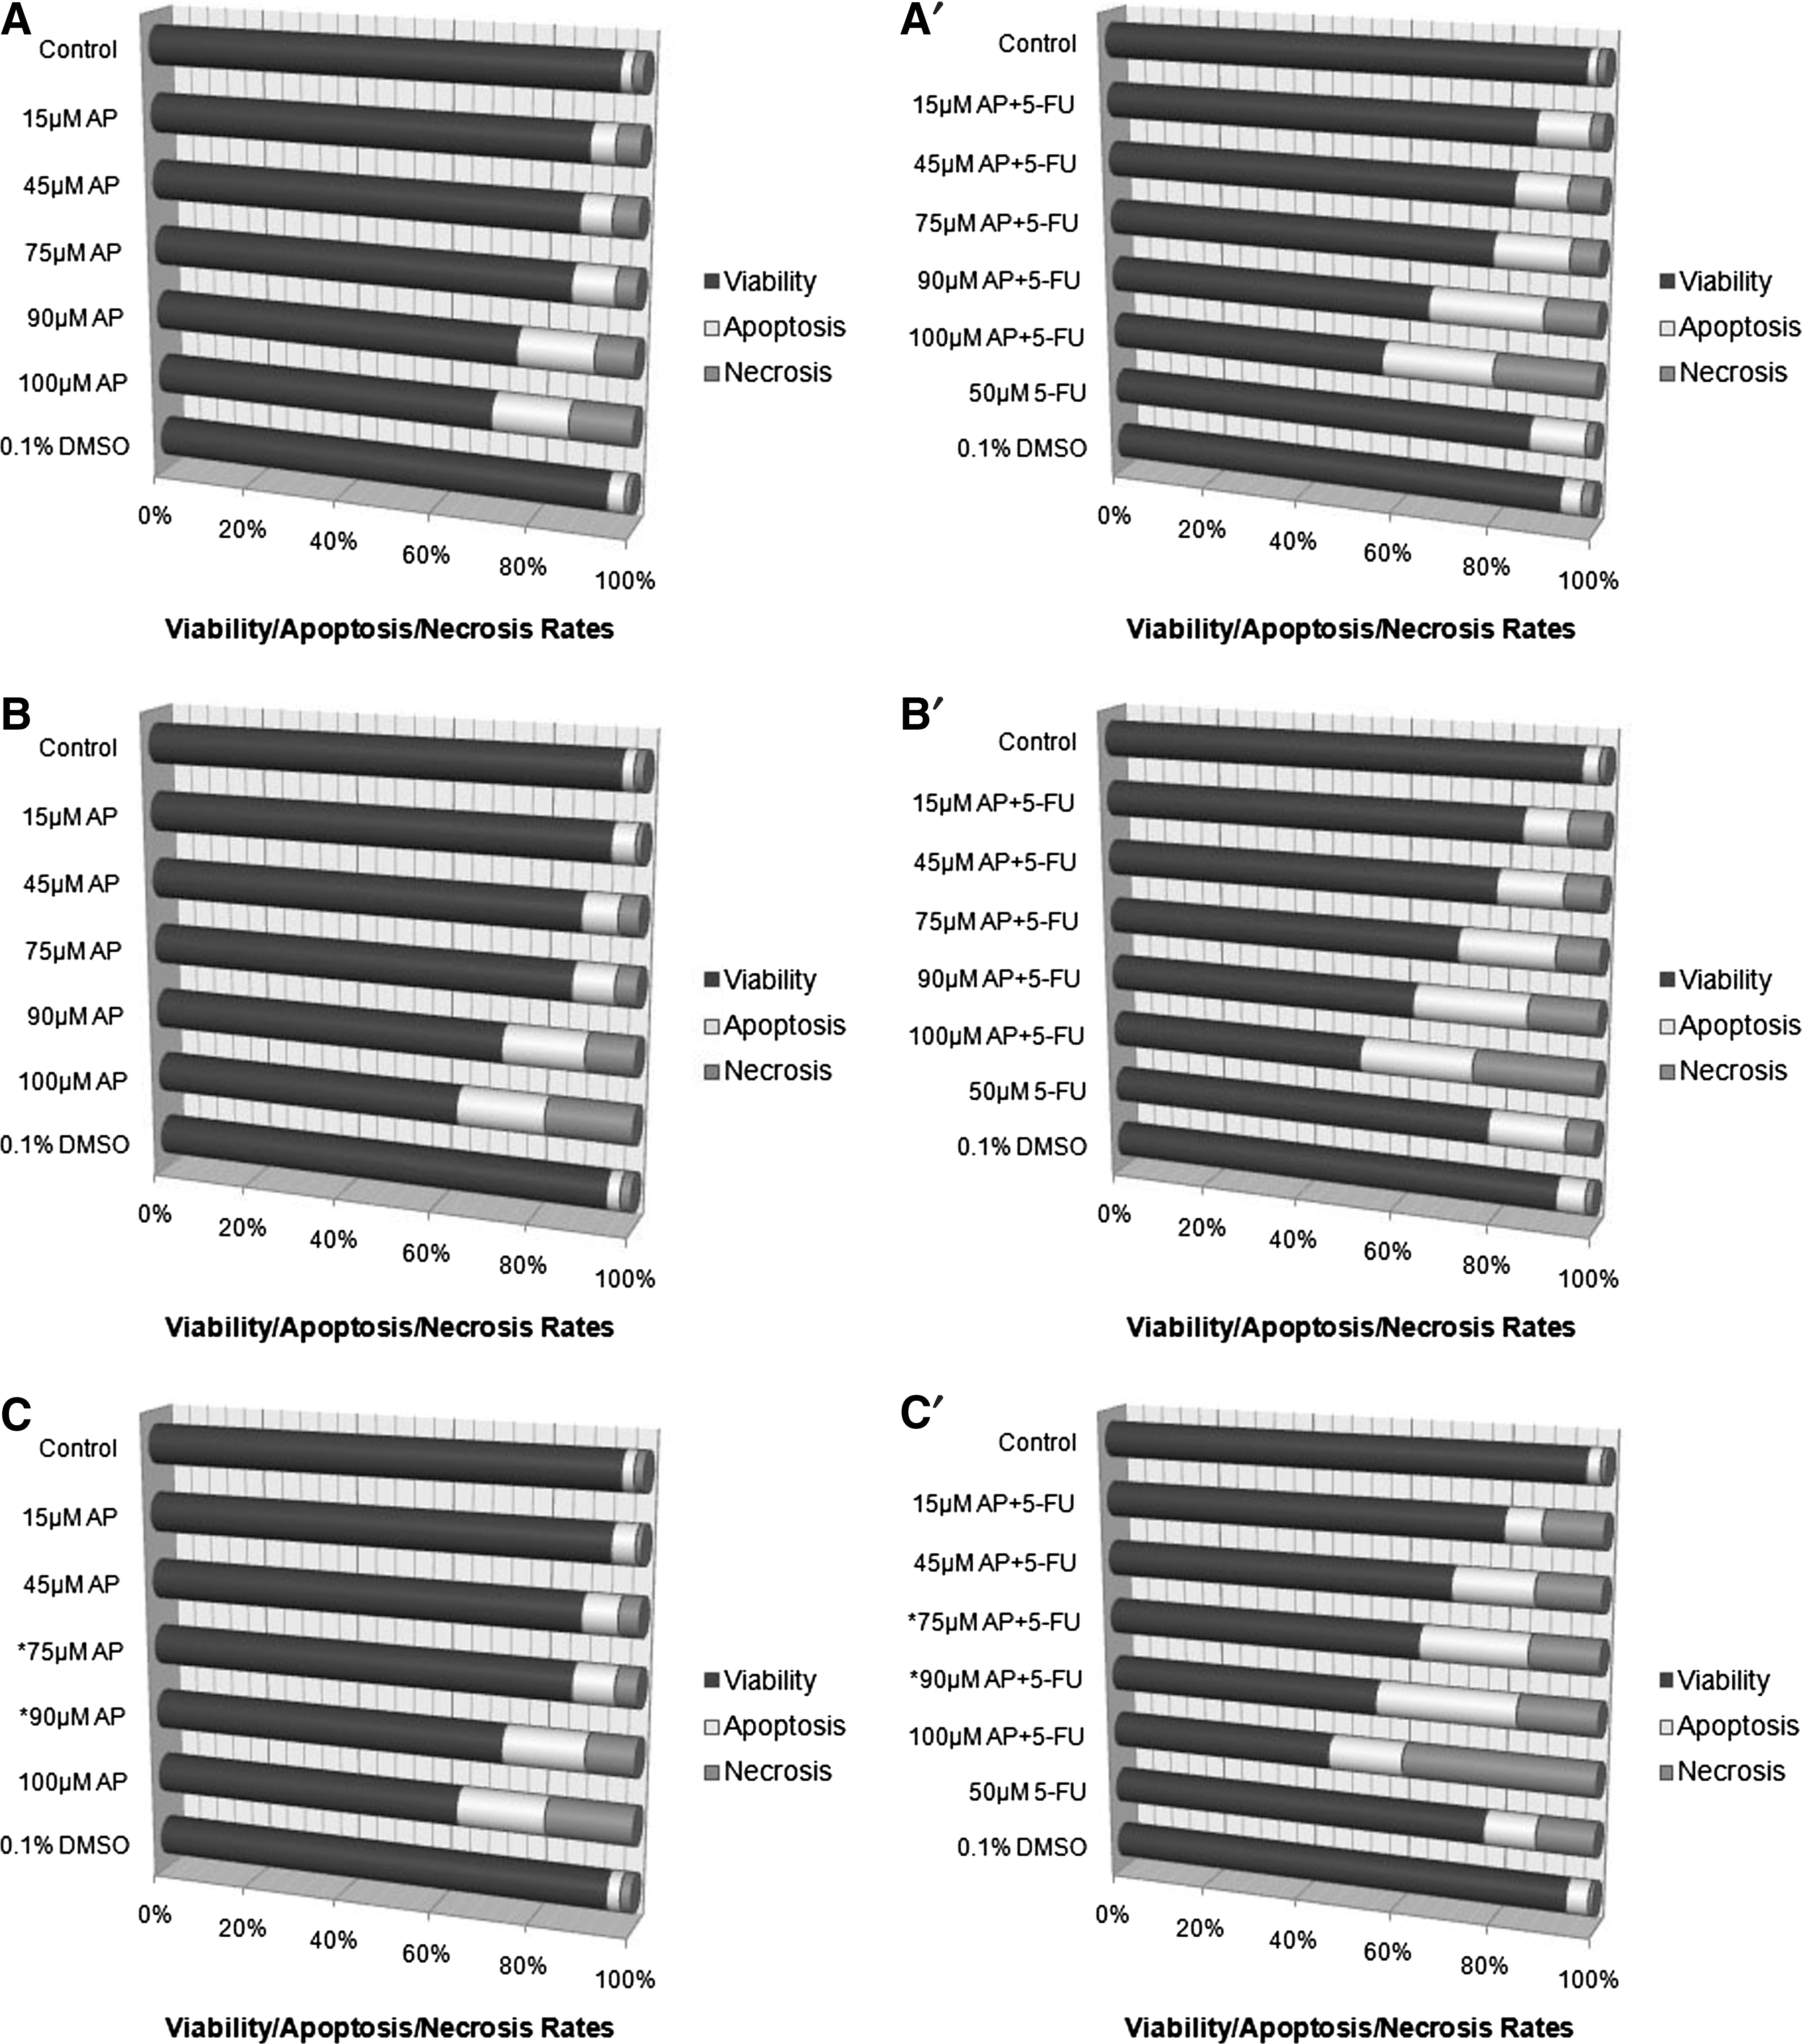
Viability, apoptosis, and necrosis rates of HT29 cells treated with apigenin alone (
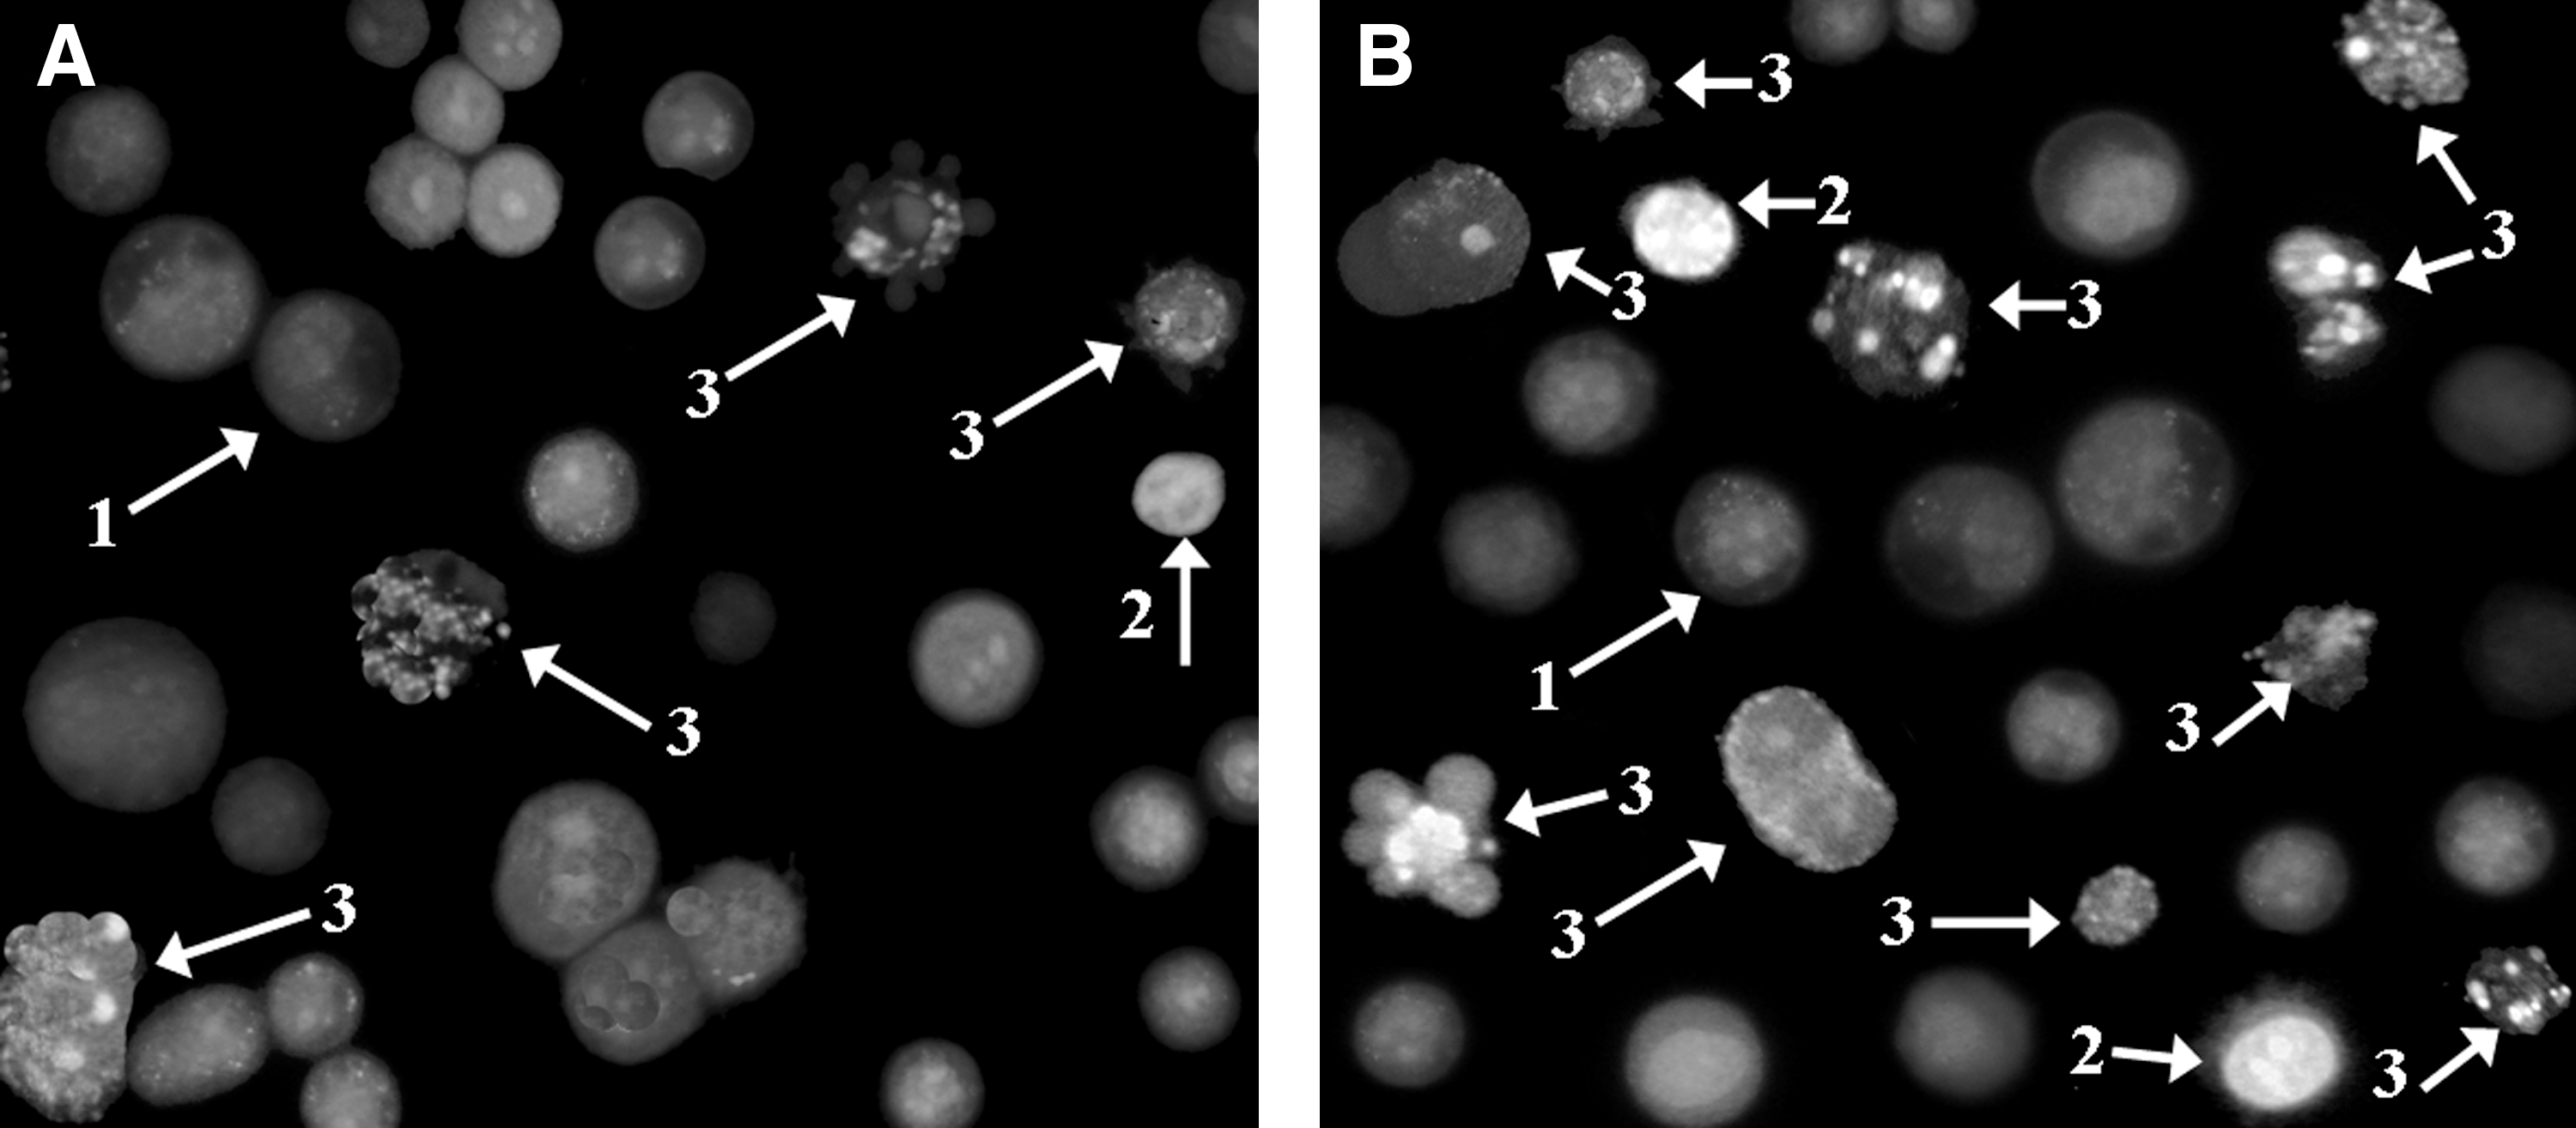
Morphologic detection of apoptosis of HT29 cells treated with 90 μM apigenin alone (
These results were confirmed by agarose gel electrophoresis of DNA extracted from the cells (Fig. 4). High degree of fragmentation at 72 hours confirmed the high apoptosis rates at 90 μM. For apigenin alone and apigenin plus 5-FU, 75 μM and 90 μM have been identified as the most effective doses in inducing apoptosis. This fragmentation result was supported by the decrease in the cell proliferation rate as revealed by the ELISA BrdU assay (data not shown).
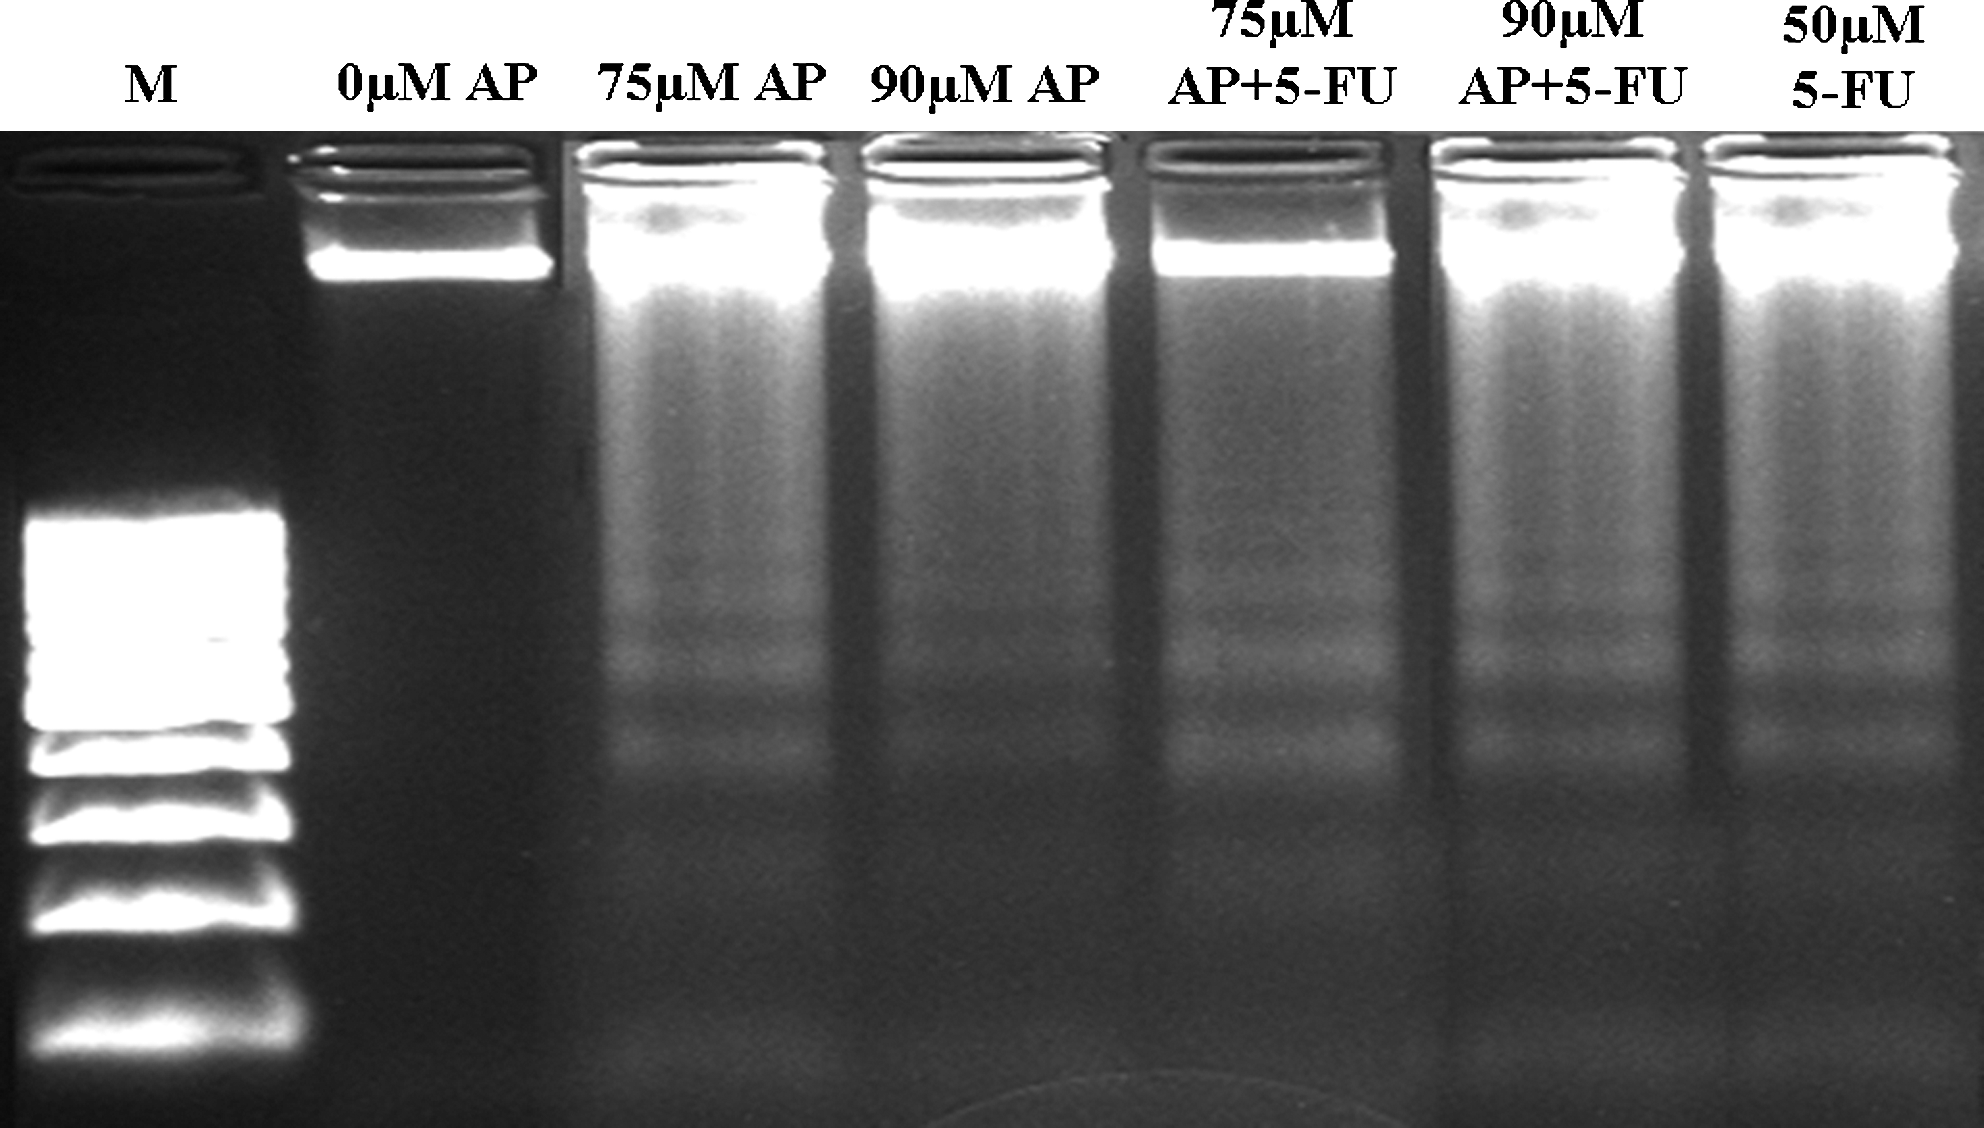
DNA fragmentation of HT29 cells treated with 75 μM and 90 μM apigenin alone and apigenin plus 5-FU for 72 hours in 1.5% agarose gel. M, 100 base ladder DNA marker; 0 μM, negative control; 50 μM 5-FU, positive control.
In the next phase of the experiment, performance of LDH showed that the use of apigenin plus 5-FU resulted in an increased cytotoxic effect; in contrast, the use of apigenin alone did not significantly increase cytotoxicity (data not shown). There were significantly time-dependent increases at protein expression levels of CASP3 activity after treatment with 75 μM and 90 μM apigenin alone and apigenin plus 5-FU for 48 and 72 hours (P<.05) (Fig. 5), whereas no such increase was observed after treatment for 24 hours. These results suggested that CASP3 appeared to play a role in the stimulation of apoptotic pathway. The integrity of genomic DNA was examined to characterize cell death induced by apigenin alone and by apigenin plus 5-FU. DNA fragmentation rate significantly increased after treatment with 90 μM apigenin alone and 75 μM and 90 μM apigenin plus 5-FU for 72 hours when compared with controls (P<.05) (Fig. 6). Use of 90 μM apigenin plus 5-FU for 48 hours also resulted in a statistically significant increase in DNA fragmentation rate. Analysis of DNA integrity by DNA ladder mode showed that treatment of HT29 cells with 75 and 90 μM apigenin alone and apigenin plus 5-FU expressed dose- and time-dependent apoptosis (Fig. 4).
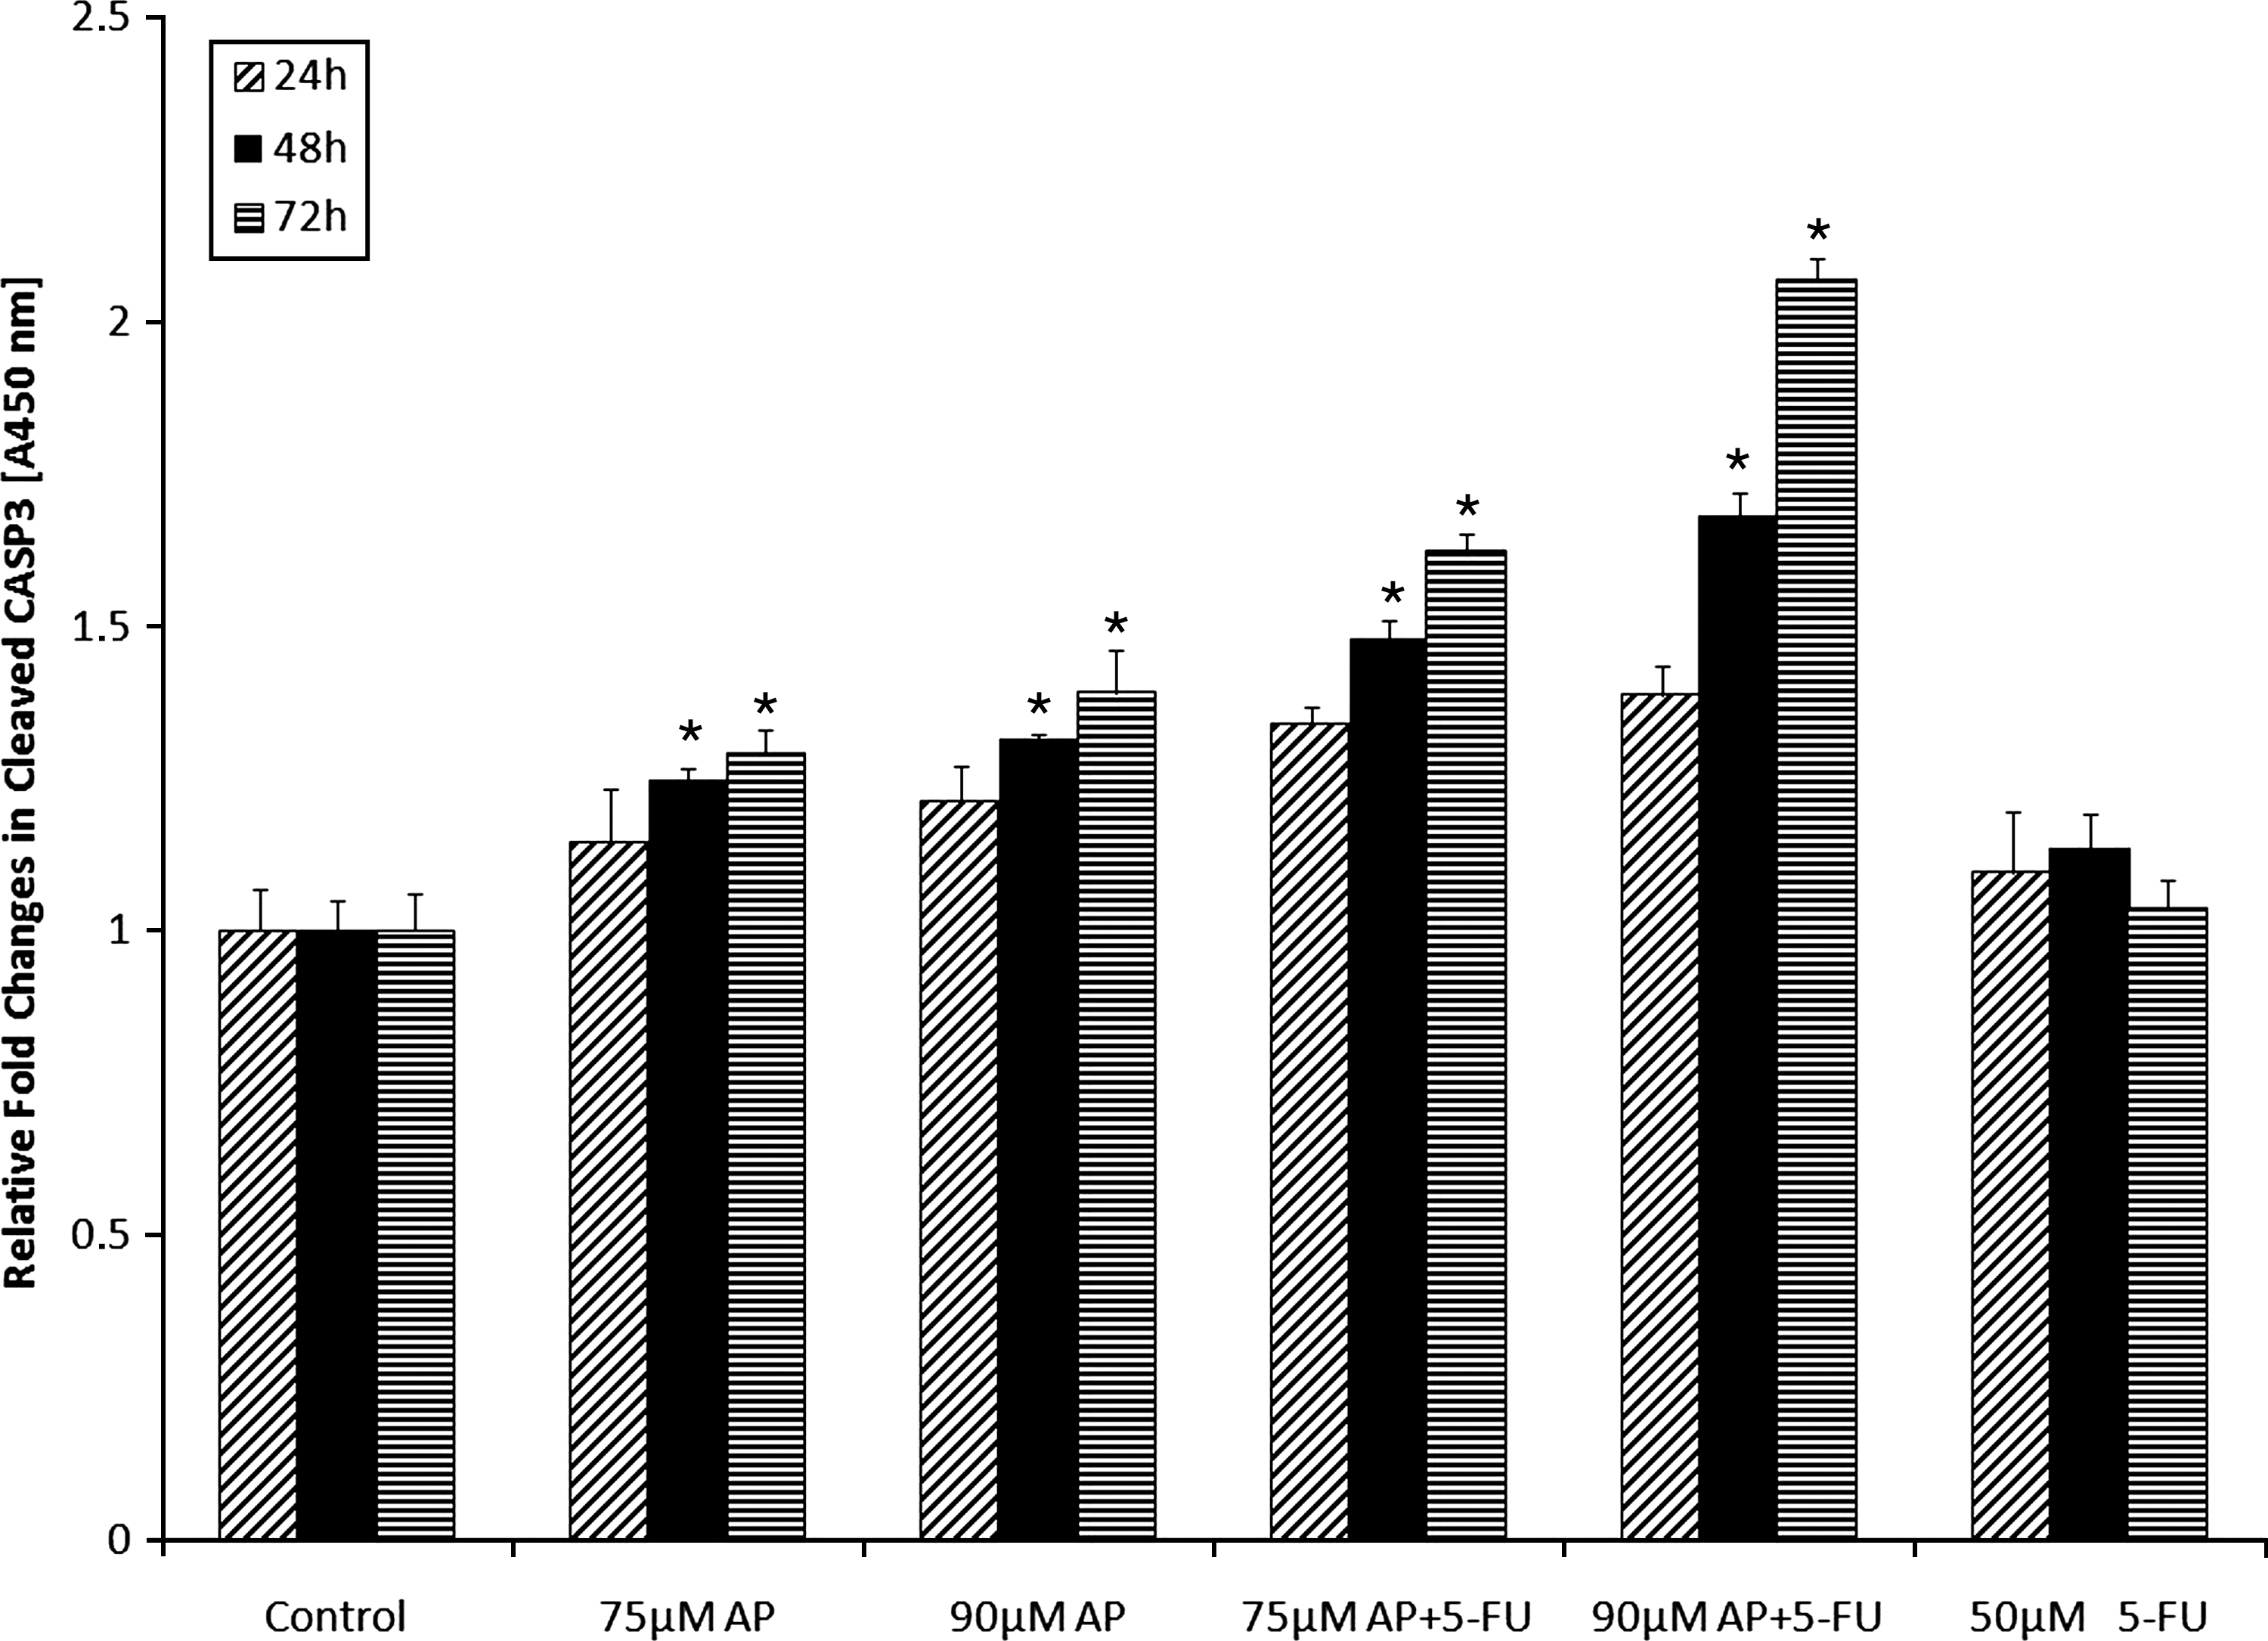
Effect of apigenin alone and apigenin plus 5-FU on the activity of caspase-3 in HT29 cells. The cells were treated with 50μM 5-FU as a positive control and 75 μM and 90 μM of apigenin (effective concentrations of apigenin to induce apoptosis) for 24, 48, and 72 hours. The data are expressed as the mean±standard deviation of 3 experiments, each conducted in quadruplicate. The asterisks indicate that values were significantly different from the controls (negative and positive) and other concentrations with different doses and incubation periods (P<.05).
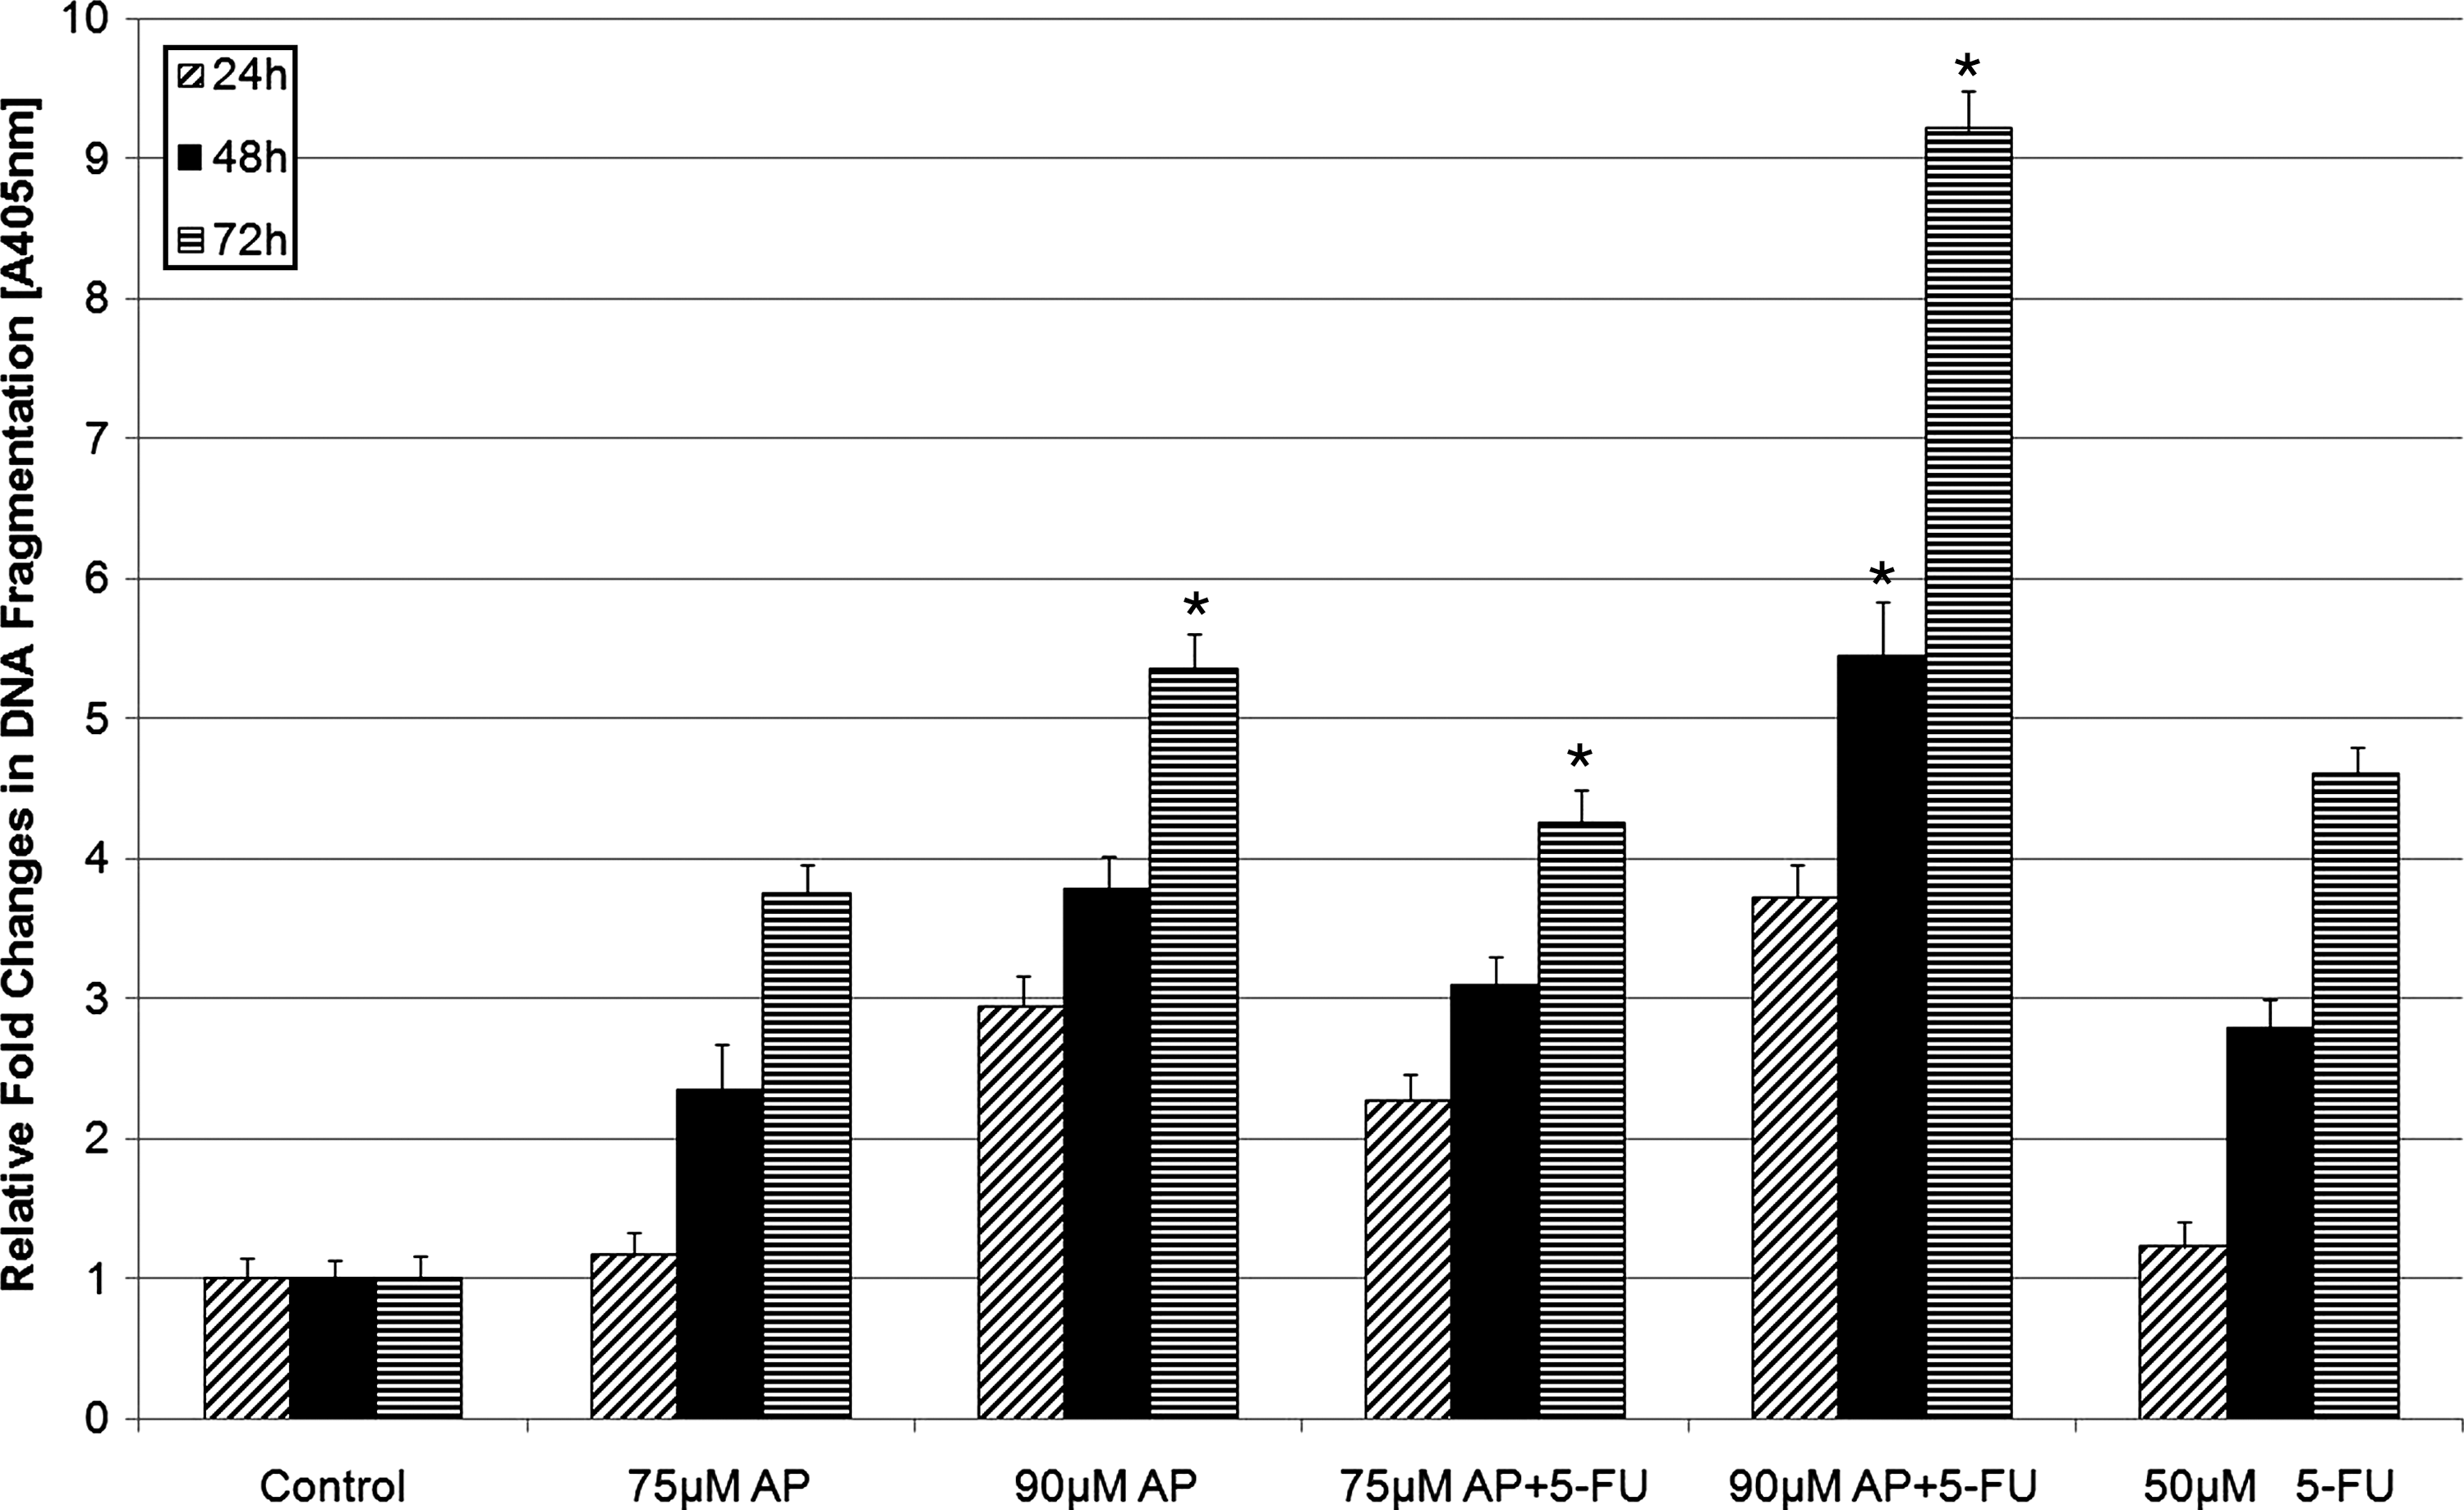
DNA fragmentation induced by apigenin alone and apigenin plus 5-FU in HT29 cells. The cells were treated with the effective concentrations of apigenin to induce apoptosis for 24, 48, and 72 hours. The cells were treated with 50μM 5-FU as a positive control. The data are expressed as the mean±standard deviation of 3 experiments, each conducted in quadruplicate. The asterisks indicate that values were significantly different from the controls (negative and positive) and other concentrations with different doses and incubation periods (P<.05).
Apigenin increases CASP3 and CASP8 mRNA expression but decreases mTOR and CCND1 mRNA expression in HT29 cells
Alterations of gene expression in HT29 cells treated with apigenin alone and apigenin plus 5-FU at the mRNA level were verified for all 4 selected genes. The results for these genes agreed with the results of the apoptosis and cell proliferation inhibition analysis. Apoptosis results were confirmed as increased mRNA expression levels of CASP3 (late apoptosis, effector) and CASP8 (early apoptosis, initiator) compared with the control groups (Fig. 7). After treatment with only apigenin for 48 hours, no statistically significant difference was seen in the mRNA expression levels of the genes between untreated controls and treated groups (Fig. 7A). As shown in Figure 7B, use of 90 μM apigenin alone resulted in an increase in CASP3 and CASP8 but a decrease in mTOR and CCDN1. The results indicated that CASP3 and CASP8 levels increased after treatment with 90 μM apigenin plus 5-FU for 48 hours (P<.05) (Fig. 7A′). This effect was more pronounced for 72-hour treatment (P<.05) (Fig. 7B′). Briefly, lower dose of apigenin (75 μM) plus 5-FU was sufficient to increase CASP3 and CASP8 expression levels. In addition, for 75 μM and 90 μM apigenin plus 5-FU for 72 hours, mRNA expression levels of mTOR and CCND1 decreased in comparison with the control groups (P<.05) (Fig. 7B′). Apigenin increased the effect of the constant dose of 5-FU. Treatment with 90 μM apigenin plus 5-FU resulted in an increase in CASP3 (2.567-fold) and CASP8 (3.689-fold) at 72 hours. This increase was greater (2.455-fold for CASP3 and 2.108-fold for CASP8) than the increase observed after treatment with the same dose of apigenin plus 5-FU combination at 48 hours. The results suggested that apigenin dose and time-dependently regulated the expression of some genes involved in cell growth, cell cycle progression, and apoptosis at the mRNA level.

Relative messenger RNA expression levels of CASP3, CASP8, mTOR, and CCND1. Bars represent the messenger RNA expressions of these 4 genes normalized to GAPDH and relative to control groups (DMSO, solvent control; 50 μM 5-FU, positive control;
At the end of the 24-hour incubation period, the most effective concentration of apigenin alone (90 μM) to induce apoptosis revealed the highest levels of CASP3 (1.265-fold increase) and CASP8 (1.121-fold increase) as well as the lowest levels of mTOR (1.273-fold decrease) and CCND1 (1.342-fold decrease); the findings were not statistically significant because of the short incubation period. The incubation of same amount of apigenin plus 5-FU combination for the same period again revealed statistically insignificant levels of CASP3 (1.766-fold increase), CASP8 (1.452-fold increase), mTOR (1.47-fold decrease), and CCND1 (1-fold decrease) (data not shown). We did not display the mRNA-level alterations in the genes for the highest concentration of apigenin (100 μM) because lower cell viability and higher necrosis in this dose would have led to misleading results.
Discussion
In the present study, we observed that administration of apigenin alone and apigenin plus 5-FU combination had a significant dose and time-dependent inhibitory effect on the proliferation of HT29 cell line. The cells were stained to reveal whether the molecular mechanism underlying the decrease in cell viability stemmed from apoptosis or necrosis. The most effective apigenin dose and incubation period were 90 μM and 72 hours for inducing apoptosis in the cells. Apigenin plus 5-FU inhibited colon cancer cell proliferation more effectively than either agent did alone. However, administration of a constant dose of 5-FU only for different incubation periods resulted in approximately 20% loss in cell viability. Fluorescence microscopy analysis indicated that this loss resulted from the high cytotoxicity of 5-FU, which led the cells toward necrosis rather than apoptosis. Apigenin, on the other hand, has low cytotoxicity, as also suggested by our findings. 27,33 –37 BrdU ELISA assay confirmed the most effective apigenin dose (90 μM) and incubation period (72 hours).
Our results are in line with those of other studies that showed the apoptotic effects of 5-FU in HT29 cells. 38 –42 Some studies showed that apigenin, when used together with agents other than 5-FU, had greater apoptotic effects than when it was used alone. 43,44 Although many flavonoid members with apoptotic effects on the HT29 cell line have been studied, 45 –49 the number of those tackling apigenin administration to HT29 cells remains limited. 48 –55 Four of these studies evaluated the effect of apigenin on cell viability. Treatment with 40μM apigenin for 24 hours; 49 60 μM and 80μM apigenin for 48 hours; 43 40 μM, 60 μM, and 80 μM apigenin for 48 hours; 54 and 130.6.μM apigenin for 72 hours 55 all resulted in statistically significant reductions in cell viability. Other studies explored apigenin's kinase activity 52 and cyclooxygenase-2 (COX-2) activity. 51
The variations in the dose and incubation periods between our study and others stemmed from factors such as inclusion of tumor necrosis factor-α alongside apigenin, 49 different number of cultured cells, laboratory conditions, 54,55 involvement of different HT29 cell line subtypes, 50 and different molecular mechanisms used to induce apoptosis. Our findings suggesting that the cells are directed toward apoptosis upon administration of apigenin alone and of apigenin plus 5-FU were verified by cell death detection ELISA and DNA fragmentation. Detection of a DNA fragmentation after treatment with 75 μM and 90 μM apigenin plus 5-FU led us to believe that cell death resulted from apoptosis. Cancer cells, unlike their normal counterparts, use anaerobic glycolysis for energy because of their hypoxic conditions. Therefore, in cytoplasm of cancer cells, the amount of lactate dehydrogenase enzyme increases; this catalyzes the conversion of pyruvate to lactate as the last step of anaerobic glycolysis. In our study, after treatment of the colon cells with effective apigenin doses (75 μM and 90 μM), no statistically significant cytotoxicity was observed because of similar LDH activity levels in controls and treated cells. On the other hand, after treatment with the same doses of apigenin with 5-FU, cytotoxicity effects increased significantly (data not shown). This cytotoxicity occurs in response to apoptosis or necrosis. However, relative fold changes in DNA fragmentation levels and fragmentation of DNA into 100–base pair fragments suggest that the HT29 cell death results from apoptosis.
CASP3 is one of the principle caspases found in apoptotic cells. 56 In this study, after treatment with 75 μM and 90 μM apigenin plus 5-FU for 72 hours and 90 μM apigenin plus 5-FU for 48 hours, we found a significant increase in the activity of CASP3 at protein level (P<.05) in HT29 cells. This increase, which is an important indicator verifying cell death, showed that the HT29 cells (which are known to be p53 mutant) might follow p53 independent pathway for apoptosis. Therefore, cell death indeed resulted from caspase cascade. Furthermore, CASP3 and CASP8 expressions at the mRNA level were investigated to determine the effectiveness of apigenin via caspase cascade-mediated pathway in HT29 cells. For both CASP3 and CASP8, the increase in the mRNA expression levels compared with controls was statistically significant (P<.05). We could not compare our results with those of other studies because no other studies assessed mRNA expression levels of CASP3 and CASP8 after apigenin administration in HT29 cells.
Our findings were, however, consistent with those of other studies that explored different cell lines. Investigators who reported statistically significant increases in the activities of CASP3, CASP8, or CASP9 after apigenin treatment include Choi et al. 25,57 (MDA-MB-453 human breast cancer cells), Das et al. 23 (SH-SY5Y neuroblastoma cells), and Vargo et al. 17 (THP-1, U937, HL60, Jurkat, K562, and NIH3T3 leukemia cells). Other studies investigating the effects of apigenin on caspase cascade 8,58,59 support our mRNA findings.
Finally, we observed a decrease in the mRNA expression levels of mTOR and CCND1 genes after apigenin treatment. Because CCND1 regulates the cell cycle and mTOR regulates the translation factors (S6K, 4E-BP1), we conclude that apigenin is also effective in cell cycle and proliferation. Although we did not identify any studies on the effects of apigenin on the mRNA expression levels of CCND1 and mTOR in HT29 cells, we did examine the findings of Shukla et al., 11,20,60 who reported a reduction in the mRNA expression level of CCND1 after dose-dependent apigenin treatment in LNCaP, 22Rv1, and PC-3 human prostate cancer cells, and Lepley et al., 61 who investigated CRL2097 human fibroblast cells. The results of other studies on the effects of apigenin on CCND1 20, 62 –64 parallel our findings.
We believe our study is the first to show on morphologic, DNA, RNA (mRNA), and protein levels that the most effective dose of apigenin to induce apoptosis in HT29 human colon cancer cells is 90 μM at 72 hours. It further shows that the effectiveness of apigenin increases when it is used with 5-FU. In addition, we found that CASP3 and CASP8 are upregulated by apigenin, that mTOR and CCND1 are downregulated by apigenin. These findings, along with the fact that we used p53 mutant HT29, show that apigenin induces the p53-independent caspase cascade for apoptosis. The decline in the transcriptional expression level of the mTOR gene, which has a function in autophagy, confirms that colon cancer cells are directed toward apoptosis. Our results suggest that administration of apigenin together with chemotherapeutic agents such as 5-FU reduce the effective dose and time necessary for the cancer cells to move toward apoptosis and mitigate the cytotoxic effect on cells and the microenvironment surrounding them.
Conclusion
Our findings indicate that apigenin, owing to its capabilities to induce apoptosis in colon cancer and intervene in multidirectional molecular targets in the treatment process, may become a candidate for an effective therapeutic agent, especially when combined with other low-dose chemotherapeutic agents. Therefore, further in vivo and in vitro molecular studies would help identify the appropriate application conditions and doses of apigenin in the treatment process.
Footnotes
Acknowledgment
This study was supported by the Gazi University Research Fund (project code number 01/2008-13).
Author Disclosure Statement
No authors report any conflicts of interest. In addition, no competing financial interests exist.