
Abstract
Rosmarinic acid (RA) is an important antioxidant polyphenol that is found in a variety of spices and herbs, including Ocimum canum Sims (locally called eme or akokobesa in Ghana). Aqueous extracts from the leaves of O. canum are used as an antidiabetic herbal medicine in Ghana. Analytical thin-layer chromatography was used to examine the composition of the polyphenols in leaf extracts. The polyphenol content in the aqueous and methanol extracts from the leaf, as determined by the Folin–Ciocalteu method, were 314 and 315 mg gallic acid equivalent/g leaf sample, respectively. The total flavonoid concentration as determined by the aluminum(III) chloride method was 135 mg catechin equivalent/g leaf sample. High-performance liquid chromatography coupled to an electrospray Quadrupole time-of-flight mass spectrometer was also used to determine the polyphenol fingerprint profile in the leaf extracts of O. canum. Although the average RA concentration in the O. canum leaf extracts from Ghana was 1.69 mg/g dry weight (reported values range from 0.01 to 99.62 mg/g dry weight), this polyphenol was still a prominent peak in addition to caffeic acid derivatives.
Introduction
R
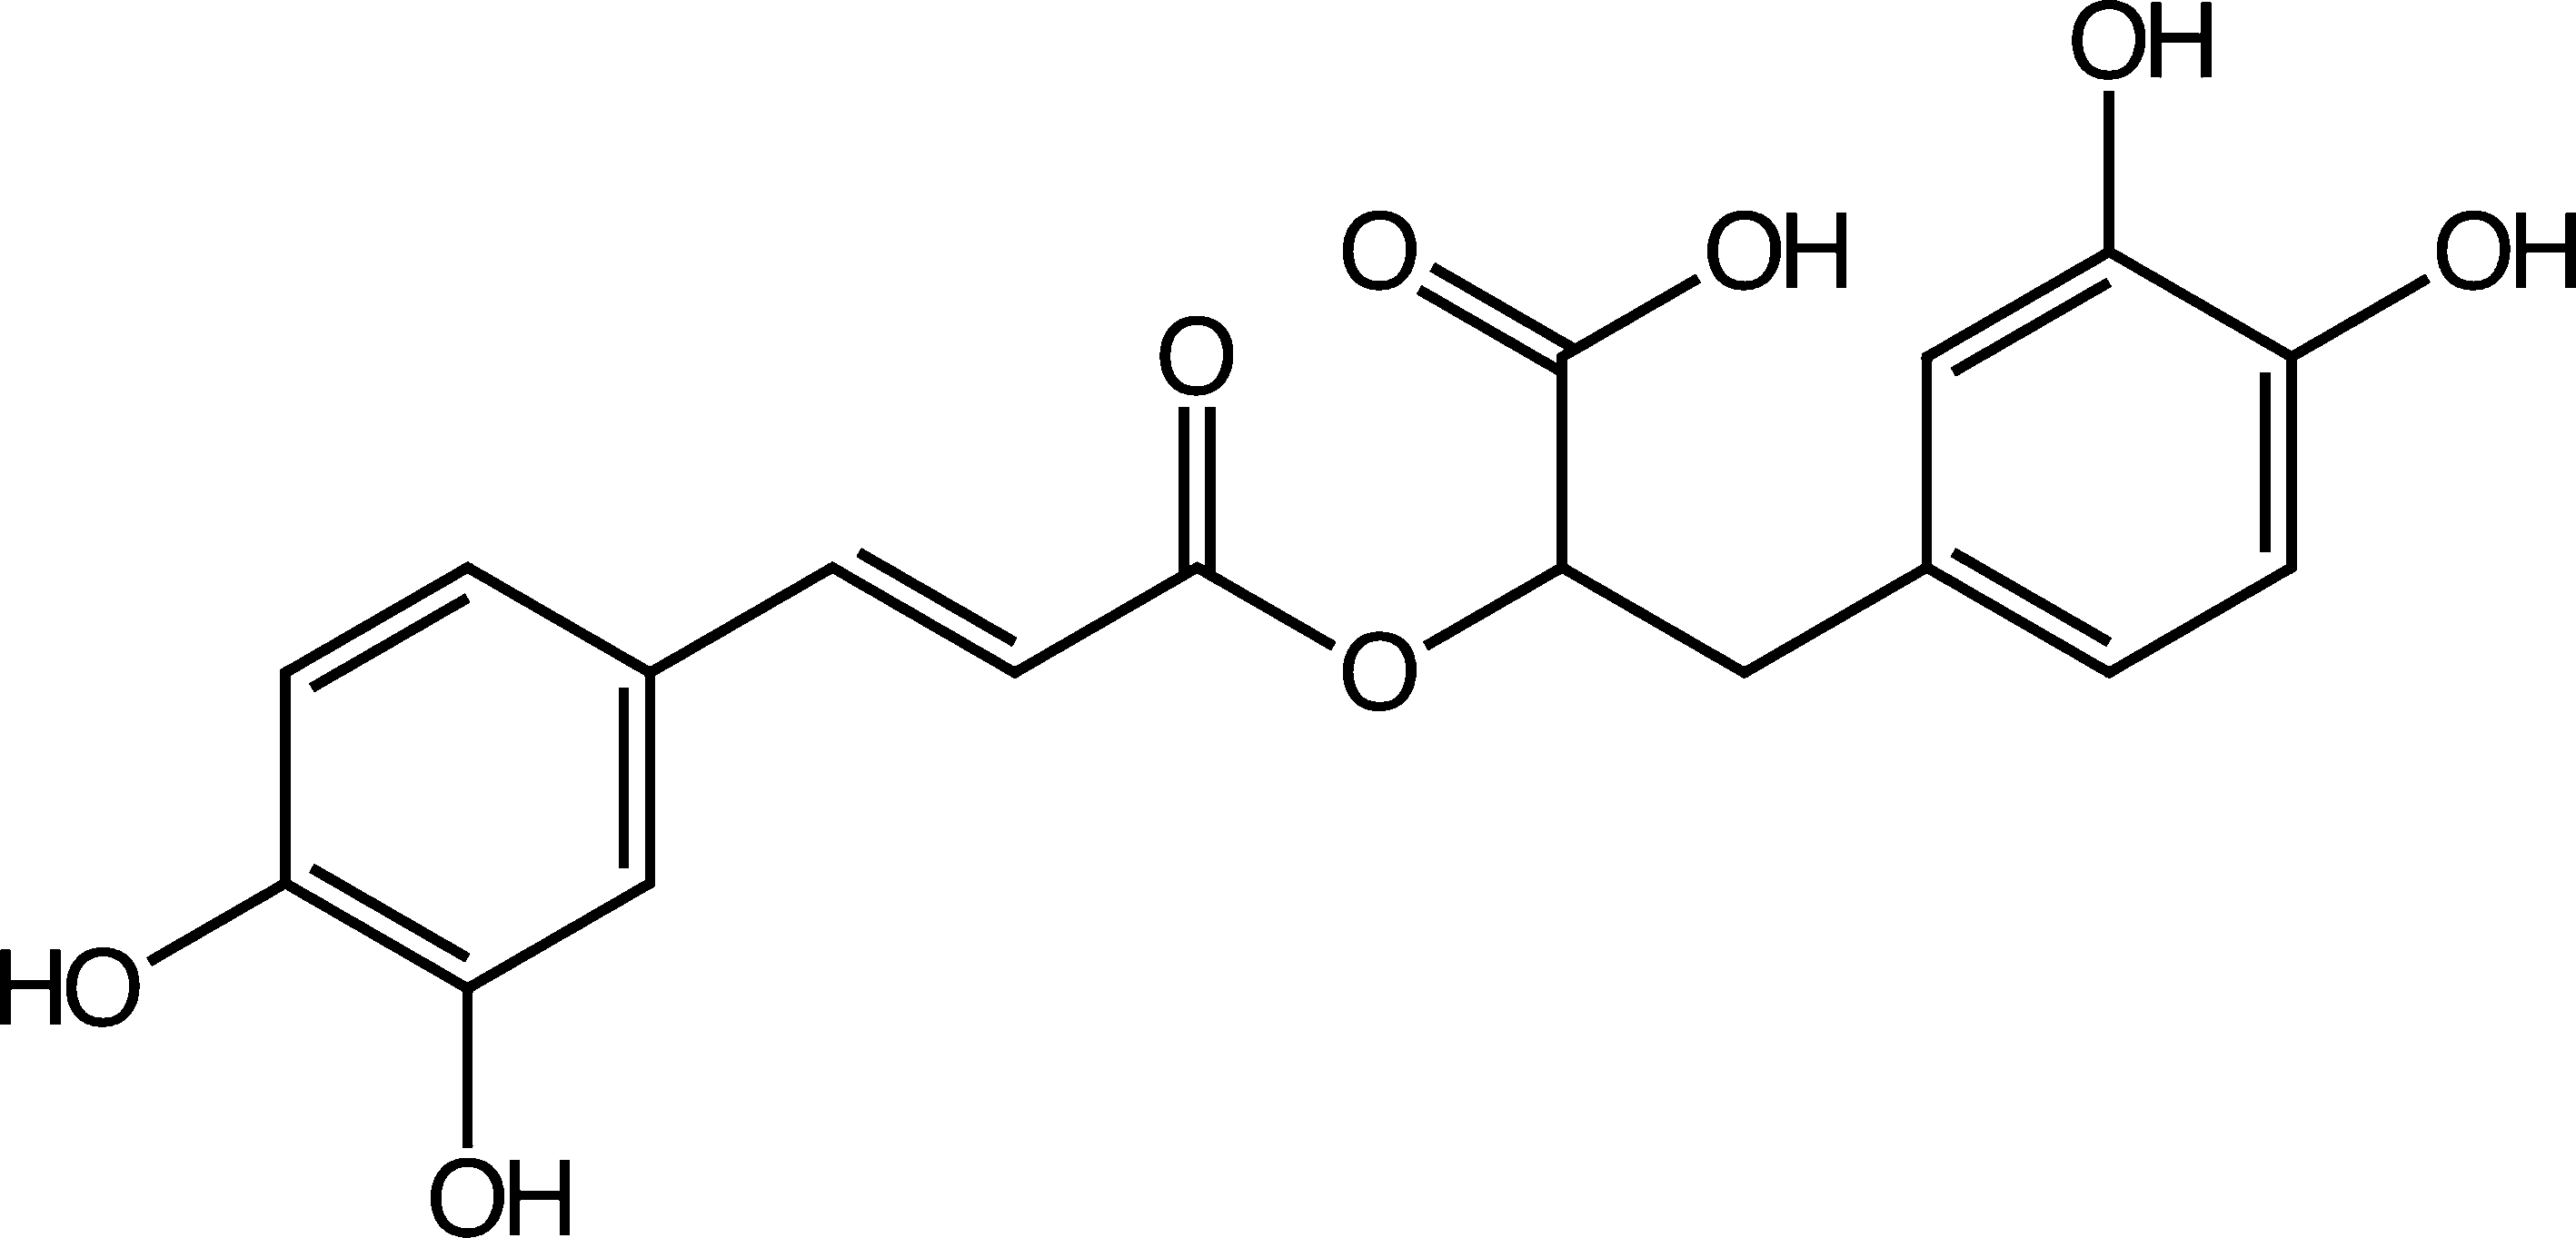
Chemical structure of rosmarinic acid (RA). (2R)-3-(3,4-dihydroxyphenyl)-2-[(2E)-3-(3,4-dihydroxyphenyl)prop-2-enoyloxy]propanoic acid.
Methodology
Chemicals and reagents
All chemicals used were of analytical and American Chemical Standard grade. Methanol, ethanol, ethyl acetate, hexane, chloroform, aluminum chloride, sodium hydroxide, catechin, 3-methylcatechol, ethyl ester of procatechuic acid as well as 3-methoxy cinnamic, 3,4-dihydroxy cinnamic acid, 3,5-dimethoxy-4-hydroxyl cinnamic, 4-methoxy cinnamic acid predominantly trans, p-coumaric acid, trans cinnamic acid, o-coumeric acid, ferulic acid, chlorogenic acid, gallic acid, vanillic acid, syringic acid, homogentisic acid, and RAs were purchased from Sigma Aldrich. Whatman number 4 filter paper was from Aldrich Chemical. The lyophilize machine consisted of a Heto Power Dryer LL3000 (Allerod) and Javal Vacuum Pump DD150 (Sussex). The rotavap was obtained from Sussex. The UV spectrophotometer was from Shimadzu.
Study location and experimental design
Fresh leaves from the O. canum herb were collected during the rainy season from a site previously used by Nyarko et al. 8,9 in Ghana in 2010. The sampling site was at the University Hospital, Legon, Accra, Ghana is situated at a latitude of 5.65°39′9.6″ N and a longitude of 0.18°10′31″ W. The leaves were collected from three separate plants that were within a perimeter of 5 m×5 m, kept in polyethylene bags, and sent to the Ghana Atomic Energy Commission, Accra, Ghana. The humidity and temperature at the time of leaves collection were carefully controlled. A voucher herbarium specimen of O. canum has been deposited at the Botany Department of the University of Ghana.
Sample preparation and extract
About 232 g of fresh leaves of O. canum were washed twice in double-distilled water. Either the washed leaves were dried in an oven or a similar weight was transferred into a 5-L round-bottom flask and boiled in double-distilled water under reflux for 50 min. The aqueous extract was freeze dried (2 L of crude extract generated 0.61 g of freeze-dried product) and stored at 4°C.
Organic extraction
Five lots of ∼1 g crude freeze-dried plant aqueous extract were extracted with 10.0 mL of methanol, hexane, ethyl acetate, ethanol, and hexane, respectively. The extraction was allowed to proceed for 2 h in a homogenizer at 170 g. The organic extracts were filtered through a Whatman number 4 filter paper by gravity flow. The extracts were dried in a rotavap at 40°C, and yield was determined. Dried organic extract was dissolved in their individual organic solvents to achieve a concentration of 40 mg/mL and maintained at 4°C until use for thin-layer chromatography.
Polyphenol profiling by HPLC-DAD
A method by Berhow et al., 30 Marston and Hostettmann, 31 and Sakakibara et al., 32 previously used to determine the polyphenol profile and to quantify RA in mint plants and cultured plants, was used in this O. canum analysis. Briefly, leaves were dried in an oven, and samples were ground to fine powder with a mortar and pestle, sieved through number 30 mesh sieves to remove un-ground stem elements. For single-step extraction analysis, samples (typically 0.25 g) were placed in a one-dram vial, and 2 mL of methanol was added. The vials were capped and wrapped with sealing tape, sonicated for 15 min at room temperature, and allowed to stand at room temperature overnight. An aliquot was removed from the vial and filtered through a 0.45 μm nylon 66 filter for HPLC analysis. Samples were run on a stand-alone Shimadzu 10A HPLC system (SCL-10A system controller, two LC-10A pumps, CTO-10A column oven, and SIL-10A auto injector). Peaks were monitored using a Hewlett-Packard 1040A photodiode array detector running under the HP Chemstation software version A.02.05. The column used was an Inertsil ODS-3 reverse phase C-18 column (5 μM, 250 mm×4.6 mm, with a metaguard column, from Varian). The initial conditions were 20% methanol, 80% 0.01 M phosphoric acid at a flow rate of 1 mL/min. The effluent was monitored at 285 nm. After an injection (15 μL), the column was held at the initial conditions for 2 min, then developed to 100% methanol and in a linear gradient over 55 min. A standard curve was prepared from pure rosmarinic acid (Chromadex) based on peak area absorbance.
Total polyphenol content in leaf extract
The total phenol content in the methanolic and crude freeze-dried extracts was determined by a modification of the Folin–Ciocalteu method used by Singleton et al. 33 Briefly, 0.8 mg of crude freeze-dried aqueous extract were dissolved in 2 mL of distilled water and then centrifuged at 900 g for 10 min. Similarly, 0.02 mL (46 mg/mL) of methanolic extract were diluted to 2 mL with methanol. Approximately 2.5 mL of Folin–Ciocalteu reagent (10% v/v) was added to 0.5 mL of methanol extract, aqueous crude extract, and gallic acid standards of known concentrations (0.04–0.2 mg/mL). After 3 min, sodium carbonate solution (7.5% w/v) was added to the mixture and maintained at room temperature for 30 min with intermittent shaking. The absorbance of the blue solution was measured at 765 nm. The total phenol content in the crude aqueous and methanolic extracts was determined from the calibration curve of gallic acid standards, which is expressed as mg per gram of the leaf sample.
Flavonoid content in leaf extract
The total flavonoid content in the crude aqueous extract was determined by the aluminum chloride colorimetric method as described by Vieira et al. 34 Briefly, 0.8 mg of freeze-dried aqueous extract was dissolved in 2 mL of distilled water and then centrifuged at 900 g for 10 min. Approximately 1.25 mL of distilled water was added to 0.25 mL each of the crude aqueous extract and the catechin standards (0.04–0.8 mg/L). At time zero, 0.075 mL of 5% (w/v) sodium nitrate solution was added to the mixture. After 5 min, 0.15 mL of 10% (w/v) aluminum(III) chloride solution was added followed by 0.5 mL of 1M sodium hydroxide (NaOH). Finally, 0.275 mL of distilled water was added, shaken, and absorbance was taken at 510 nm. The total flavonoid content was determined from the calibration curve of the catechin standards and expressed as mg per catechin equivalents. Various dilutions were done with distilled water when necessary.
Thin-layer chromatography
The crude aqueous extract and the various organic extracts were dissolved to 40 mg/mL. Polyphenol standards 3-methoxy cinnamic acid, 3,4-dihydroxy cinnamic acid, 3,5-dimethoxy-4-hydroxyl cinnamic acid, 4-methoxy cinnamic acid predominantly trans,p-coumeric acid, trans cinnamic acid, o-coumeric acid, ferulic acid, chlorogenic acid, catechin, gallic acid, vanillic acid, syringic acid, homogentisic acid, protocatehuic acid ethyl ester, 3-methyl catechol, and RA were also diluted to 40 mg/mL in methanol. Samples were spotted on 20×20 aluminum silica gel plates (0.2 mm thickness, medium pore diameter of 60 A, and size 5 μm), and the developing solvent system was chloroform:methanol:water (35%:57.5%:7.5%, v/v). After development the TLC plates were dried, and polyphenol spots were identified by retardation factor (Rf) and visualisation by spraying with a 2.5% iron (III) chloride dissolved in absolute ethanol.
HPLC-electrospray ionization mass spectrometry
To confirm the identity of the major polyphenols found in the leaf extracts, aliquots were injected on a Quadrupole time-of-flight (Q-TOF) liquid chromatography (LC)-mass spectrometer (MS). Samples were run on an Applied Biosystems/MDS Sciex QStar Elite Q-TOF mass spectrometer with a Turboionspray electrospray source, with chromatography performed on an Agilent 1100 series HPLC system (G1379A degasser, G1357A binary capillary pump. G1389A autosampler, G1315B photodiode array detector, and a G1316A column oven) all running under Applied Biosystems Analyst 2.0 (build 1446) LC-MS software. The MS was calibrated at least once daily with a standard calibration mixture recommended by Applied Biosystems, and the signal detection was optimized as needed. The data were acquired in the negative TOF MS mode. The MS parameters were as follows: cycle time, 1 sec;, accumulation time, −1 sec; mass range, 400–1000 daltons; source gas, 1–45 units; source gas, 2–25 units; curtain gas, 25 units; ion spray voltage, −4200; source heater, 400°C; declustering potential, −60; focusing potential, −265; declustering potential, 2–15; ion release delay, 6; and ion release width, 5. The column used was an Inertsil ODS-3 reverse-phase C-18 column (3 μm, 150 mm×3 mm, from Varian). The initial HPLC conditions were 20% methanol and 80% of 0.25% formic acid in water, at a flow rate of 0.25 mL/min, and then, the column was developed to 100% methanol over 50 min. The effluent was also monitored at 280 nm on the photo diode array. A Spectral Database for Organic Compounds by the National Institute of Advanced Industrial Science and Technology, Japan, was used to generate possible compound formulae based on the m/z values as well as a reference to previous literature information. The RA peak was detected at an m/z of 359, corresponding to the [M−H]− mass ion.
Results And Discussion
Although several analytical methods, including capillary electrophoresis 35 and gas chromatography, have been developed for the determination of polyphenolic compounds in herbal medicines, a reliable and applicable reverse-phase HPLC diode array and thin-layer chromatography techniques were used in the present analysis, as a single polyphenol (RA) was the target. Similarly, a convenient and simple solid-liquid polyphenol extract procedure for herbal medicines was adopted. Extraction techniques such as liquid-liquid extraction, aqueous alkaline extraction, and ultrasound-assisted extraction were, however, not preferred in this work, while supercritical fluid and pressurized liquid extraction 36,37 were expensive techniques and were also not available. The polyphenol profile obtained from the HPLC diode array shows that the leaves of O. canum contain a number of polyphenols, including RA. This is supported by the TLC method [polyphenol spots determined from Rf values and complexation with iron(III) chloride], which closely confirmed the presence of RA in the leaf extract. The HPLC polyphenol profile of the leaf extract is shown in Figure 2.
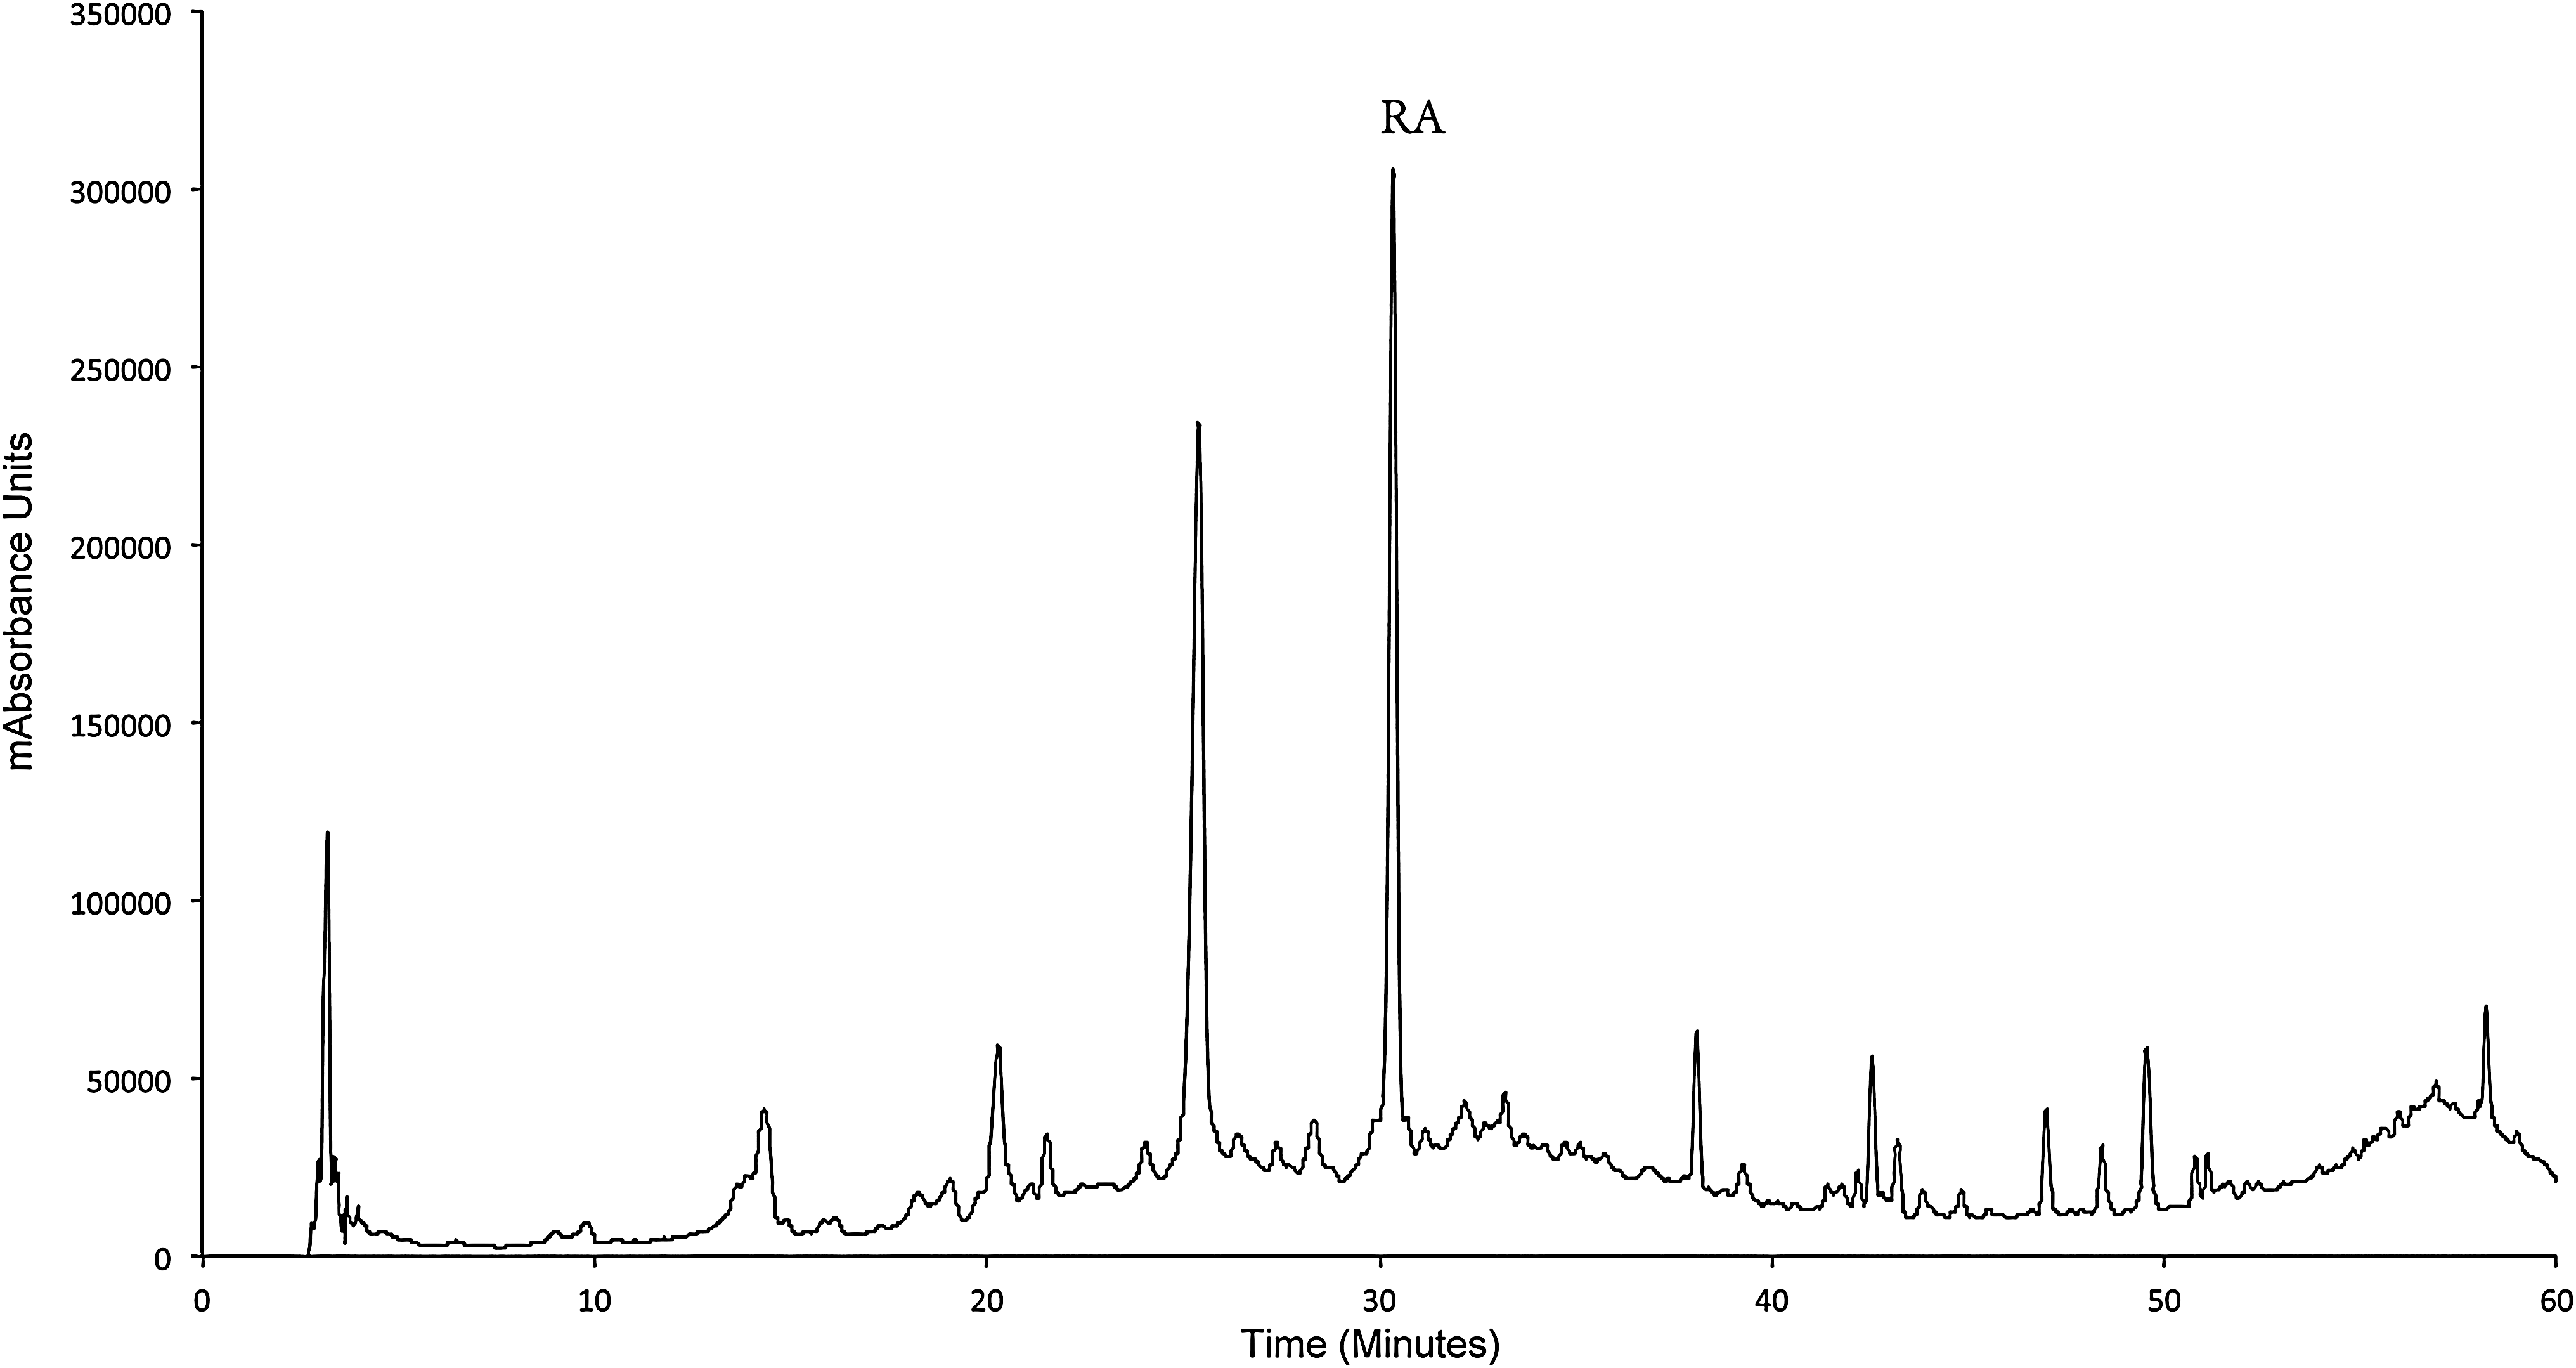
Polyphenol profile of Ocimum canum Sims determined by high-performance liquid chromatography with diode array detection (DAD). Retention time at 30.07 min refers to RA. Other prominent polyphenol peaks were detected at 20.03 min, 25.12 min, 38.56 min, and 59.71 min.
The RA peak at the retention time of 30.1 min was identified by comparison to pure standard RA and the polyphenol profile of a characterized extract of mint leaves. There were four other major polyphenol peaks at 20.0, 25.1, 38.6, and 59.7 min.
The total polyphenol content in the leaf of O. canum was determined by the Folin–Ciocalteu method. A gallic acid calibration curve with a linear equation of y=8.6598x+0.1006 and a correlation value of 1 were obtained for gallic acid standards ranging from 0.1 mg/mL to 1 mg/mL. It was shown that the total polyphenol concentration was comparable to concentrations determined in other herbs. 38 RA, which tends to be a predominant polyphenol peak in most culinary herbs, was also detected in the antidiabetic leaf extract of O. canum obtained in Ghana. The polyphenol content in the crude aqueous and methanol extracts was 314 and 315 mg gallic acid equivalent/g leaf sample, respectively. There is no significant change in total polyphenol concentration when extracted with either water or methanol. The total polyphenol content in the leaf of O. canum can be extracted with either methanol or water for a qualitative and quantitative analysis of RA. Flavonoid concentration in the leaf extract was determined from a calibration curve (y=11.748x+0.092; R 2=1.00) of catechin standards over a concentration range of 0.1–0.25 mg/mL. The total flavonoid concentration was 135 mg catechin equivalents/g leaf sample.
A calibration curve (y=0.0009x−0.0023; R 2=0.997) for rosmarinic as shown in Figure 3 was obtained from three injections per data point. The average RA in the O. canon leaves was 1.69 mg/g leaf sample (corresponding to about 0.6% of total polyphenol determined by the Folin–Ciocaltue method). The RA concentration obtained in this herb found in Ghana was relatively less when compared with other genus species of the lamiaceae; however, it was higher than commonly selected O. canum species leaves obtained by Arivazhaggan et al. 39 This difference in RA content in Ocimum species is clearly shown in Table 1. It is important to note that the leaves of O. basilicum have been reported to contain 1.12 mg/g dry weight 40 and 99.62 mg/g dry weight. 41

Calibration curve for rosmarinic acid standards. The linear equation: y=0.0009x−0.0023; R
2=0.997; n=three injections per data point. Calibration range: 0.047–1 mg/mL. The mg/g of rosmarinic acid in the leaf O. canum was calculated from the following equation:
Values are reported as mean of three replicates and their standard deviations (mean±SD
Source: Arivazhaggan et al. 39
It is likely that the time of harvesting the leaves as well as the geographical location, environmental and climatic conditions impacted the concentration of RA obtained in the leaves harvested in Ghana. Although rosmarinic in leaves was determined and ascertained by comparing with the retention time of the RA standard, an HPLC-electrospray ionization (ESI)-MS was used to fragment the polyphenol peaks at the retention times of 36.0, 36.7, 41.6, 43.1, and 49.1 min, which were obtained from the total ion chromatograph and verified by the ultraviolet light spectrum. The molecular ions [M−H]−, molecular ion dimer [2M−H]−, and its fragmented daughter peaks are shown in Table 2.
Rt, retention time; MW, molecular weight.
Molecular ions can be fragmented into daughter ions, which can be detected by the MS. The mass spectral obtained in this case was used for polyphenol structural analysis and identification purposes of metabolites, which is important for chemotaxonomic markers. At a retention time of 43.1 min (Fig. 4), the ESI-MS of the polyphenol produced daughter ions at mass-to-charge ratios (m/z) of 135.0723, 161.0507, 197.0736, 359.1322, and 719.2857. The molecular ion (negative parent ion) [M−H]− for RA was found at an m/z ratio of 359.1322, and its dimer [2M−H]− showed an m/z of 719.2857. The likely RA dimer (one of its derivatives) is lithospermic acid B, shown in Figure 5.
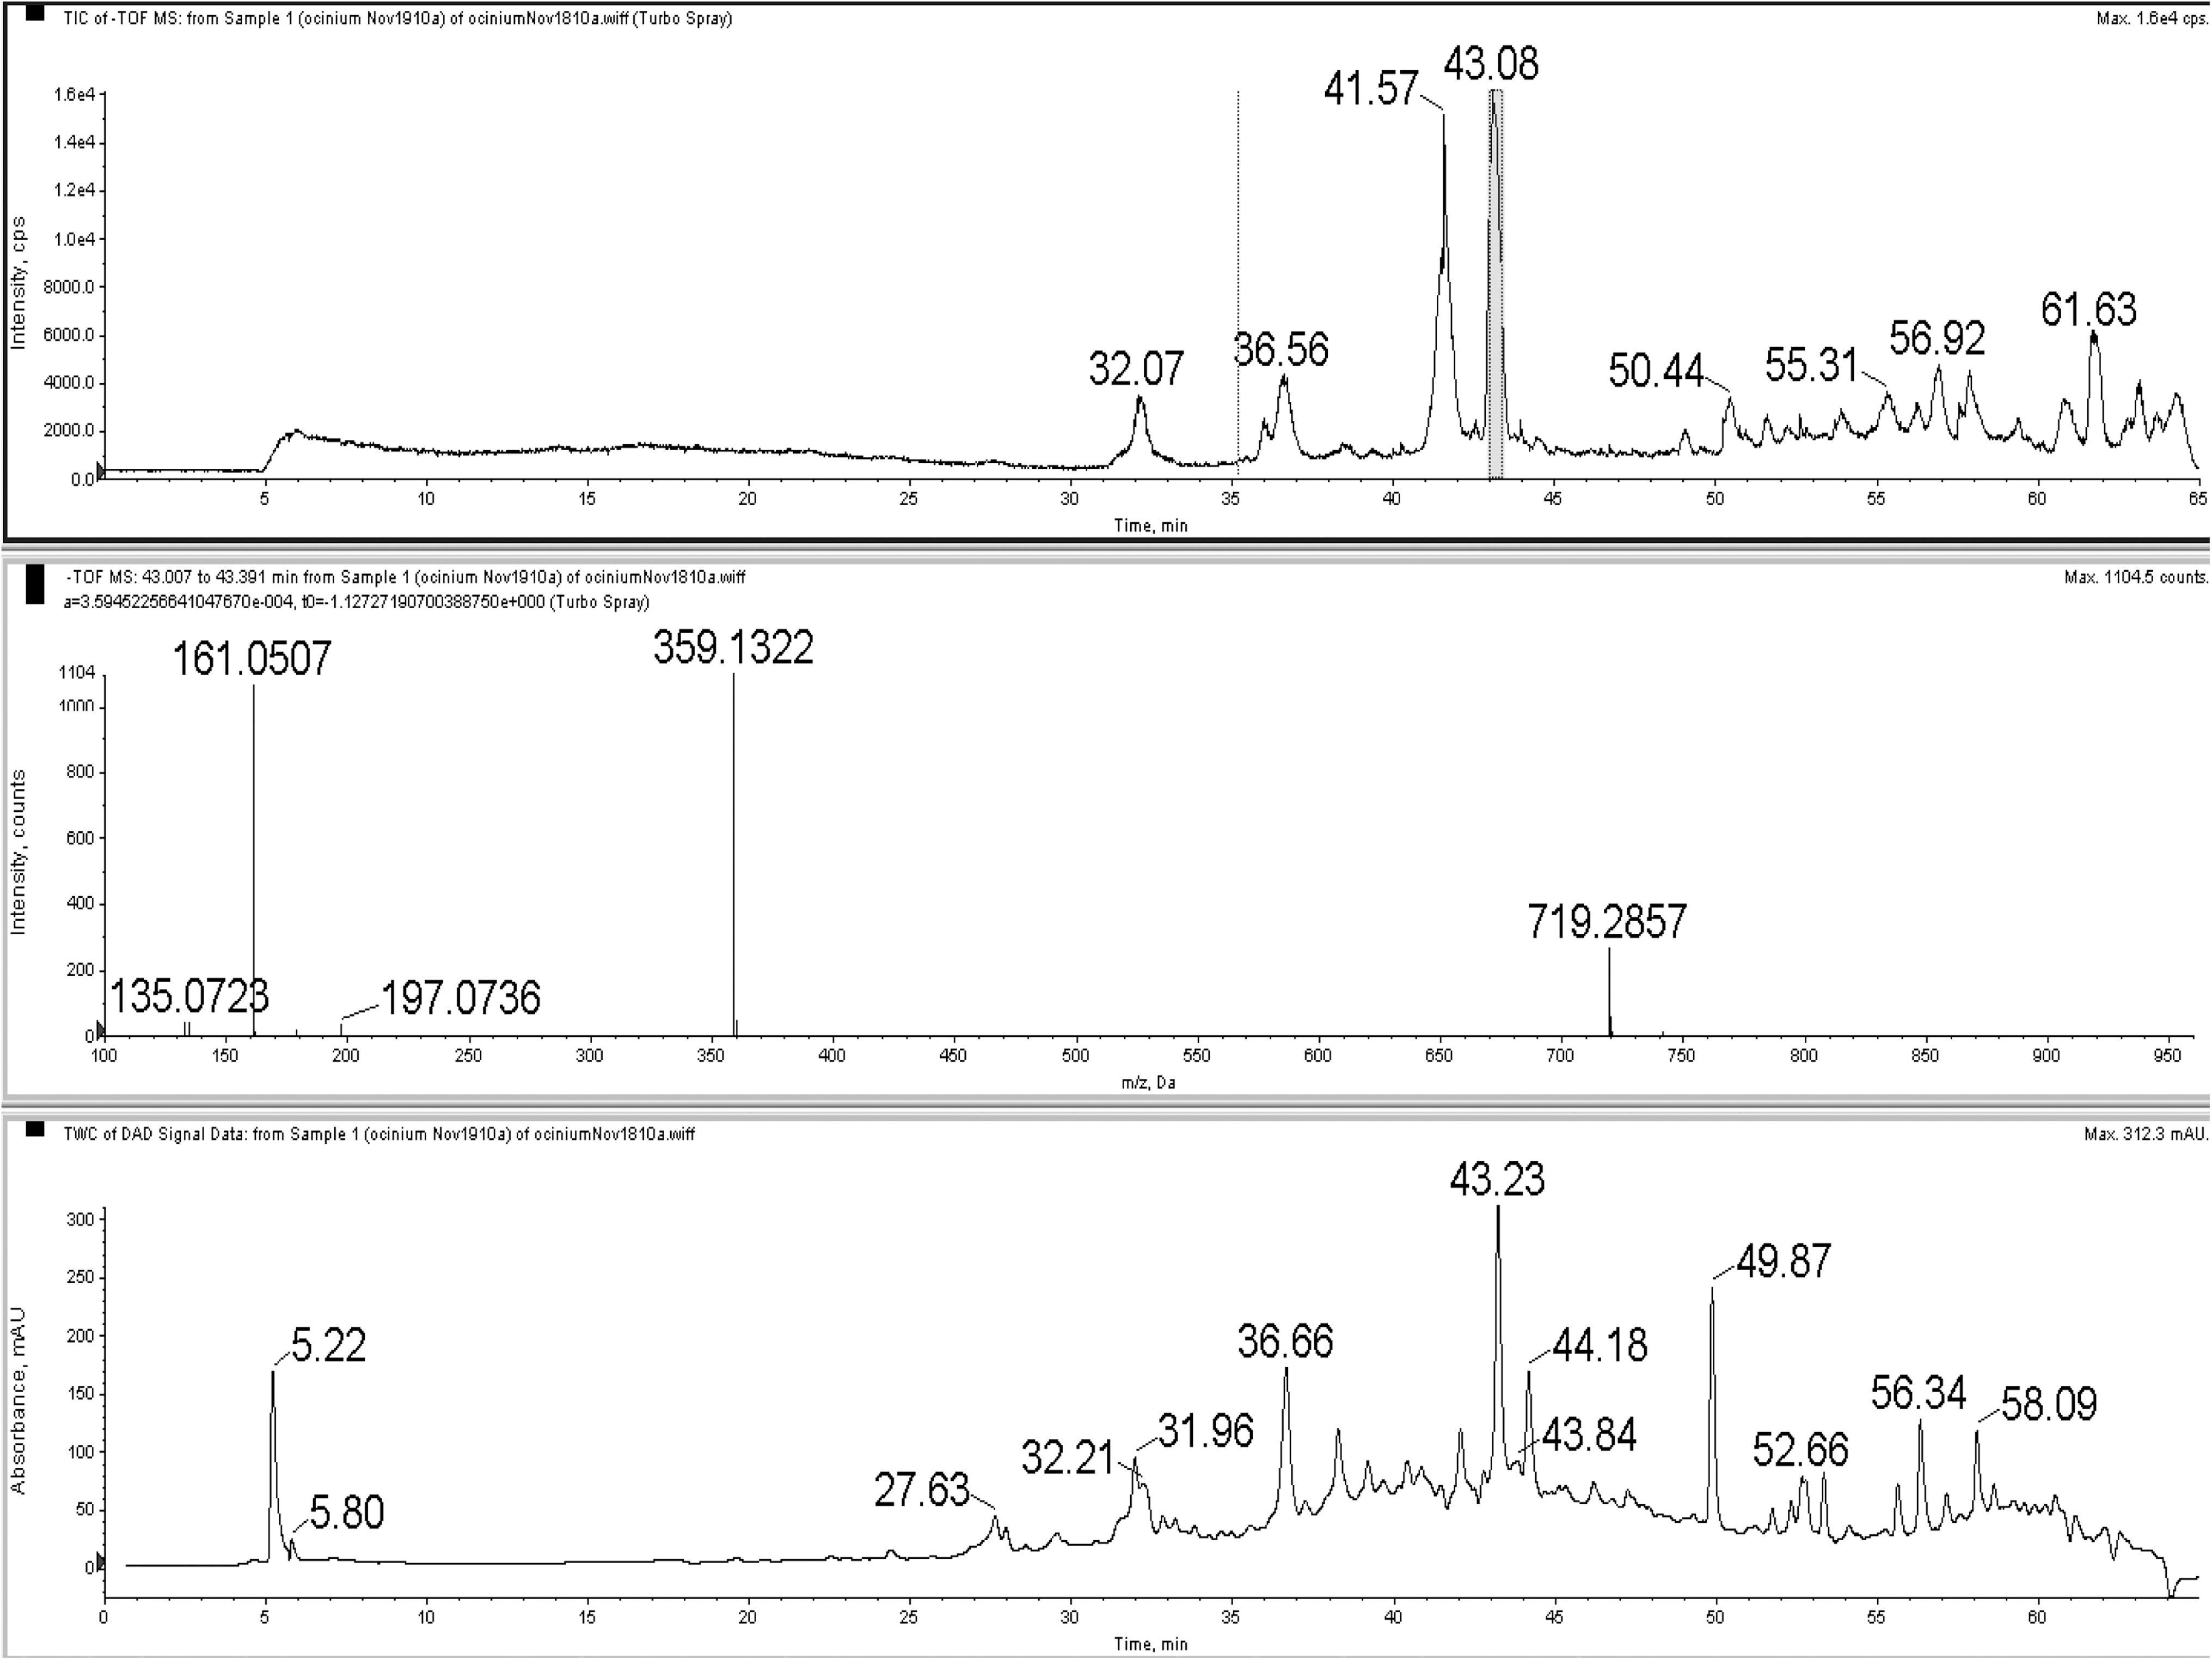
ESI-MS analysis of rosmarinic acid at retention time of 43.08 min from total ion chromatogram (top) and standard UV spectrum of O. canum. ESI-MS, electrospray ionization mass spectrometry; UV, ultra violet.
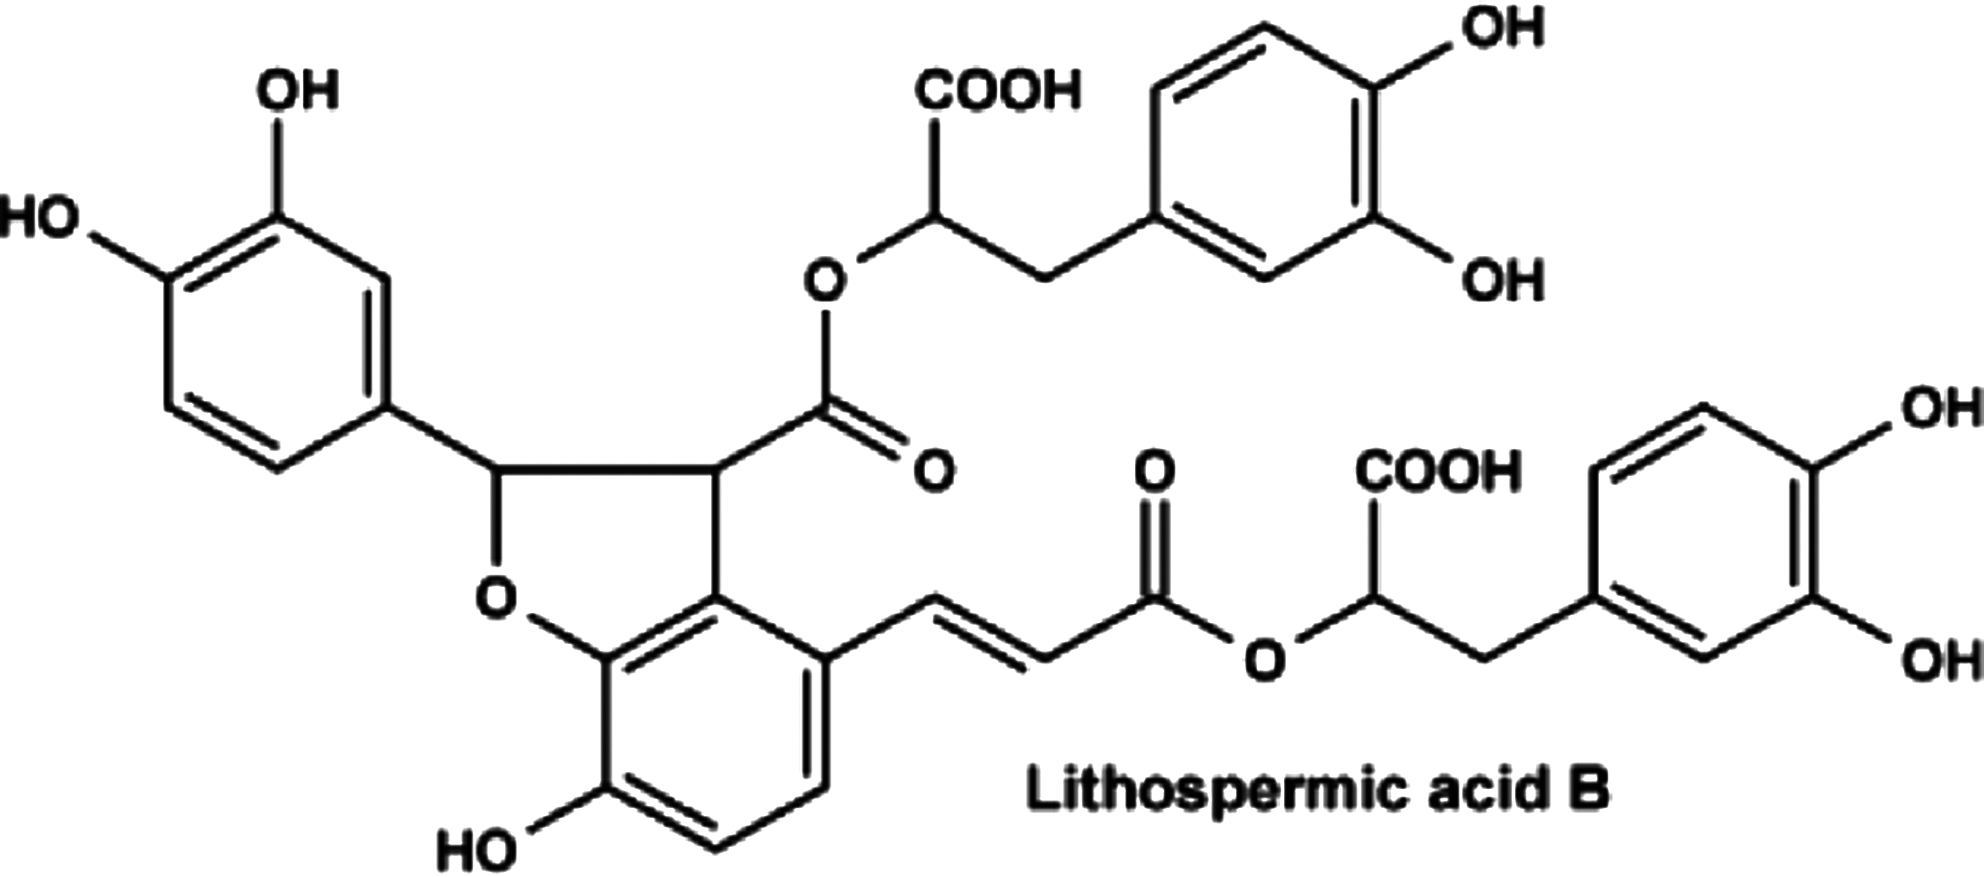
A dimer of rosmarinic acid.
The negative parent ion for RA produced a fragment at 197 [M−H-caffeic acid]−, 161 [M−H-197]−, and 135 [179-COO]−. Although the molecular ion at 179 [caffeic−H]− was not shown in the mass spectra, an m/z ratio of 197 suggests the presence of caffeic acid moiety.
The UV, ESI-MS spectra of RA (typical phenolic acid with caffeoyl moiety) was in agreement with previous results. 42 –44 This suggests that RA forms, to some extent, dimers when extracted with methanol/dimethyl sulfoxide mixture at room temperature. These mass spectral m/z ratios have been previously confirmed. The rosmarinic dimer in the mass spectrum is ∼27.12% of the parent molecular ion.
Similarly, at retention time 49.1 min (shown in Fig. 6 and Table 1) obtained from the total ion chromatograph, the ESI-MS polyphenol fragmentation showed a parent molecular ion [M−H]− at a mass/charge ratio of 679.5118, which has a higher intensity count. The daughter ions with similar low intensity counts had m/z ratios of 293.2389 and 325.2431. Since NMR spectra for this polyphenol was not determined, the identity of this polyphenol was ascertained from literature and mass spectral databases.
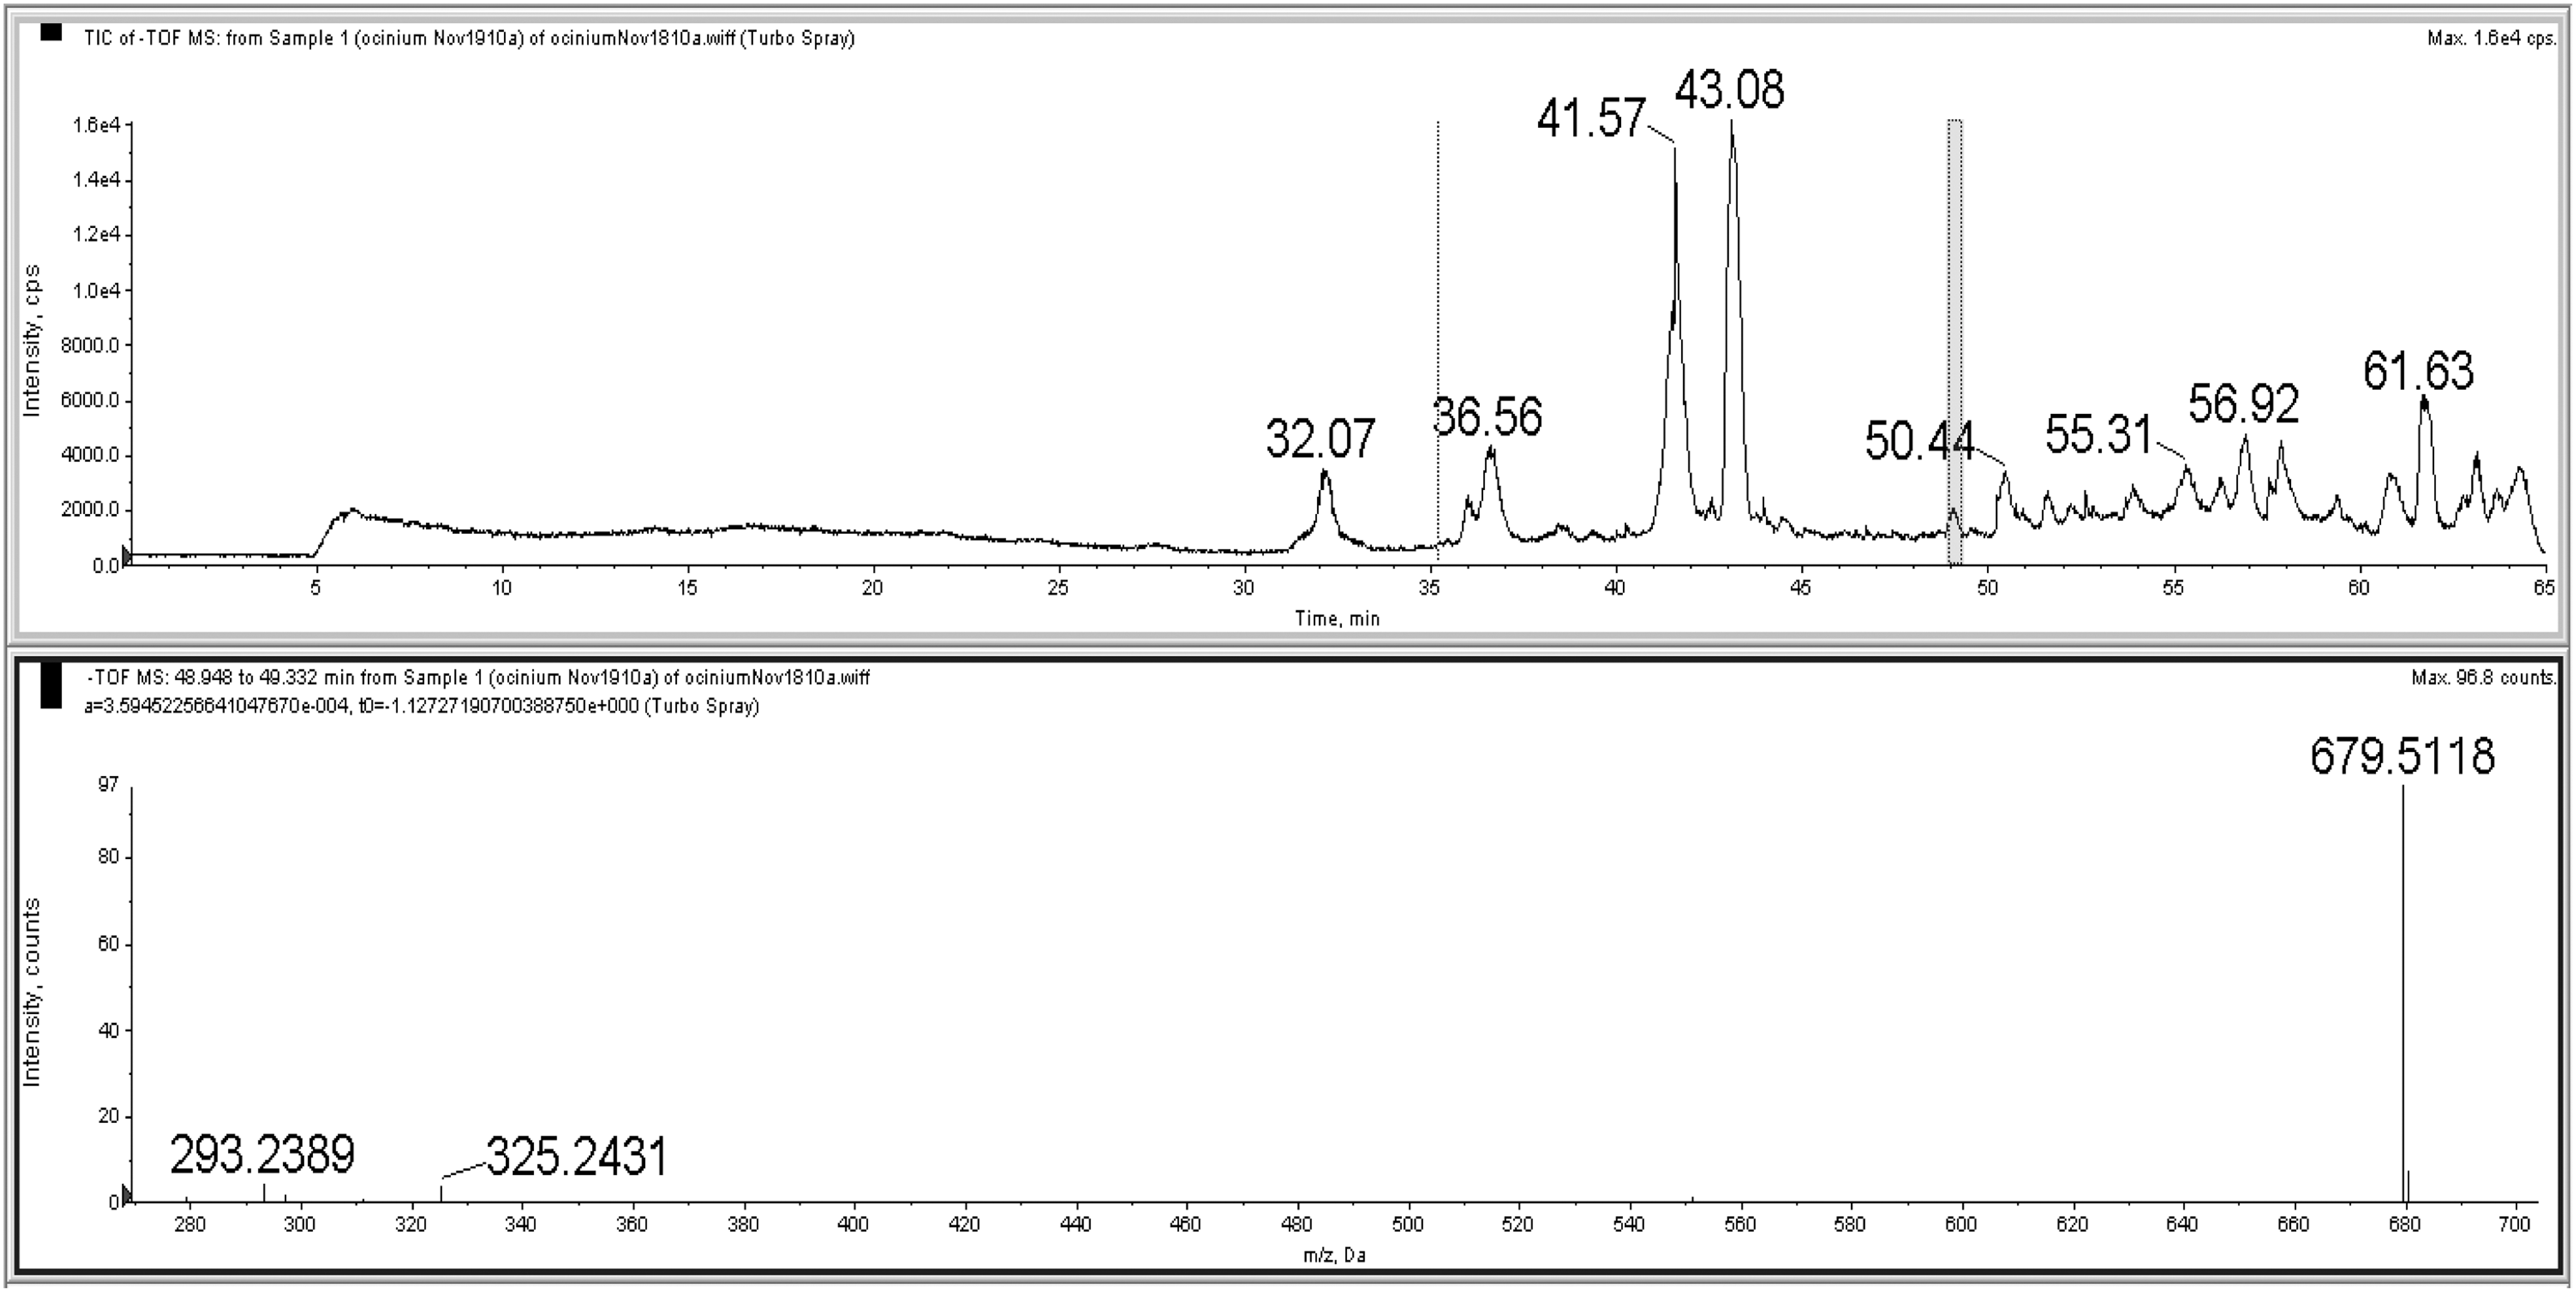
ESI-MS of a polyphenol peak at a retention time of 49.14 min from the total ion chromatogram (first graph) and standard UV polyphenol profile from O. canum.
At an elution time of 36.0 min (Fig. 7), the parent molecular ion had an m/z ratio of 387.2147 with daughter ion fragments at m/z ratios of 134.0646 and 135.0710. The intensity count for 135.0710 was about thrice of 134.0646 with the highest intensity count obtained for 387.2147. An m/z ratio difference of 252.1447 was obtained between 387.2147 and 135.0710.
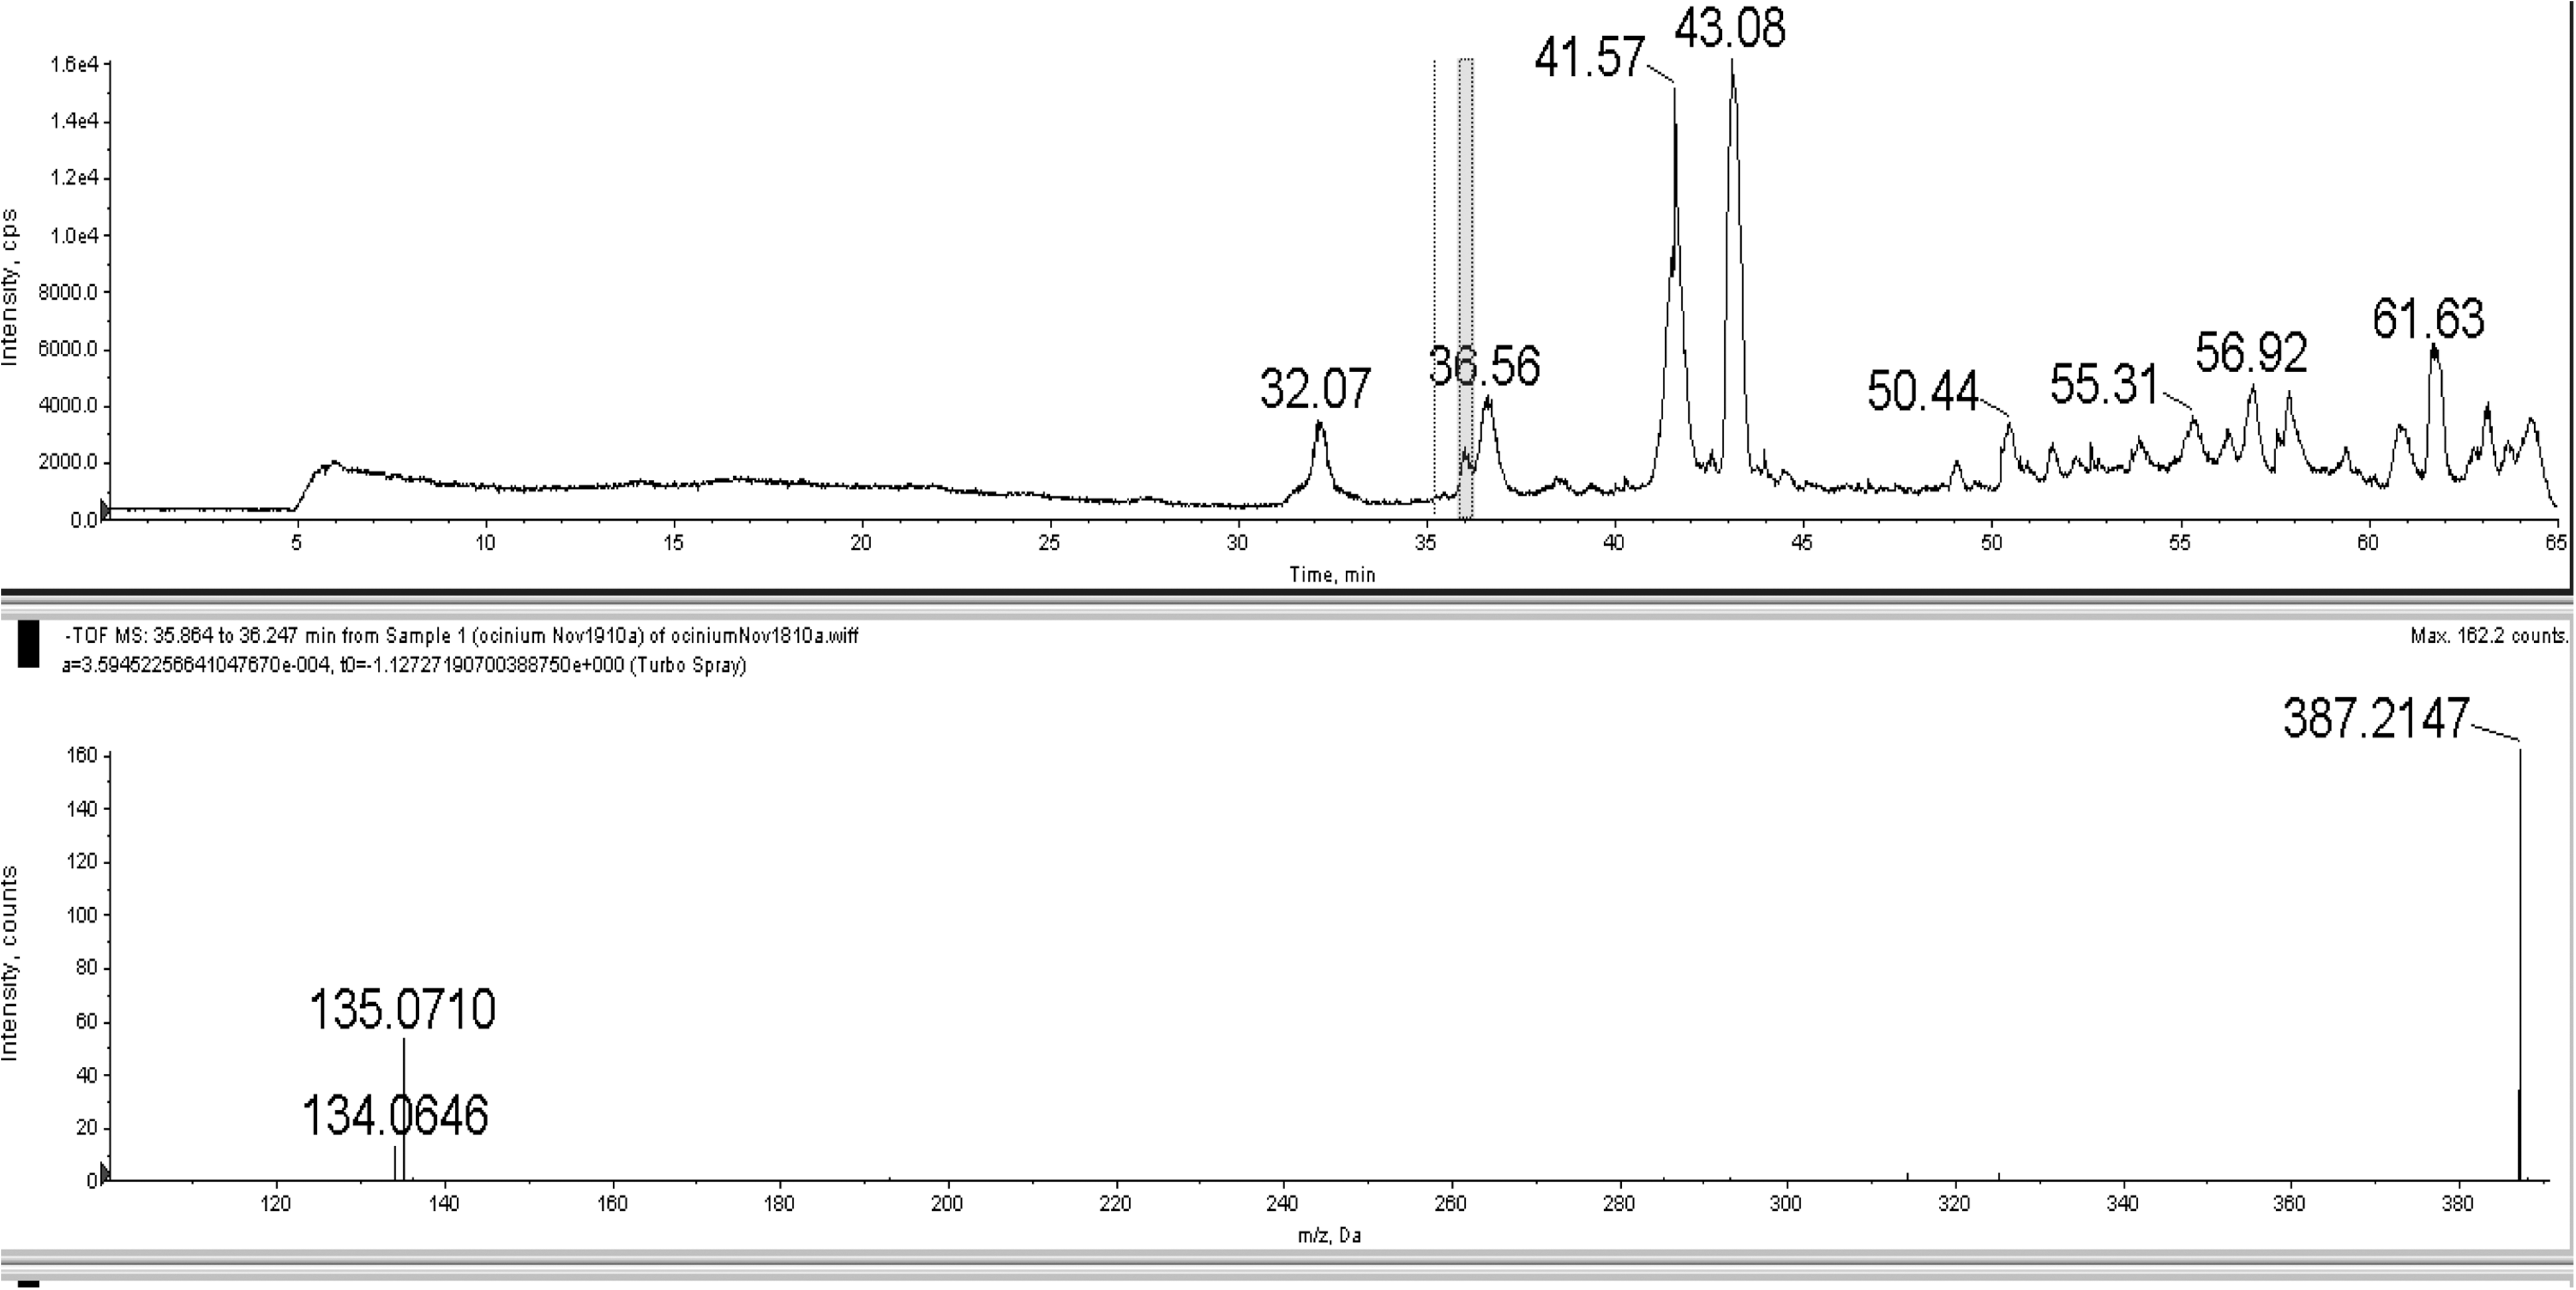
ESI-MS of a polyphenol peak at a retention time of 36.01 min from total ion chromatogram (first graph) and standard UV polyphenol profile from O. canum.
The few signal peaks obtained from the ESI-MS show that the polyphenol is relatively stable. Indeed, a comparison of the daughter ion fragments of m/z ratios of 135.0710 and 134.0646 obtained from these polyphenols and the m/z ratios at the retention times of 36.0 min, 36.6 min, 41.6 min, and 43.1 min suggests that these polyphenols maybe related in structure to RA.
At the retention time of 36.6 min (Fig. 8), the ESI-MS of this polyphenol showed a parent molecular ion at an m/z ratio of 593.2489 [M−H]− and daughter ions at 135.0702, 136.0751, and 179.0592. From the literature, the m/z ratio of 179.0592 [caffeic acid−H]− corresponds to a caffeic moiety, which is conjugated to the parent molecule at 593.2489. The m/z difference of 44 between m/z ratios 179.0592 and 135.0702 suggests a loss of CO2 from caffeic acid; thus, m/z of 135 is represented as [caffeic acid−COO]−. Similarly, the parent molecular ion at 593.2489 is likely to be a caffeic acid derivative and not kaempferol rutinoside or 6,8-di-C-glucosyl apigenin, which has same molecular mass of 593. 43,45 An m/z ratio difference of 1 between m/z ratios of 135.0702 and 136.0751 suggests a proton abstraction by the decaboxylated caffeic acid.
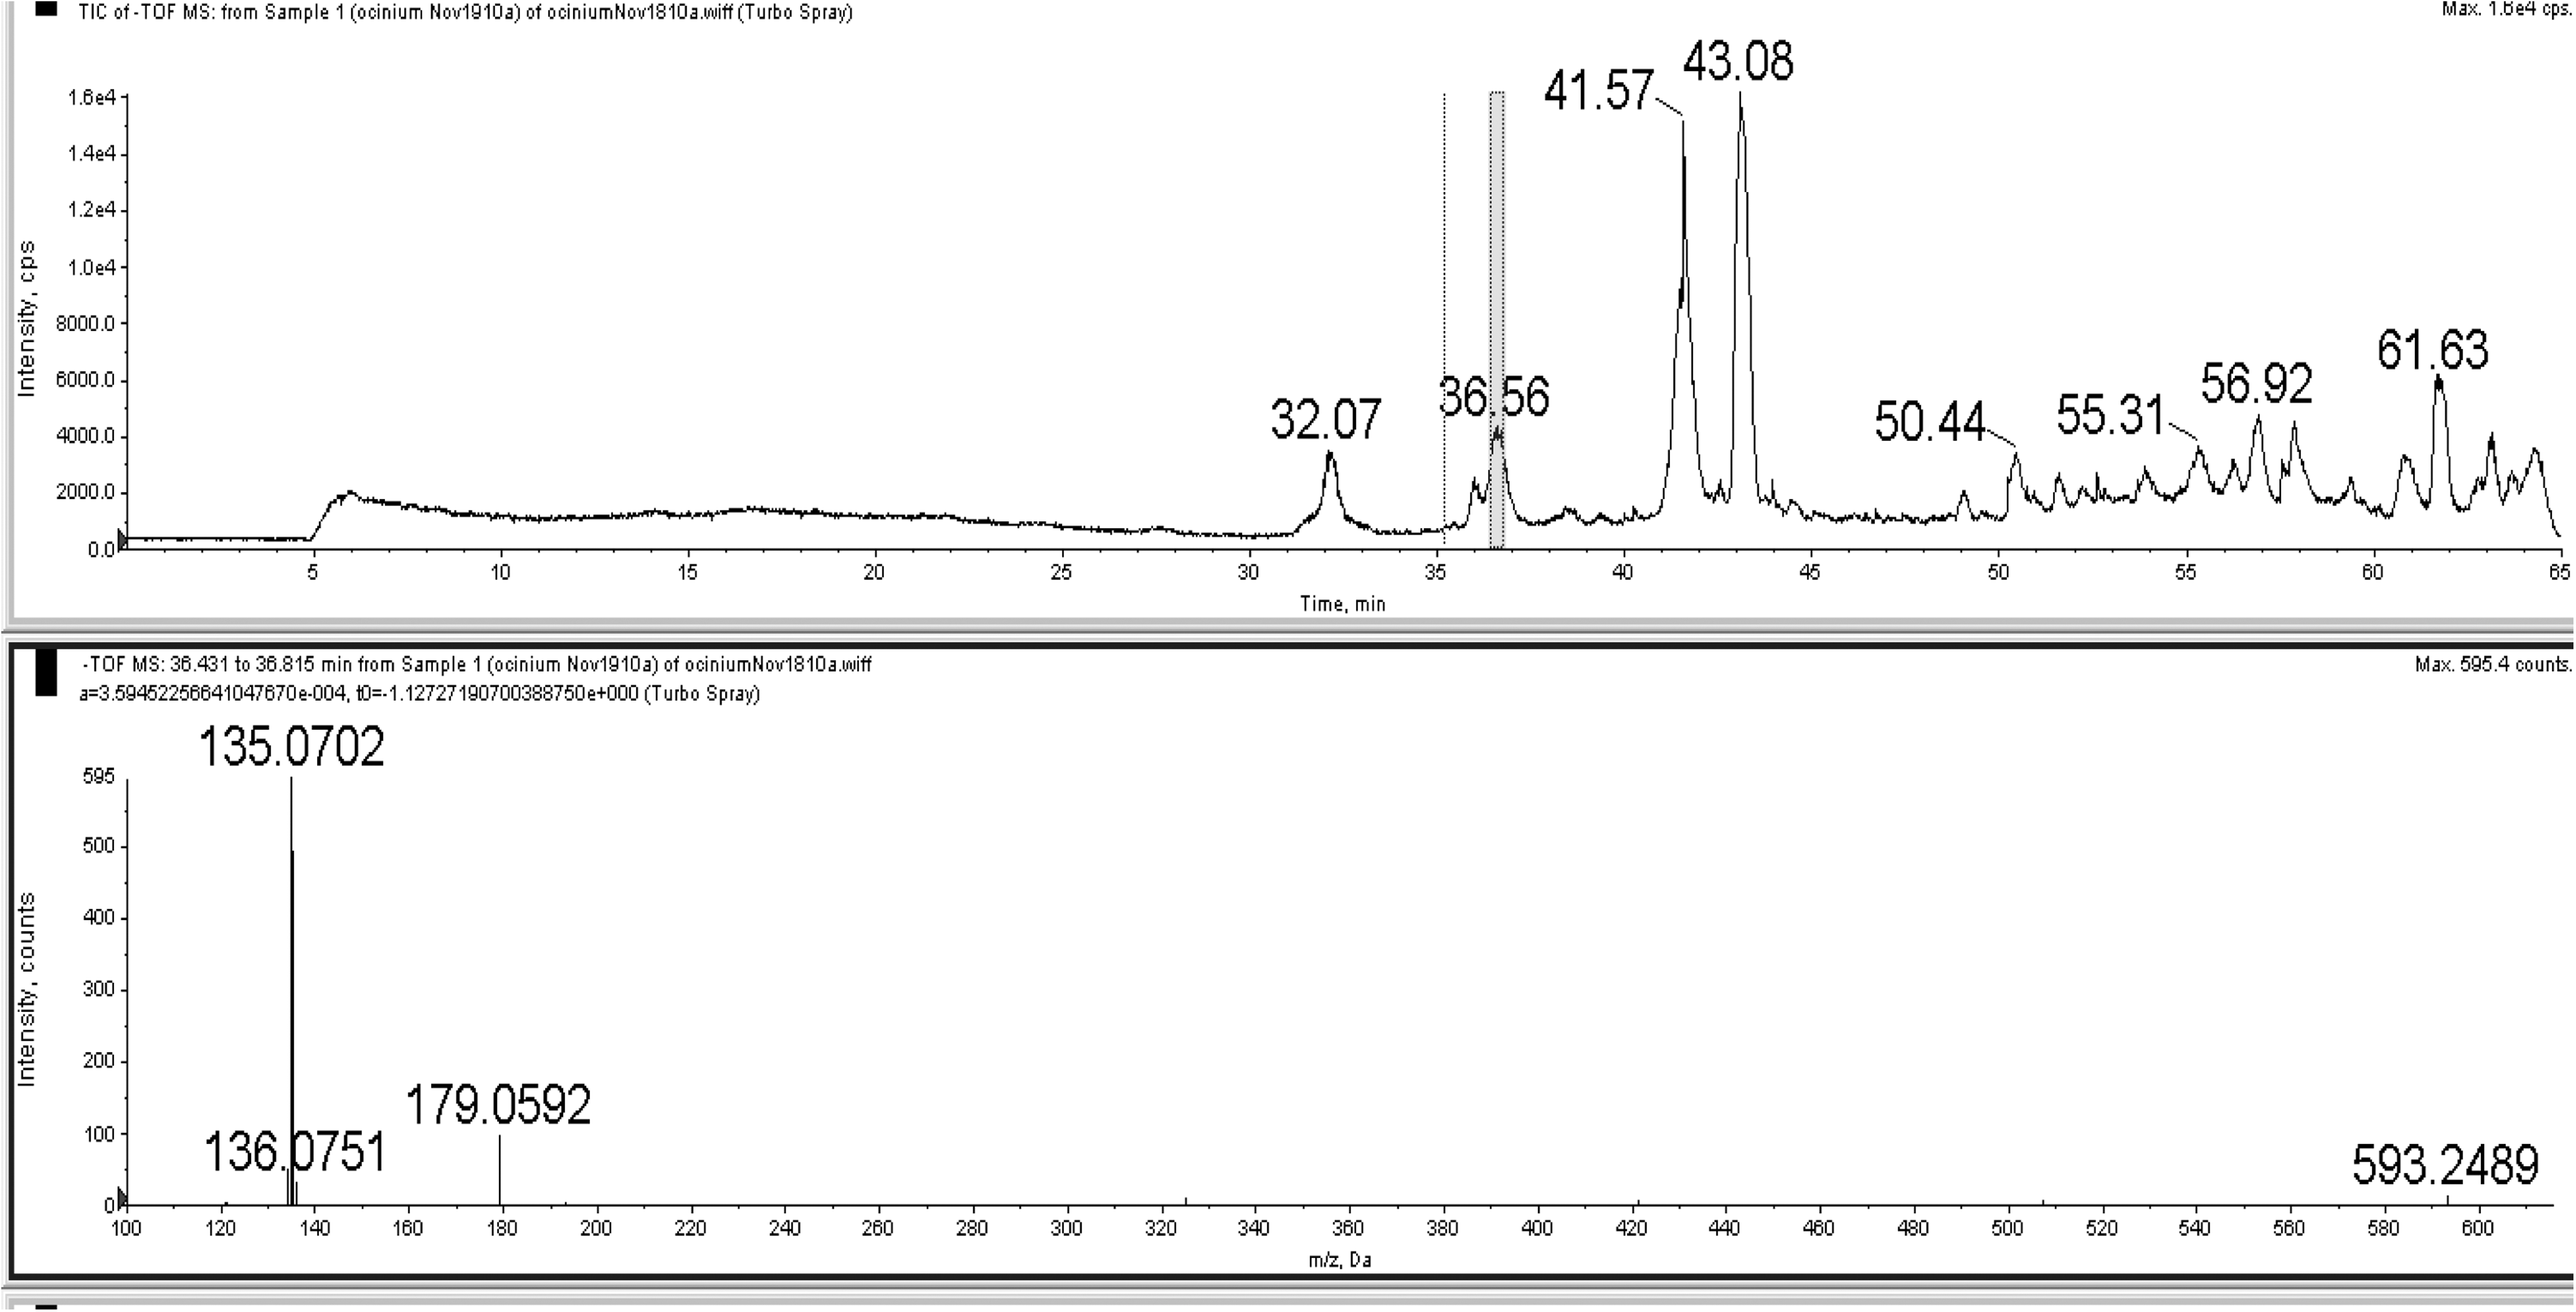
ESI-MS of a polyphenol peak at a retention time of 36.56 min from total ion chromatogram and standard UV spectrum of O. canum.
From Figure 9 at an elution retention time of 41.6 min from the total ion chromatograph, the polyphenol showed that the parent molecular ion had an m/z ratio of 473.1142 and a corresponding dimer at an m/z ratio of 593.2489. The daughter ions also showed an m/z ratio of 135.0702, 136.0751, and 179.0592. From the literature, an m/z ratio of [caffeic acid−H]− 179.0592 corresponds to a caffeic moiety, which is a part of the parent molecule. The m/z ratio for the parent molecule and its corresponding dimer confirms this polyphenol as a caffeoyl derivative.
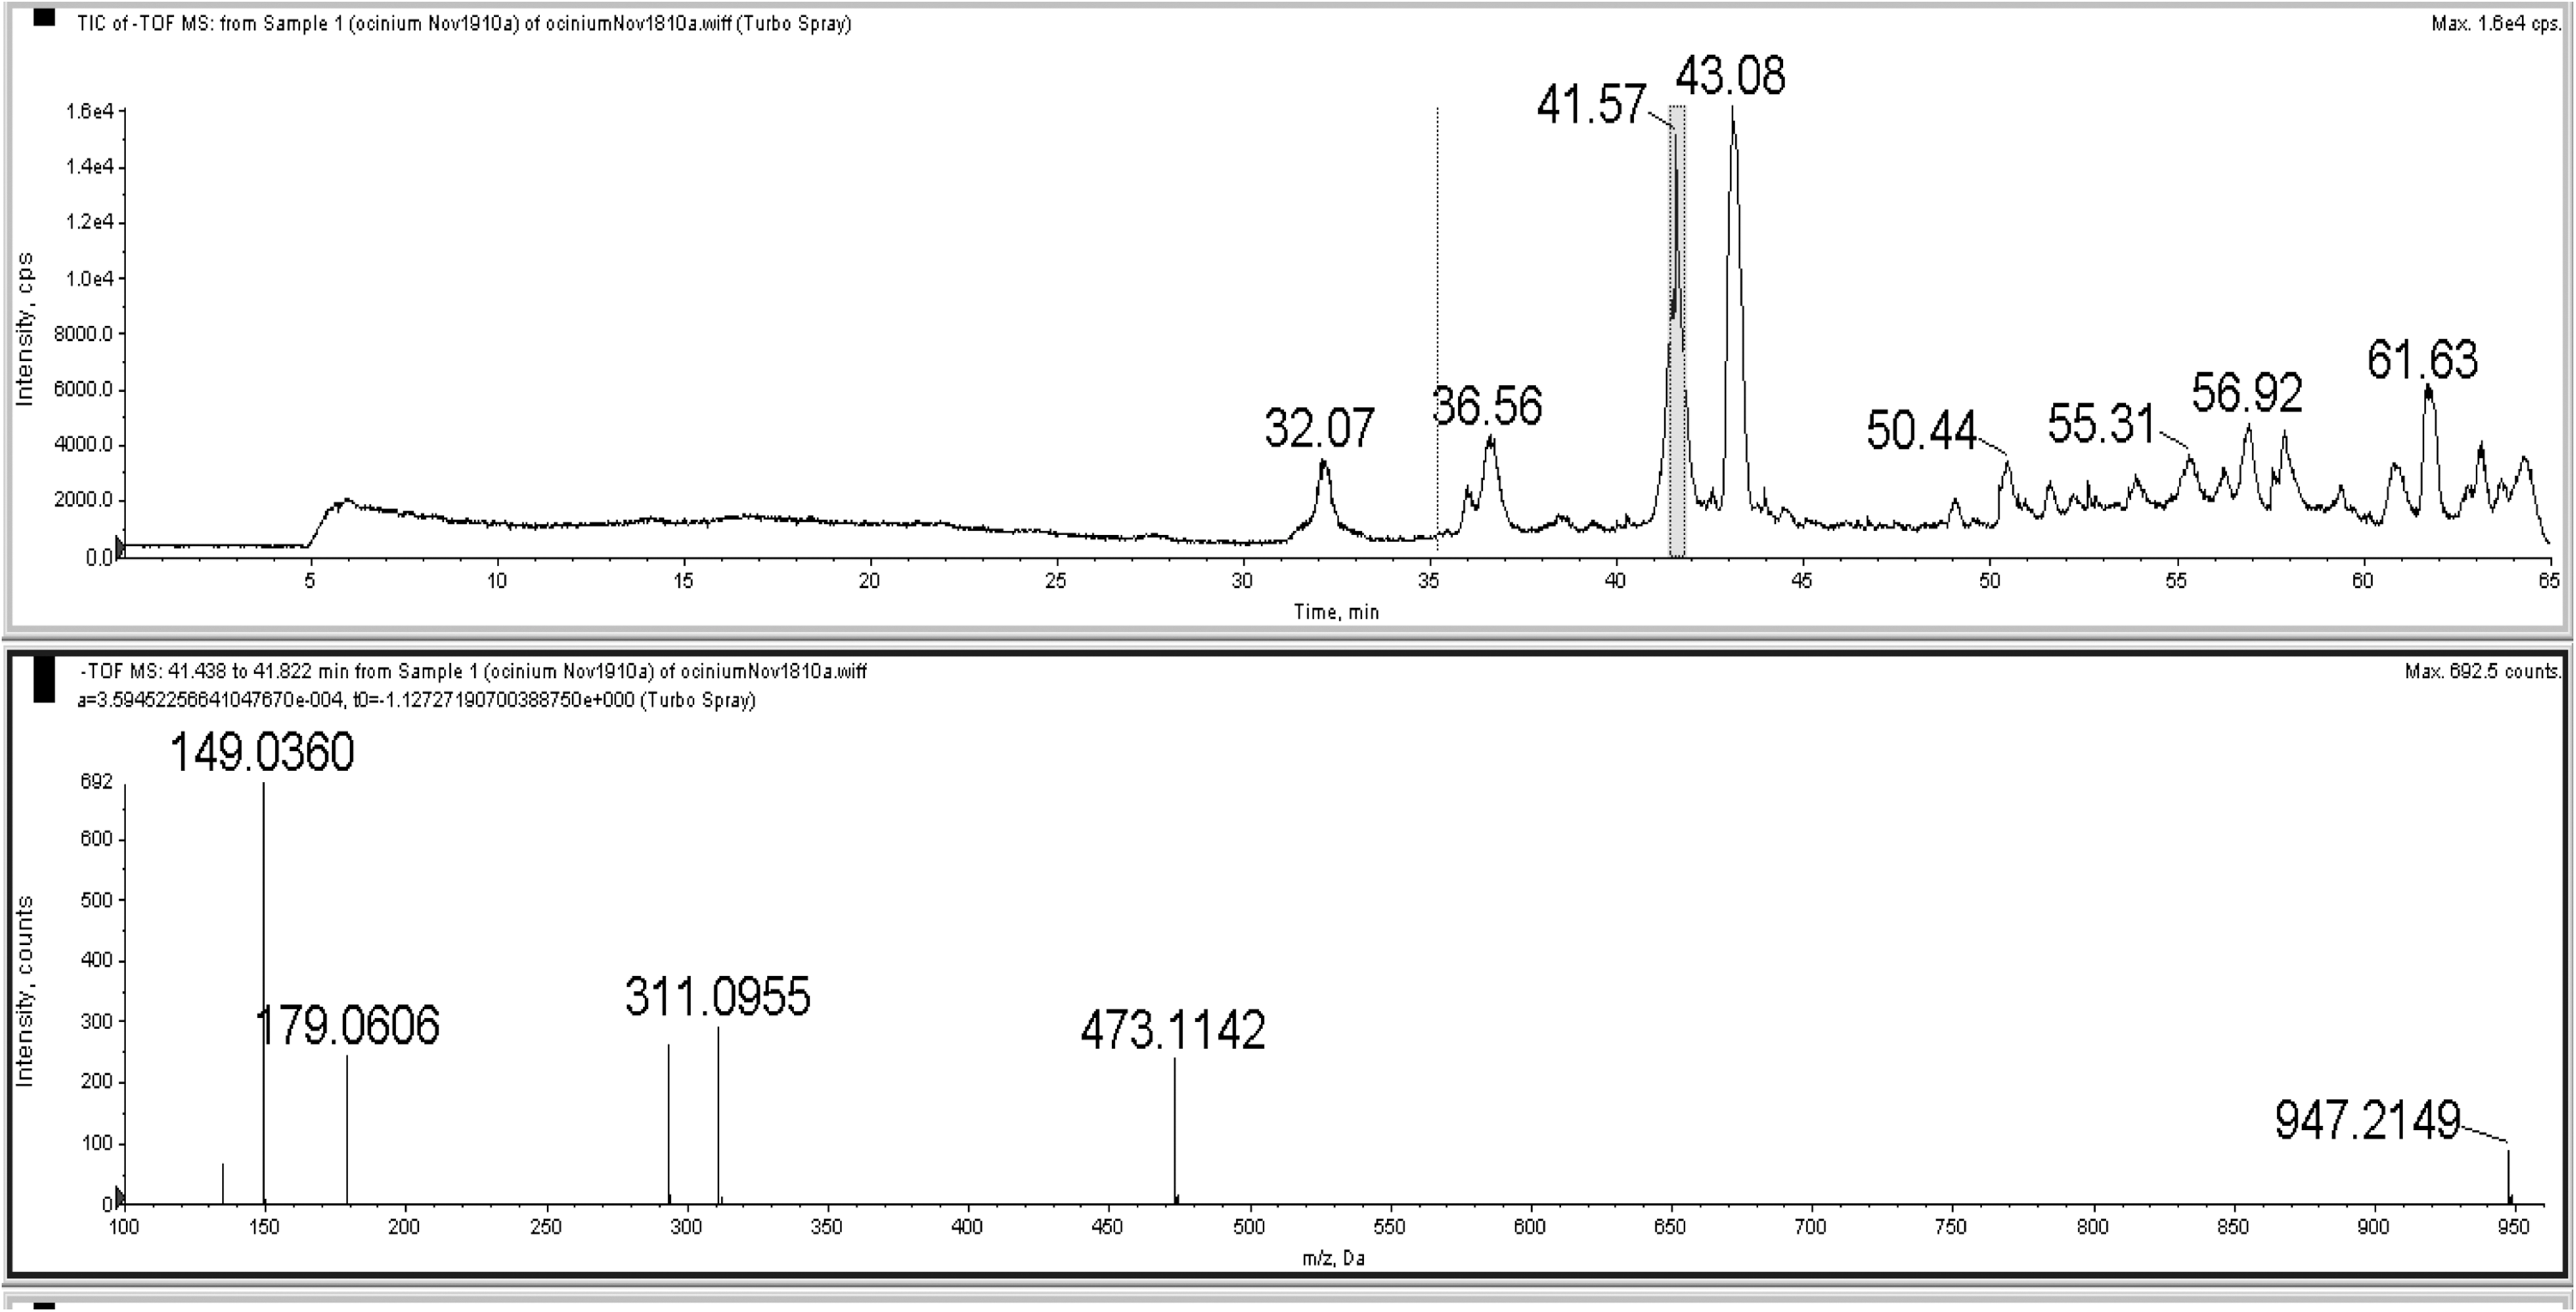
ESI-MS of a polyphenol peak at a retention time of 41.57 min from total ion chromatogram and standard UV spectrum of polyphenol in O. canum.
Conclusion
The RA concentration in O. canum grown in Ghana and harvested widely for diabetes management was investigated and determined. Although the RA concentration was low when compared with other lamiaceae genera, it was relatively higher than in Ocimum species reported in the literature. Besides the values obtained in other settings, it was determined that this polyphenol was still the major principal phenolic in the leaf extract obtained from Ghana. A polyphenol profile determined by HPLC-DAD from the leaf aqueous extract showed five major peaks, including RA. Although the RA structure was confirmed by HPLC-ESI-MS, the other associated polyphenols identified in the fingerprint were equally determined using relevant literature. The total phenol and flavonoid content showed that the aqueous extract from this herb contains various kinds of polyphenols. The variations in the RA concentration recorded in this experiment and elsewhere may be due to classical environmental influence, geographical origin, climatologic conditions, time of leaf harvest, and differences in soil characteristics. Further, this species may not accumulate high amounts of RA as do the other related species. This could easily be ascertained by performing a year course and soil analyses. The method we used in this study is reproducible and could be used for qualitative and quantitative analysis of polyphenols in leaf extracts.
Footnotes
Author Disclosure Statement And Disclaimer
No competing financial interests exist for any author. Mention of trade names or commercial products in this publication is solely for the purpose of providing specific information and does not imply recommendation or endorsement by the U.S. Department of Agriculture. USDA is an equal opportunity provider and employer.