
Abstract
Chitosan is a natural product derived from chitin. To investigate the hypoglycemic and anti-obesity effects of chitosan, male Sprague–Dawley rats were divided into four groups: normal control, diabetic, and diabetic fed 5% or 7% chitosan. Diabetes was induced in rats by injecting streptozotocin/nicotinamide. After 10 weeks of feeding, the elevated plasma glucose, tumor necrosis factor-α, and interleukin-6 and lower adiponetin levels caused by diabetes were effectively reversed by chitosan treatment. In addition, 7% chitosan feeding also elevated plasma glucagon-like peptide-1 levels and lowered the insulin resistance index (homeostasis model assessment) in diabetic rats. Lower adipocyte granular intensities and higher lipolysis rates in adipose tissues were noted in the 7% chitosan group. Moreover, chitosan feeding reduced hepatic triglyceride and cholesterol contents and increased hepatic peroxisomal proliferator-activated receptor α expression in diabetic rats. Our results indicate that long-term administration of chitosan may reduce insulin resistance through suppression of lipid accumulation in liver and adipose tissues and amelioration of chronic inflammation in diabetic rats.
Introduction
T
The liver also plays an important role in lipid and glucose homeostasis. Peroxisomal proliferator-activated receptor (PPAR) α plays a key role in reducing insulin resistance and is expressed at high levels in the liver. 5,6 Stimulating fatty acid oxidation via PPARα activation decreases lipid accumulation and inflammation in the liver and may be responsible for restoring insulin sensitivity. 7 Administering subtype-selective PPARα agonists to mice is effective for treating type 2 DM with insulin resistance and obesity. 8,9
Glucagon-like peptide (GLP)-1 is produced through posttranslational processing of proglucagon and is secreted by intestinal L-cells in response to nutrient ingestion. Several studies showed that GLP-1 is a potent insulin secretagogue, enhancing β-cell function, promoting satiety, and delaying gastric emptying. 10,11 Impaired GLP-1 secretion was observed in patients with type 2 DM. 12 Therefore, GLP-1 was proposed as a treatment for type 2 DM. Recently, scientists have focused on finding a food source or a nutrient, such as dietary fiber capable of increasing GLP-1 levels and/or reducing chronic inflammation, that would be desirable for treating and preventing diseases associated with obesity and DM. 13 –15
Chitosan is a partially deacetylated polymer of N-acetylglucosamine derived from polysaccharide chitin and is primarily extracted from shells of crustaceans such as shrimp and crabs and from squid pens. 16,17 It is not digested by mammalian digestive enzymes and acts as dietary fiber. Consumption of chitosan has a beneficial effect by increasing fecal fat excretion and lowering plasma cholesterol in humans and other animals. 18,19 The antidiabetic effects of chitosan were demonstrated in type 1 diabetic rats. 20,21 Decreased liver gluconeogenesis and increased skeletal muscle glucose uptake due to chitosan ingestion were proposed to be the mechanisms responsible for alleviating hyperglycemia. 21 In addition, other animal studies demonstrated the efficacy of chitosan in reducing lipid accumulation in liver and adipose tissues, resulting in lower body weights. 22 –24 However, the exact mechanisms of the hypoglycemic and anti-obesity effects of chitosan in type 2 diabetes are not well understood. The present study was designed to investigate the effects of chitosan on lipid accumulation in the liver and adipose tissues and on insulin resistance in rats with streptozotocin/nicotinamide-induced type 2 diabetes.
Materials and Methods
Materials
Chitosan obtained from shrimp shell chitin by alkali fusion was purchased from Taiwan Tanabe Seiyaku (Taipei, Taiwan). The degree of deacetylation and average molecular mass of chitosan, determined as reported previously, 25 were 94% and 8.3×10⁵ Da, respectively.
Animals and diets
Six-week-old male Sprague–Dawley rats were purchased from BioLASCO Taiwan (Taipei). Rats were fed a standard chow diet for 3 weeks and then divided into four groups of 10 rats each: (1) nondiabetic rats with 5% cellulose (normal control [NC] group), (2) diabetic rats with 5% cellulose (DM group), (3) diabetic rats with 5% chitosan (DM+5% CS group), and (4) diabetic rats with 7% chitosan (DM+7% CS group). The compositions of the experimental diets given to test animals are shown in Table 1. Diabetes was induced in rats by a subcutaneous injection of nicotinamide (230 mg/kg of body weight) (Sigma, St. Louis, MO, USA) and streptozotocin (65 mg/kg of body weight) (Sigma). After 1 week of treatment, an oral glucose tolerance test was performed to confirm the status of impaired glucose tolerance before feeding the experimental diets. Rats were housed in individual stainless steel cages in a room kept at 23±1°C and 60±5% relative humidity with a 12-h light/dark cycle. All rats were fed the experimental diets ad libitum for 10 weeks. Food intake was measured daily, and body weight was obtained weekly. This study was approved by the Animal House Management Committee of the National Taiwan Ocean University. Animals were maintained in accordance with guidelines for the care and use of laboratory animals as issued by the Animal Center of the National Science Council.
Obtained from ICN Biochemicals (Costa Mesa, CA, USA).
The average molecular mass and viscosity of chitosan were about 8.3×10⁵ Da and 522 cps, respectively. The degree of deacetylation of chitosan was about 94%.
DM, diabetic with 5% cellulose group; DM+5% CS, diabetic with 5% chitosan group; DM+7% CS, diabetic with 7% chitosan group; NC, nondiabetic with 5% cellulose group.
Collection of blood and tissue samples
At the end of the experimental period, animals were fasted for 12 h prior to being sacrificed by exsanguination via the abdominal aorta while under diethyl ether anesthesia. Heparin was used as the anticoagulant. Plasma was separated from blood by centrifugation (1750 g) at 4°C for 20 min. Liver and adipose tissues (epididymal+abdominal) from each animal were excised and weighed. The liver was stored at −80°C, and adipose tissue was immediately used for further analysis.
Determination of plasma glucose and insulin concentrations and insulin resistance
Plasma glucose was determined by using an enzymatic kit purchased from Audit Diagnostics (Cork, Ireland, United Kingdom). Plasma insulin was determined using a rat insulin enzyme-linked immunosorbent assay (ELISA) kit (Mercodia, Uppsala, Sweden). The homeostasis model assessment equation for insulin resistance (HOMA-IR) was expressed as an index of insulin resistance. 21 It was calculated by the following formula: HOMA-IR=(fasting glucose [in mmol/L]×fasting insulin [in μU/mL])/22.5.
Determination of plasma adiponectin, leptin, TNF-α, IL-6, and GLP-1 concentrations
Plasma adiponectin and leptin levels were determined using rat ELISA kits (from Chemicon International [Billerica, MA, USA] and Assay Designs [Ann Arbor, MI, USA], respectively). The plasma TNF-α level was determined with a rat TNF-α ELISA kit (R&D Systems, Minneapolis, MN, USA). The plasma IL-6 level was determined using a recombinant rat IL-6 ELISA kit (IBL Co., Gunma, Japan). The plasma GLP-1 concentration was measured using an enzymatic kit purchased from Linco Research (St. Charles, MO, USA).
Determination of lipid metabolism markers in adipocytes
The lipolysis rate was analyzed according to the procedure of Berger and Barnard. 26 Because adipose tissue has a very low level of glycerol kinase, glycerol release is a valid index of the lipolysis rate and thus of hormone-sensitive lipase activity. Fat pads (epididymal+retroperitoneal) were rinsed in a 0.85% NaCl solution, patted dry, and weighed, and then 0.5 g was added to 1.0 mL of prewarmed Krebs–Ringer's bicarbonate buffer and incubated at 37°C for 1 h. After incubation, the reaction mixture was centrifuged at 100 g at room temperature for 30 s to separate fat cells from the medium. The resulting supernatant was used to determine the glycerol content (Randox Diagnostic, Crumlin, Northern Ireland, United Kingdom). Adipose tissue heparin-triggered lipoprotein lipase (LPL) activity was measured according to Murase et al. 27 A specimen of adipose tissue weighing 100 mg was minced into small pieces and placed in KRB buffer (pH 7.4) in the presence of heparin for 60 min at 37°C. LPL activity was then assayed using p-nitrophenyl butyrate as the probe substrate, and the rate of p-nitrophenol released from the incubation medium was measured. To determine the triglyceride content in adipose tissue, lipids were extracted from epididymal fat tissue by the method of Folch et al., 28 and the triglyceride content in the extract was determined using an enzymatic kit purchased from Audit Diagnostics).
Flow cytometric analysis of adipocytes from epididymal fat tissue
Adipocytes were isolated from epididymal fat tissue by the methods of Bernstein et al. 29 and Maroni et al. 30 Fat pads were pooled by group, minced, and incubated at 37°C in a shaking water bath for 30 min in Krebs–Ringer's bicarbonate buffer containing 0.1% collagenase (type II, Sigma). Subsequently, adipocytes were gently filtered through nylon mesh (pore size, 300 μm) and centrifuged at 100 g for 10 min. A solution of 0.5 mg/mL Nile red (Sigma) was prepared in acetone, added to adipocytes, and incubated at 25°C for 30 min in the dark. Adipocyte lipid accumulation was evaluated using a flow cytometer (BD Biosciences, Franklin Lakes, NJ, USA). Dot plots of side scatter versus forward scatter of adipocytes were generated from flow cytometric analysis of the level of granularity in different groups. Forward scatter represents the cell size, whereas side scatter represents cytoplasmic granular intensity.
RNA extraction and real-time quantitative polymerase chain reaction
Total RNA was prepared from liver tissue with Tri-zol® solution (MDBio, Piscataway, NJ, USA) according to the manufacturer's instructions. The RNA concentration was determined by measuring the absorbance at 260–280 nm. Total RNA was reverse-transcribed using TaqMan® reverse transcription reagents (Applied Biosystems, Foster City, CA, USA) to generate cDNA and stored at −20°C until use. The relative expression of PPARα was determined by an iQ™5 real-time polymerase chain reaction detection system (Bio-Rad, Hercules, CA, USA), and amplification was done by using SYBR® Green I detection (SYBR Green JumpStart™, Taq ReadyMix™ for quantitative polymerase chain reaction, Sigma-Aldrich, St. Louis). Oligonucleotide primers, used for the mRNA analysis, were based on the sequences of rat genes in the GenBank database. The relative expression level of PPARα in mRNA was normalized by using β-actin as the internal standard.
Statistical analysis
Results are given as the mean±SD values. Statistical differences among groups were calculated by analysis of variance (SPSS for Windows version 10.0.7C, SPSS, Chicago, IL, USA), and group means were considered to significantly differ at P<.05 by independent-sample t test.
Results
Body and adipose tissue weights
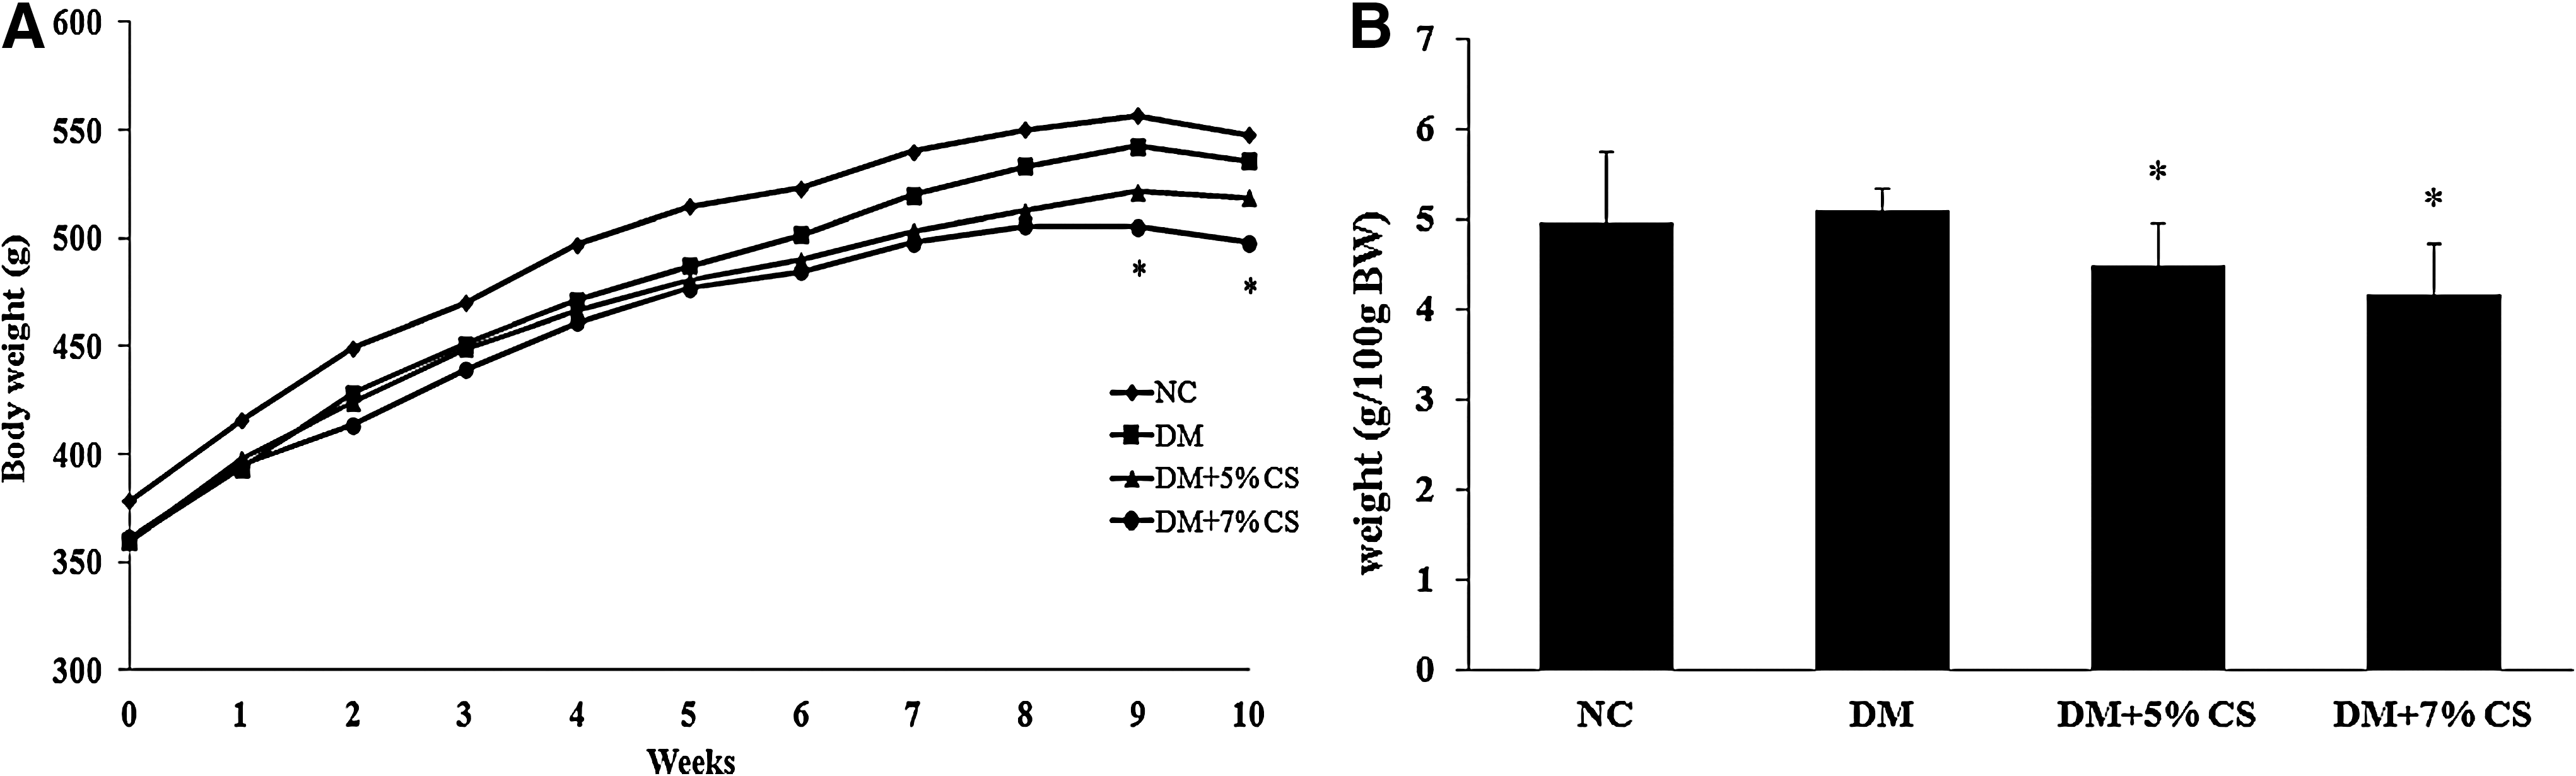
After 10 weeks of treatment, body weights had not changed between the NC and DM groups (Fig. 1). Significantly decreased body weight was only observed in diabetic rats fed the 7% CS diet (DM+7% CS vs. DM). The relative adipose tissue weight (epididymal+retroperitoneal) did not change between the NC and DM groups. However, chitosan feeding resulted in significantly decreased relative adipose tissue weights in diabetic rats. Food intake was significantly reduced (–7.4%) in DM rats fed the 7% CS diet (data not shown). Moreover, lower liver weights were also observed in diabetic rats fed the 5% CS (–23%) and 7% CS (–32%) diets.
Effects of chitosan on
Plasma glucose and insulin concentrations and insulin resistance
Plasma glucose levels significantly decreased in diabetic rats treated with 5% chitosan, but only the 7% chitosan treatment reduced plasma insulin levels (Table 2). Lower HOMA-IR was found in diabetic rats fed both chitosan diets. TNF-α and IL-6 levels were significantly higher in DM rats, indicating that systemic inflammation was higher in those animals (Table 3). Diabetic rats fed the 5% and 7% chitosan diets displayed lower TNF-α and IL-6 levels. A significantly lower plasma leptin concentration was noted in diabetic rats fed the 7% chitosan diet. In addition, significantly higher plasma adiponectin levels were observed in diabetic rats fed the chitosan diets. Plasma GLP-1 levels only increased in diabetic rats fed the 7% chitosan diet (Fig. 2).
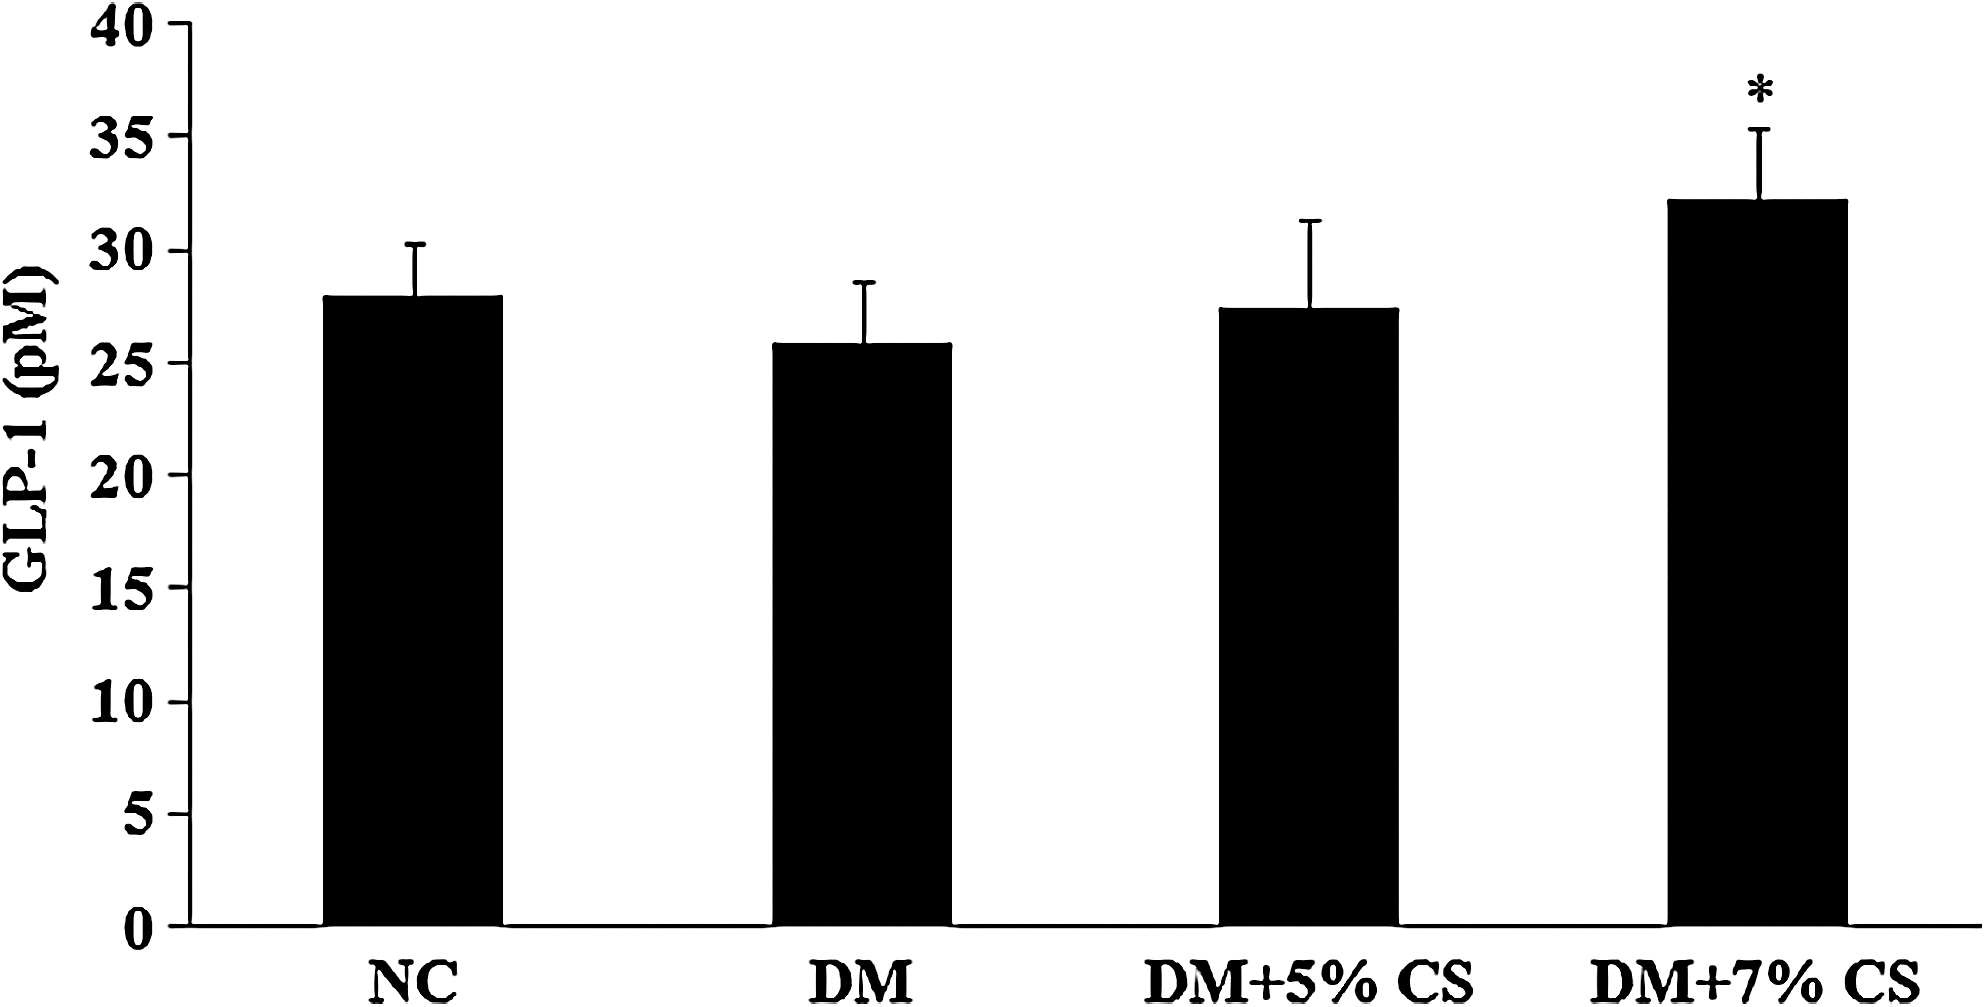
Effects of chitosan on plasma glucagon-like peptide-1 (GLP-1) concentration in diabetic rats. NC and DM rats were fed diets without or with chitosan (5% or 7%) supplements for 10 weeks. Data are mean±SD values (n=9 or 10). *P<.05, DM versus DM+5% CS or DM+7% CS.
NC and DM rats were fed diets with or without chitosan (5% or 7%) supplements for 10 weeks. Data are mean±SD values (n=9 or 10).
P<.05, DM versus DM+5% CS or DM+7% CS; ** P<.05, NC versus DM.
Homeostasis model assessment equation for insulin resistance (HOMA-IR) was calculated as (fasting plasma glucose concentration [in mmol/L]×fasting plasma insulin concentration [in μU/L])/22.5.
NC and DM rats were fed diets with or without chitosan (5% or 7%) supplements for 10 weeks. Data are mean±SD values (n=9 or 10).
P<.05, DM versus DM+5% CS or DM+7% CS; ** P<.05, NC versus DM.
IL-6, interleukin-6; TNF-α, tumor necrosis factor-α.
Hepatic cholesterol and triglyceride contents
In this study, diabetes increased total cholesterol without changing the triglyceride content of the liver. However, diabetic rats fed the 5% and 7% chitosan diets displayed decreased cholesterol and triglyceride contents in livers (Table 4). These results indicate that chitosan feeding can reduce hepatic lipid accumulation in diabetic rats.
NC and DM rats were fed diets with or without chitosan (5% or 7%) supplements for 10 weeks. Data are mean±SD values (n=9 or 10).
P<.05, DM versus DM+5% CS or DM+7% CS; ** P<.05, NC versus DM.
Lipolysis rate, LPL activity, and triglyceride content in adipose tissues
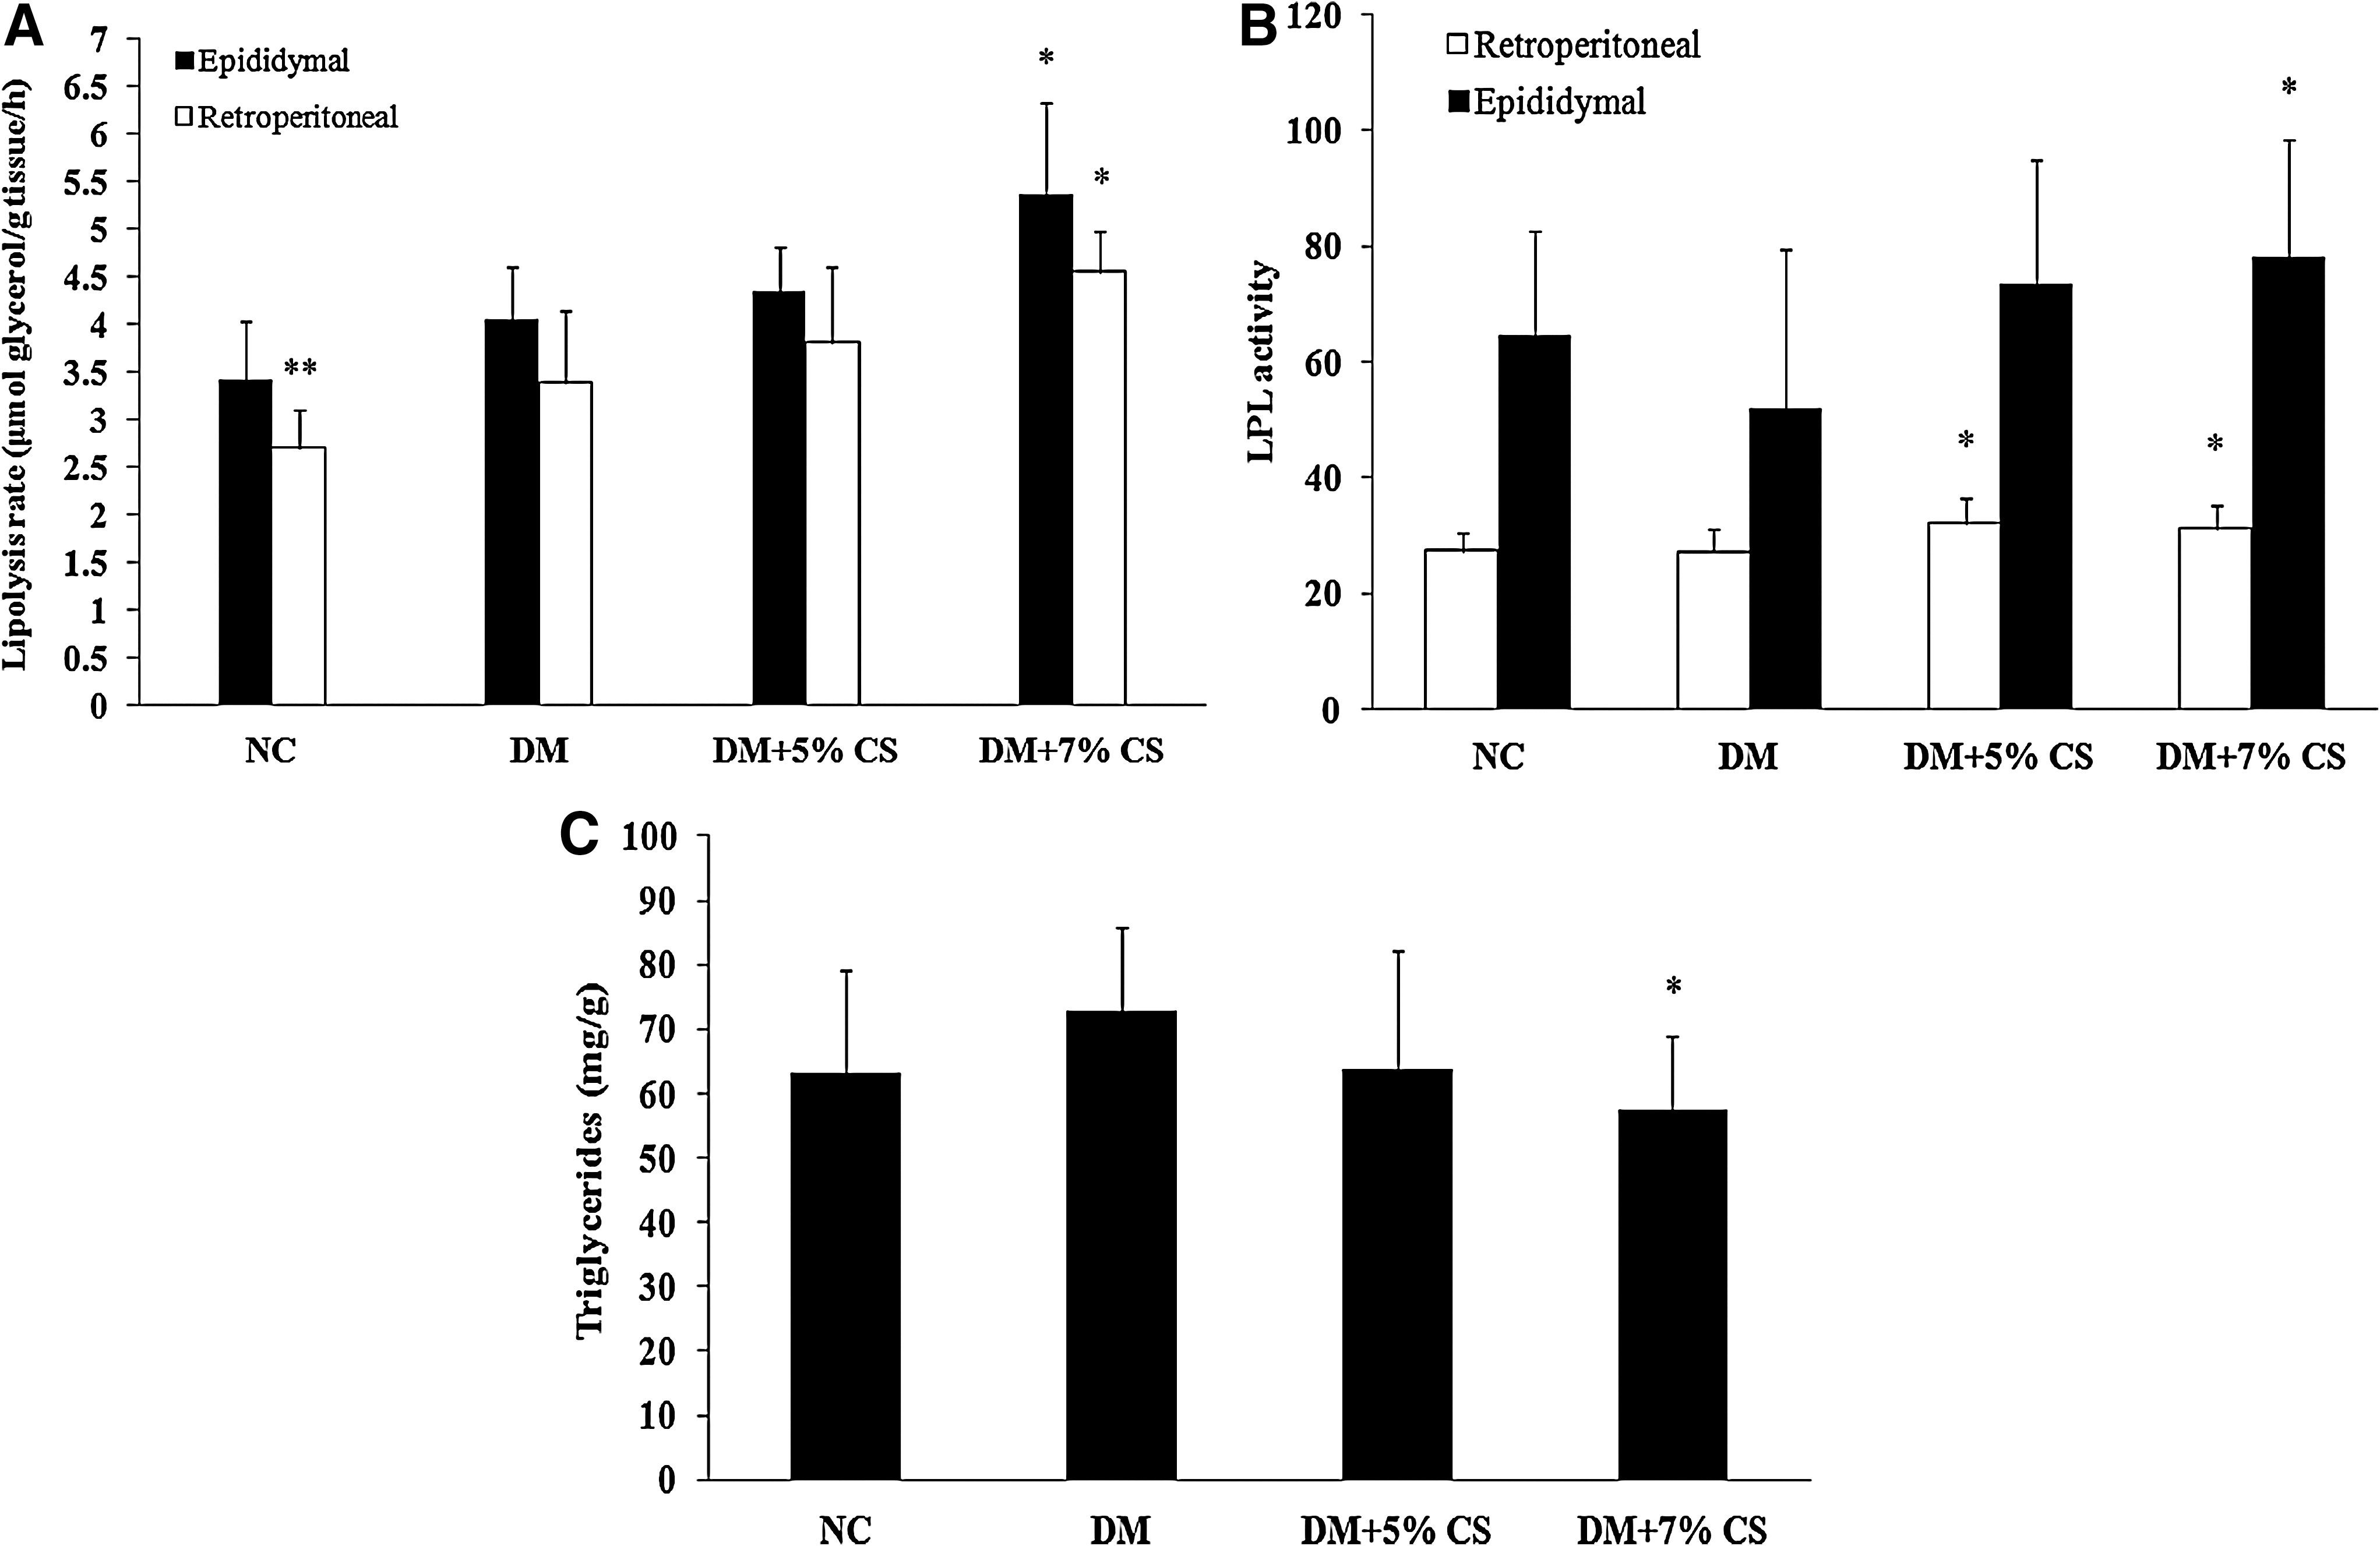
The lipolysis rate of retroperitoneal fat pads was markedly decreased in the NC group compared with the DM group. No significant differences in lipolysis rates of epididymal fat pads were found among the groups. However, statistically significant increases in lipolysis rates in retroperitoneal and epididymal fat pads were observed in diabetic rats fed the 7% chitosan diet (Fig. 3A). The LPL activity of retroperitoneal fat pads was significantly increased in diabetic rats fed the 5% and 7% chitosan diets. In addition, the increase in LPL activity in epididymal fat pads was only observed in diabetic rats fed the 7% chitosan diet (Fig. 3B). The triglyceride content of epididymal fat pads decreased in diabetic rats treated with 7% chitosan (Fig. 3C).
Effects of chitosan on
Lipid accumulation in adipocytes
The granular intensity of adipocytes from epididymal fat pads increased in diabetic rats. Dietary supplementation with 7% chitosan for 10 weeks markedly reduced the granular intensity of adipocytes in diabetic rats (Fig. 4).
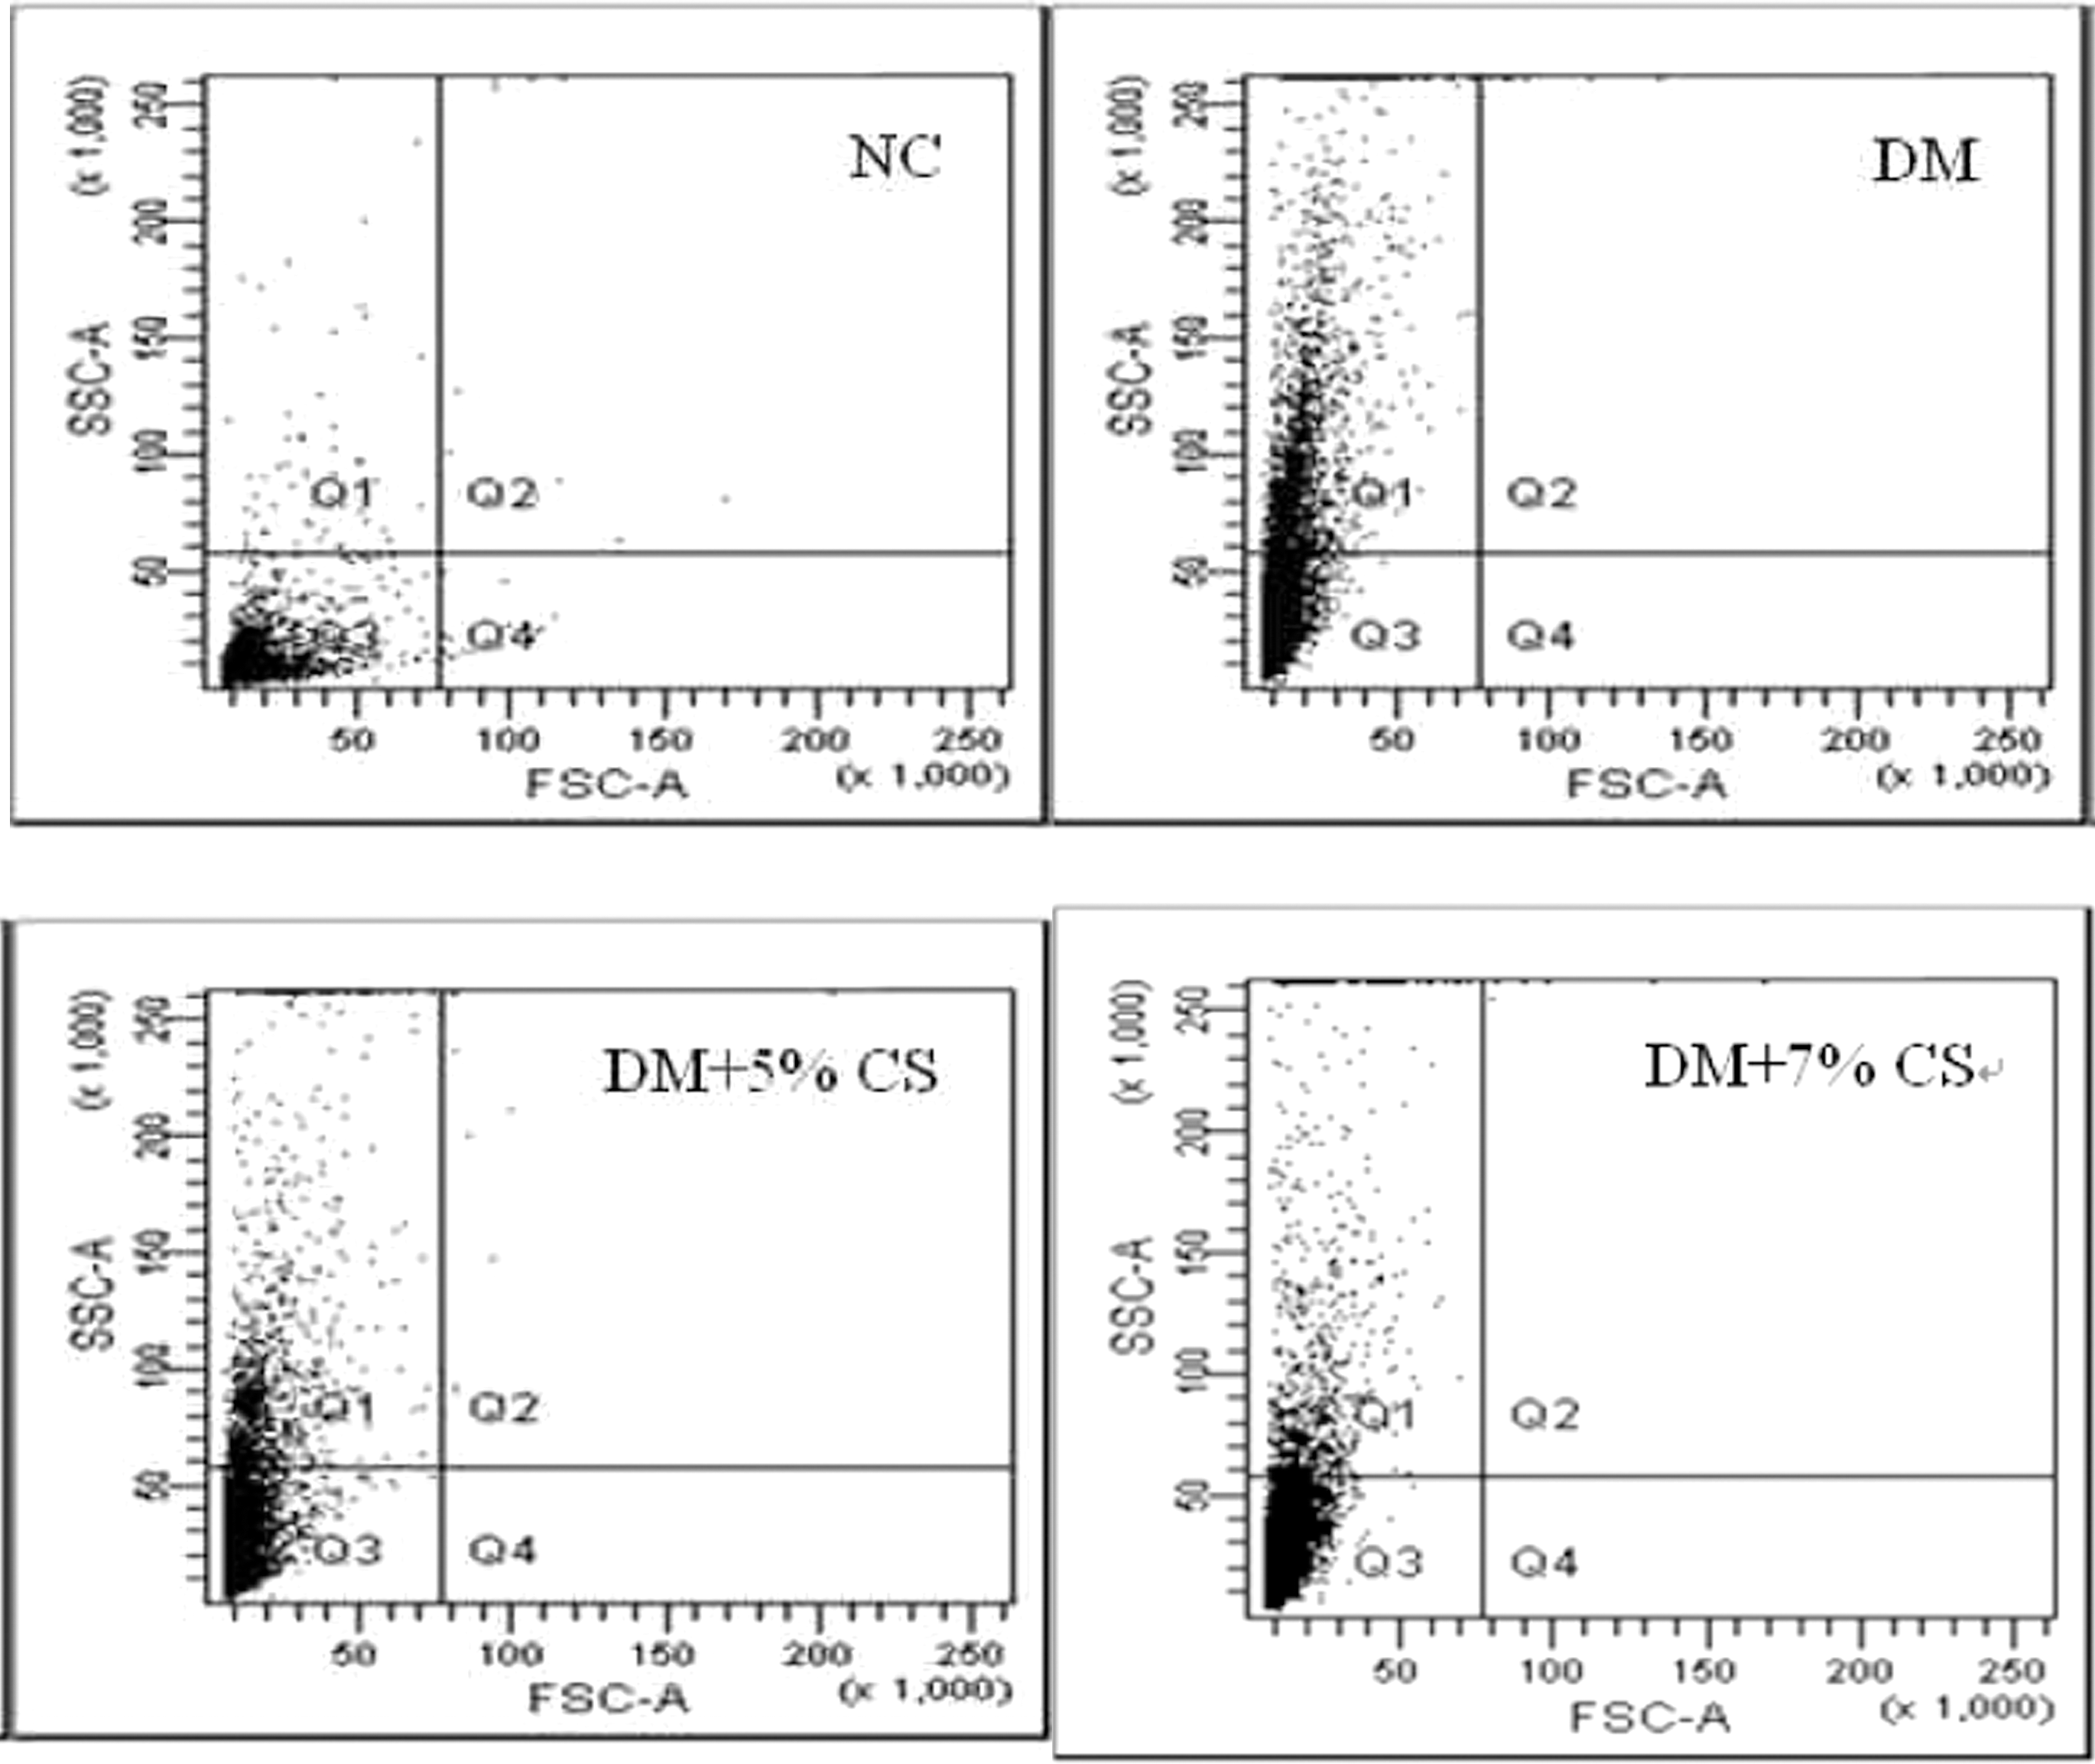
Effects of chitosan on the granularity of adipocytes from epididymal tissues of diabetic rats. NC and DM rats were fed diets without or with chitosan (5% or 7%) supplements for 10 weeks. FSC, forward scatter; SSC, side scatter.
Hepatic PPARα gene expression
PPARα gene expression was up-regulated in a dose-dependent manner in livers of diabetic rats fed the chitosan diets (Fig. 5).
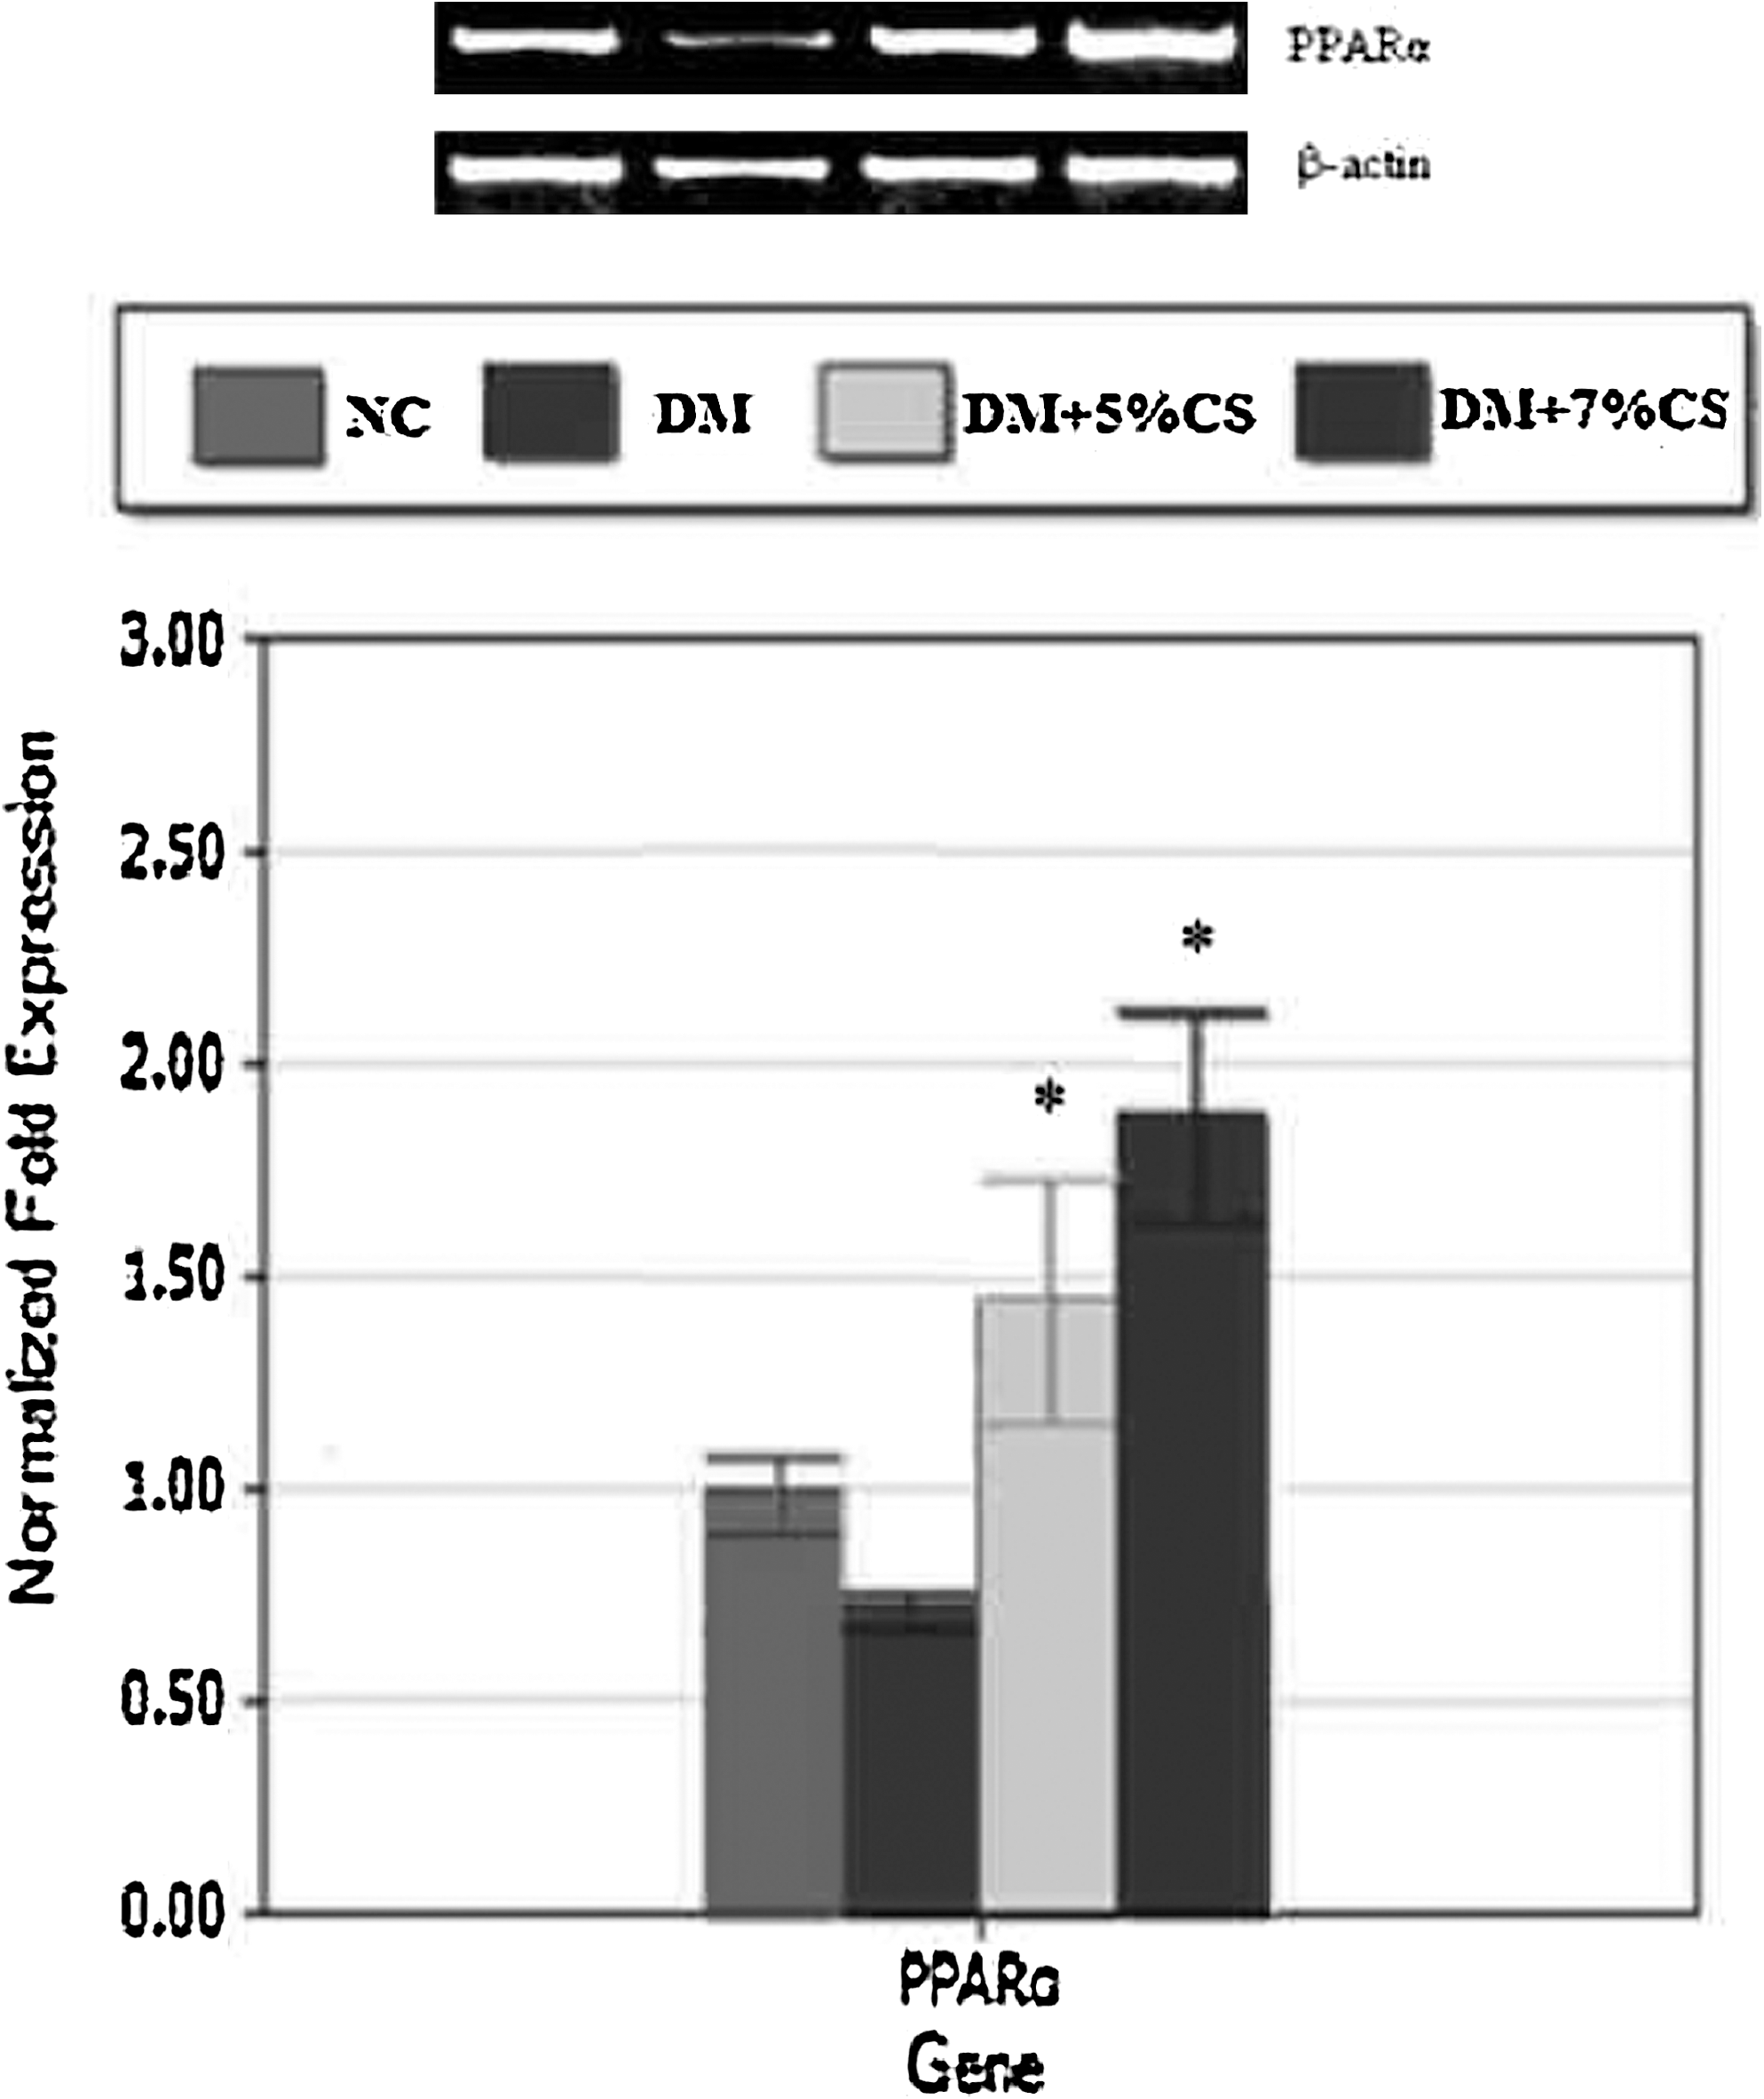
Effects of chitosan on hepatic peroxisomal proliferator-activated receptor (PPAR) α mRNA expression in diabetic rats. NC and DM rats were fed diets without or with chitosan (5% or 7%) supplements for 10 weeks. Data are mean±SD values (n=9 or 10). *P<.05, DM versus DM+5% CS or DM+7% CS.
Discussion
This study demonstrates that feeding diabetic rats fed 5% or 7% chitosan for 10 weeks decreases lipid accumulation in liver and adipose tissues and reduced plasma adipocytokines (i.e., lower TNF-α and IL-6). These observations were more pronounced in diabetic rats fed the 7% chitosan diet. Reduced body weight and adipocyte hypertrophy caused by chitosan might be partly explained by enhanced lipolysis of adipose tissues. Our results suggest that the elevated plasma GLP-1 level and hepatic PPARα expression after chitosan treatment might partly be attributed to lower lipid accumulation in liver and adipose tissues and thus ameliorated insulin resistance in the diabetic rats.
Chitosan has been shown to improve insulin sensitivity in obese subjects and to decrease weight, body mass index, and waist circumference; 31 however, the exact mechanism remains unclear. Studies indicate that visceral fat accumulation due to adipocyte hypertrophy induces the secretion of leptin, IL-6, and TNF-α in adipocytes involved in insulin resistance. 32 –34 In contrast, adiponectin is secreted by adipose tissue that has decreased hepatic glucose output and anti-inflammatory properties and increased insulin-sensitizing actions. 4 In this study, chitosan feeding significantly decreased plasma leptin, IL-6, and TNF-α and increased plasma adiponectin levels in diabetic rats. These observations are consistent with the previous report that chitosan counteracts some inflammatory disorders occurring in high-fat diet-induced obese mice. 35 In addition, lower plasma glucose, insulin, and HOMA-IR levels were observed in animals fed the chitosan diets. Therefore, our data suggested that chitosan could reduce chronic inflammation and thus may contribute to improving insulin resistance in diabetic rats.
Several earlier studies reported that administration of >7% chitosan to animals decreased food intake and increased fecal fat excretion, resulting in reduced average daily energy intake and body weight gain. 36,37 The present study showed that lower adipose tissue weights occurred in diabetic rats fed chitosan diets, but only the 7% chitosan diet reduced body weight and food intake. Although we did not measure fecal fat content in this study, in our previous study, a higher fecal fat excretion was observed in rats fed the same diet (7% chitosan). 22 Increased fecal fat accompanied with or without bile acid excretion due to interference with intestinal micelle formation was proposed to be the mechanism responsible for the hypolipidemic effect. 38,39 In addition, an increased plasma GLP-1 level in diabetic rats was observed in the 7% chitosan group. Administering GLP-1 to humans and rodents induces satiety and decreased caloric intake, leading to reduced weight gain. 40,41 These results suggest the possibility that diabetic rats fed a diet containing up to 7% chitosan decreased caloric intake and delayed gastric emptying through GLP-1 regulation, resulting in lower body and adipose tissue weights.
Hormonal-sensitive lipase is a key enzyme for hydrolysis of stored triacylglycerol to monoacylglycerol and free fatty acids 42 and is stimulated by GLP-1. 43 It is noteworthy that the 7% chitosan diet increased the lipolysis rate of adipose tissue and decreased the granular structure and triglyceride content of adipocytes in diabetic rats. Thus, the increased lipolysis rate of adipocytes after 7% chitosan feeding may have contributed to the stimulatory effect of GLP-1. On the other hand, LPL plays a pivotal role in lipoprotein metabolism by catalyzing the hydrolysis of triglyceride-rich lipoproteins and uptake of free fatty acids into adipocytes. It is an important mediator for maintaining whole-body energy homeostasis and fat accumulation in adipose tissues. 44,45 In the present study, we found that chitosan markedly reversed the decrease in LPL levels in adipose tissues of diabetic rats (Fig. 3B). This finding indicates that chitosan might increase the uptake and catabolism of fatty acids in adipose tissues.
GLP-1 is the strongest potentiator of glucose-induced insulin secretion. 10,11 Administration of GLP-1 increased insulin sensitivity in the liver and reduced hepatic expression of phosphoenolpyruvate carboxykinase in ob/ob mice. 46 Chitosan is shown to reduce hepatic phosphoenolpyruvate carboxykinase expression in diabetic rats. 21 Therefore, previous studies and our data suggest that increased plasma GLP-1 levels after 7% chitosan treatment may increase insulin-mediated glucose uptake and reduce gluconeogenesis in the liver. Furthermore, our results also showed that lower plasma glucose (–12%) and higher insulin (+44%) levels 60 min after a meal were observed in diabetic rats fed the 7% chitosan diet for 9 weeks (data not shown). Therefore, our results suggest that the increase in plasma GLP-1 levels after 7% chitosan feeding in diabetic rats might lead to lower food intake and postmeal glucose levels, possibly further contributing to the decreases in hyperglycemia and insulin resistance in type 2 DM.
PPARα is a regulator of key genes involved in fatty acid oxidation in the liver. It is known that PPARα activation leads to increased fatty acid oxidation and an inhibition of lipid accumulation in liver and muscle tissues of insulin-resistant rats. 8,47 In the present study, chitosan reduced hepatic lipid accumulation and dose-dependently elevated PPARα expression in livers of diabetic rats. Reduced hepatic lipid accumulation and inflammation due to enhanced hepatic PPARα expression may ameliorate insulin resistance. 5,6 Therefore, our data suggest that chitosan may up-regulate PPARα expression in the liver, which may increase fatty acid oxidation, resulting in a lower accumulation of lipids and insulin resistance in livers of diabetic rats. However, as stated above, the increased GLP-1 and decreased inflammatory cytokine production after chitosan treatment might also help ameliorate insulin resistance in diabetic rats.
In conclusion, the present study demonstrates that long-term administration of chitosan may reduce insulin resistance by suppressing lipid accumulation in liver and adipose tissues and ameliorate chronic inflammation in diabetic rats. Our results further suggest that chitosan possesses the ability to alleviate insulin resistance and lipid accumulation in liver and adipose tissues through increased GLP-1 secretion and hepatic PPARα expression. Because chitosan acts as a dietary fiber in the gastrointestinal tract, the modulations of glucose and lipid metabolism by chitosan may be a consequence of impaired dietary fat absorption in the small intestine and changes in fermentation or microflora composition in large intestine. Further studies will be needed to investigate these possibilities.
Footnotes
Acknowledgment
This study was financially supported by the Grant-aid (NSC 99-2311-B-019-011-MY3) of National Science Council, Taiwan.
Author Disclosure Statement
No competing financial interests exist.