
Abstract
Grains of sugary rice were extracted with 80% aqueous methanol, and the concentrated extracts were successively partitioned using ethyl acetate, n-butanol, and water. From the n-butanol fractions, four flavonoid glycosides were isolated through repeated silica gel, octadecyl silica gel, and Sephadex LH-20 column chromatographies. Based on the nuclear magnetic resonance, mass spectrometry, and infrared spectroscopic data, the chemical structures of the compounds were determined to be taxifolin-7-O-β-
Introduction
D
The health benefits of whole rice have been attributed to its complex carbohydrates, vitamins, minerals, and other phytochemical constituents. 6 Alternatively, sugary rice is a whole grain with applications in processed food, especially cereal, due to its sucrose and glucose contents and unique taste. However, little is known about the physiological properties and phytochemical components of this new type of rice. 5 Methanol (MeOH) extracts of common rice grain and rice hull have been used to enhance the stability of ground beef, implying their role as effective antioxidants. 7 With the exception of sugar content, 5 the specific antioxidants in sugary rice have not been identified. The primary aims of this study were to evaluate the antioxidant properties of sugary rice and to identify specific compounds responsible for the antioxidant activity. The contents of the active compounds of rice extracts were then correlated with antioxidant activity.
Materials and Methods
Plant material
The sugary rice (5 kg) was supplied in January 2009 by the Department of Functional Crop, Korean National Institute of Crop Science, Rural Development Administration in Miryang, Korea (YR55412-7 lines). A voucher specimen (number KHU09-0101) was preserved at the Laboratory of Natural Products Chemistry, Kyung Hee University, Yongin, Korea.
Instrumental analyses
Optical rotations were measured on a JASCO (Tokyo, Japan) model P-1010 digital polarimeter. Ultraviolet (UV) spectra were measured on a Shimadzu (Kyoto, Japan) model UV-1601 spectrophotometer. Fast atom bombardment (FAB)-mass spectrometry (MS) spectra were recorded on a JEOL (Tokyo) model JMS-700 spectrometer. Infrared (IR) spectra were run on a Perkin Elmer (Beaconsfield, United Kingdom) Spectrum One FT-IR spectrometer. 1H-Nuclear magnetic resonance (NMR) (400 MHz) and 13C-NMR (100 MHz) spectra were taken on a Varian (Lake Forest, CA, USA) Unity Inova AS 400 FT-NMR spectrometer.
Extraction and isolation procedure
The dried and powdered rice grains were extracted three times with 80% aqueous MeOH (5 L×3) at room temperature. The extracts were successively partitioned with water (1 L), ethyl acetate (EtOAc) (1 L×3), and n-butanol (n-BuOH) (0.8 L×3). Then the n-BuOH fraction (DMB) (30 g) was applied to silica gel (60A, 70–230 mesh ASTM, Merck, Darmstadt, Germany) column (10×60 cm) chromatography, eluted with CHCl3-MeOH-H2O (by volume, 9:3:1→8:3:1→7:3:1→65:35:10, each 3 L), and monitored via thin-layer chromatography (TLC) to provide 21 fractions (DMB-1–DMB-21). Fraction DMB-4 (elution volume/total volume [V
e/V
t], 0.21–0.25; 900 mg) was applied to a silica gel column (3×20 cm) and eluted with CHCl3-MeOH-H2O (12:3:1 by volume, 3 L) to provide 10 subfractions (DMB-4-1–DMB-4-10). Subfraction DMB-4-7 (V
e/V
t, 0.78–088; 191 mg) was subjected to octadecyl silica gel (ODS) (Merck) column (2.5×7 cm) chromatography and eluted with MeOH-H2O (1:2 vol/vol, 1 L) to yield compound
Physical properties and 1H-NMR data of compounds 1 –4
Compound
13
Compound
Compound
Compound
1,1-Diphenyl-2-picrylhydrazyl radical scavenging activity
Antioxidant activities of isolated compounds were measured on the basis of the scavenging activity of the stable 1,1-diphenyl-2-picrylhydrazyl (DPPH) free radical following the method described by Lee et al. 8
Low-density lipoprotein isolation and oxidation assay
Plasma was obtained from fasted healthy normolipidemic volunteers. The low-density lipoprotein (LDL) was isolated by a standard procedure with a slight modification. 9 The thiobarbituric acid–reactive substances assay of Buege and Aust 10 was used with a slight modification. Consequently, an LDL solution (250 μL, 50–100 μg of protein) in 10 mM phosphate-buffered saline (pH 7.4) was supplemented with 10 μM CuSO4. The oxidation was performed in a screw-capped 5-mL glass vial at 37°C in a shaking water bath. After a 4-h incubation, the reaction was terminated by addition of 1 mL of 20% trichloroacetic acid. Following precipitation, 1 mL of 0.67% thiobarbituric acid in 0.05 N NaOH was added and vortex-mixed, and the final mixture was heated for 5 min at 95°C, cooled on ice, and centrifuged for 2 min at 1000 g. The optical density of the malondialdehyde produced was measured at 532 nm. Calibration was completed with a malondialdehyde standard prepared from tetramethoxypropane.
Extraction and high-performance liquid chromatography conditions
The samples were homogenized to powder using a mill and passed through a 40-mesh sieve. Fine powder was weighed (1 g), extracted in 5 mL of 80% MeOH, and ultrasonically extracted for 1 h at 30°C. The extract was then evaporated under reduced pressure, and the residues were successively partitioned with water (3 mL) and n-BuOH (3 mL). The solution was filtered through a syringe filter (pore size, 0.22 μm) and injected directly into the high-performance liquid chromatography (HPLC) system. HPLC was performed on a 1200 RRLC SL+system (Agilent Technologies, Palo Alto, CA, USA) equipped with a binary solvent delivery system and an autosampler. Chromatographic separations were performed on a Zorbax RRHT C18 column (2.7×100 mm i.d.; particle size, 1.5 μm; Agilent Technologies). The column oven was maintained at 40°C, and the mobile phases consisted of solvent A (0.1% [vol/vol] formic acid in water) and solvent B (0.1% [vol/vol] formic acid in acetonitrile). Optimized liquid chromatography elution conditions were as follows: 0–6 min, 20% B; 6–8 min, 25% B; 8–10 min, 30% B; and 10–15 min, 100% B. The flow rate was 0.5 mL/min. A 5-μL aliquot was injected onto the column using the autosampler.
Calibration of compounds 1 –4
Pure flavonoids
Limits of detection and quantification
The limit of detection (LOD) values were calculated according to the expression 3.3σ/S, where σ is the SD of the response and S is the slope of the calibration curve. The limit of quantification (LOQ) values were established by using the expression 10σ/S. LOD and LOQ were experimentally verified by injections of flavonoids
Results and Discussion
To search for bioactive compounds in sugary rice, the grains were extracted with 80% MeOH and partitioned using several solvents. When the MeOH extract of sugary rice was developed using silica gel TLC, the spots exhibited not only UV absorbance at 254 and 365 nm but also a yellow color when sprayed with a 10% H2SO4 solution and heated, indicating the presence of flavonoids. The MeOH extract was fractionated into an EtOAc layer, an n-BuOH layer, and a H2O layer through solvent fractionation. The repeated silica gel, ODS, and Sephadex LH-20 column chromatographies for the n-BuOH fraction produced four flavonoids, compounds
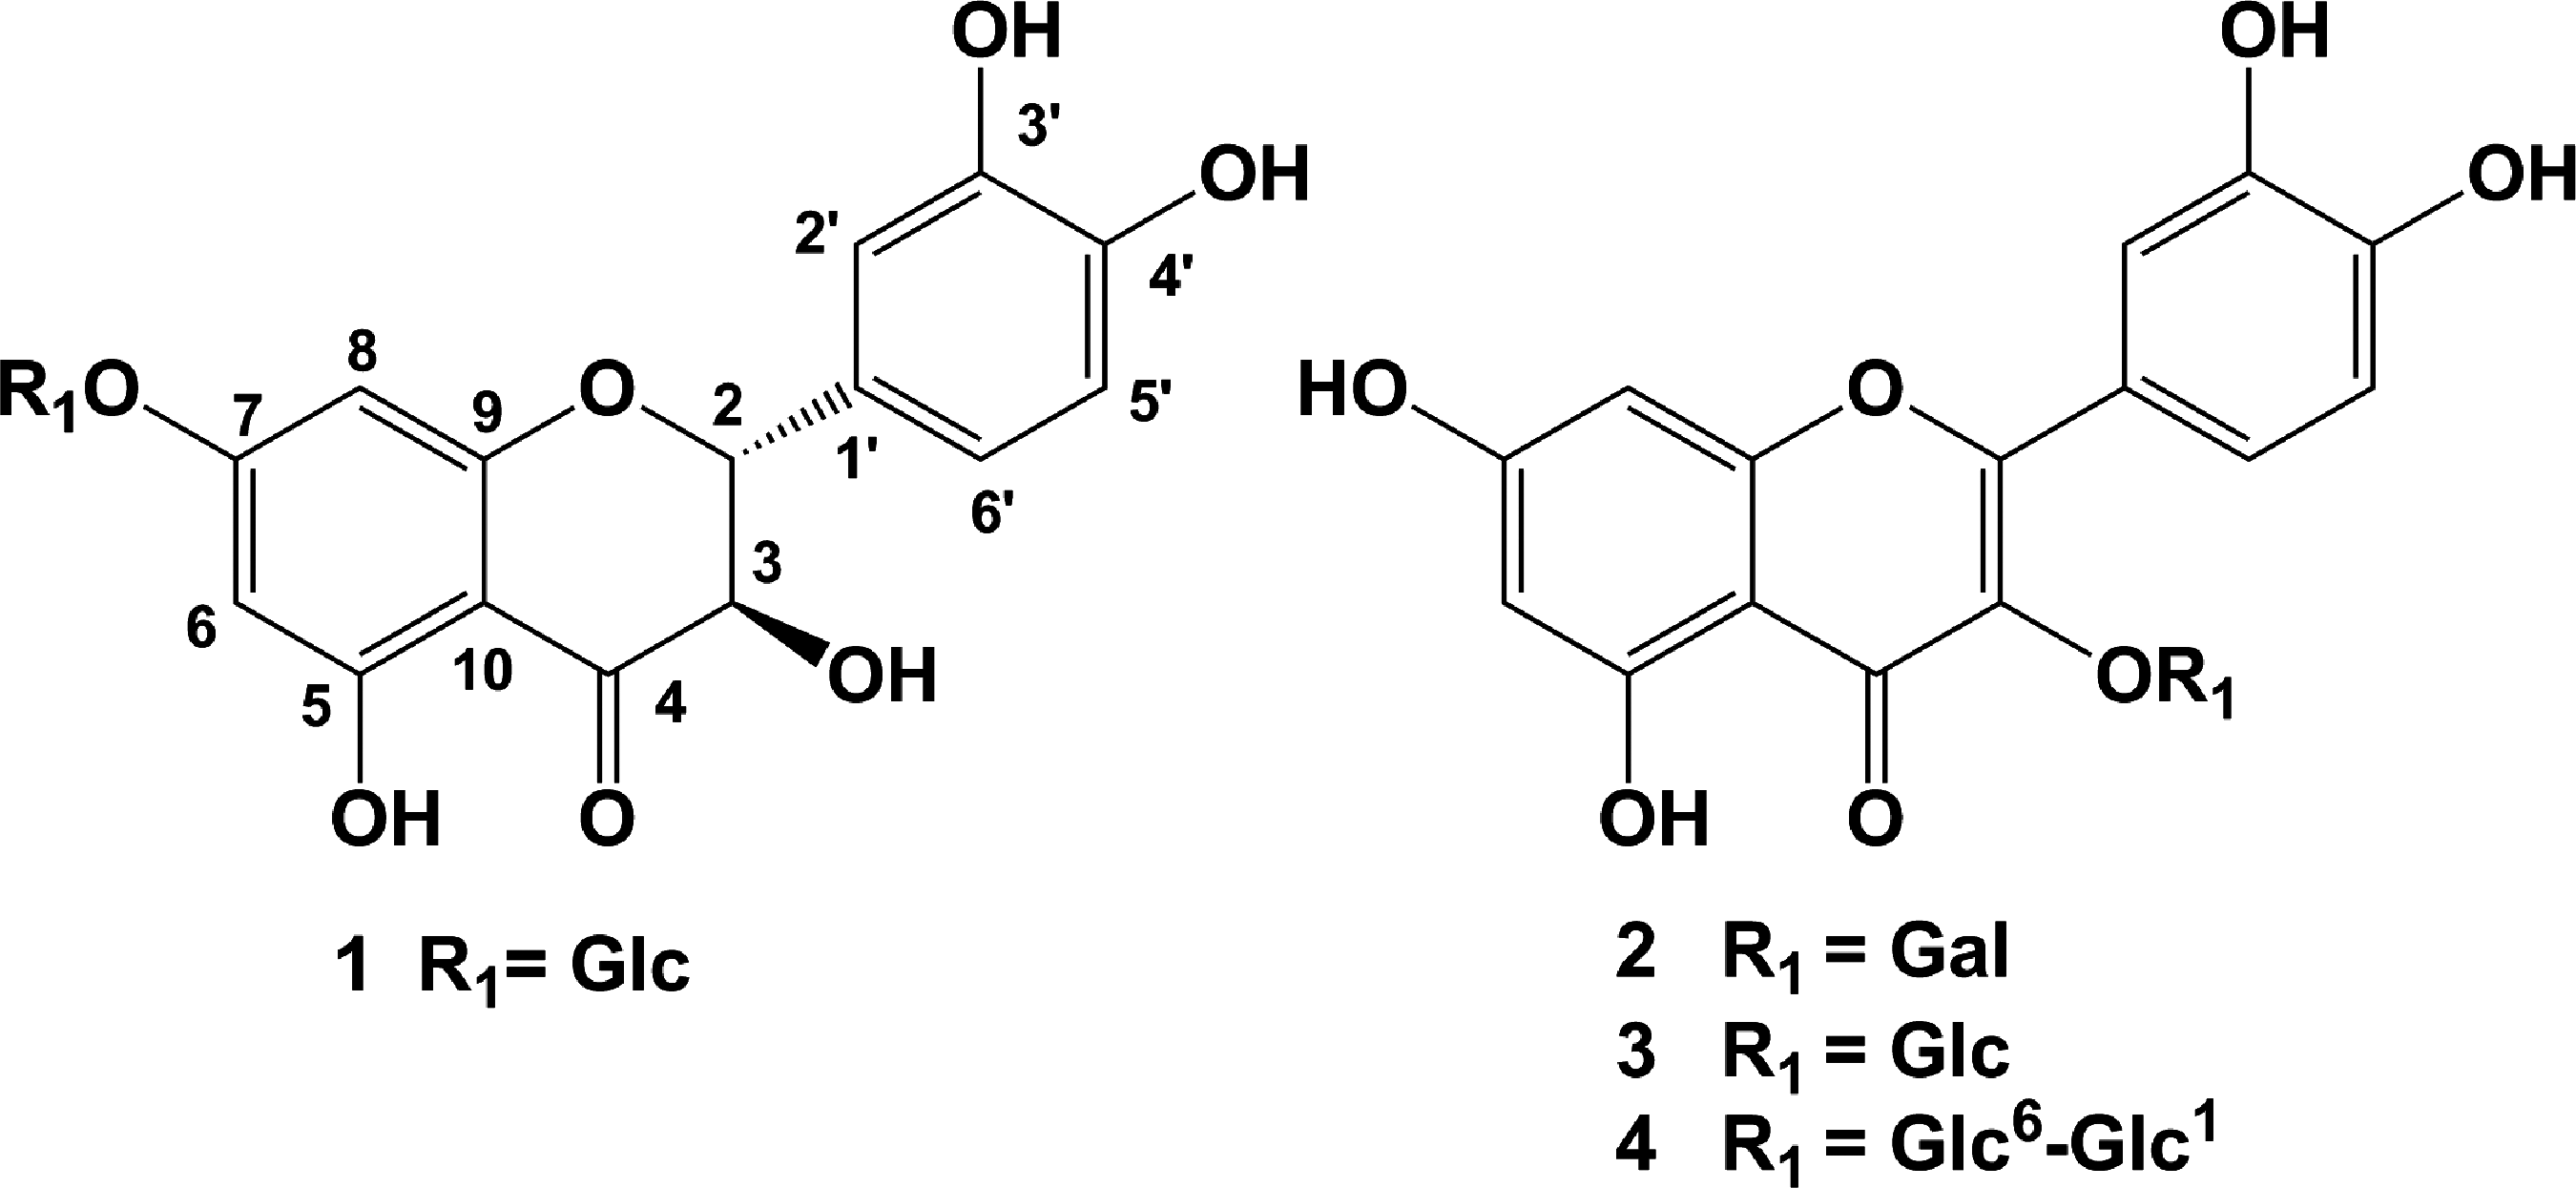
Chemical structures of compounds
Compound
Compound
Compound
Compound
The radical scavenging activities of flavonoid compounds
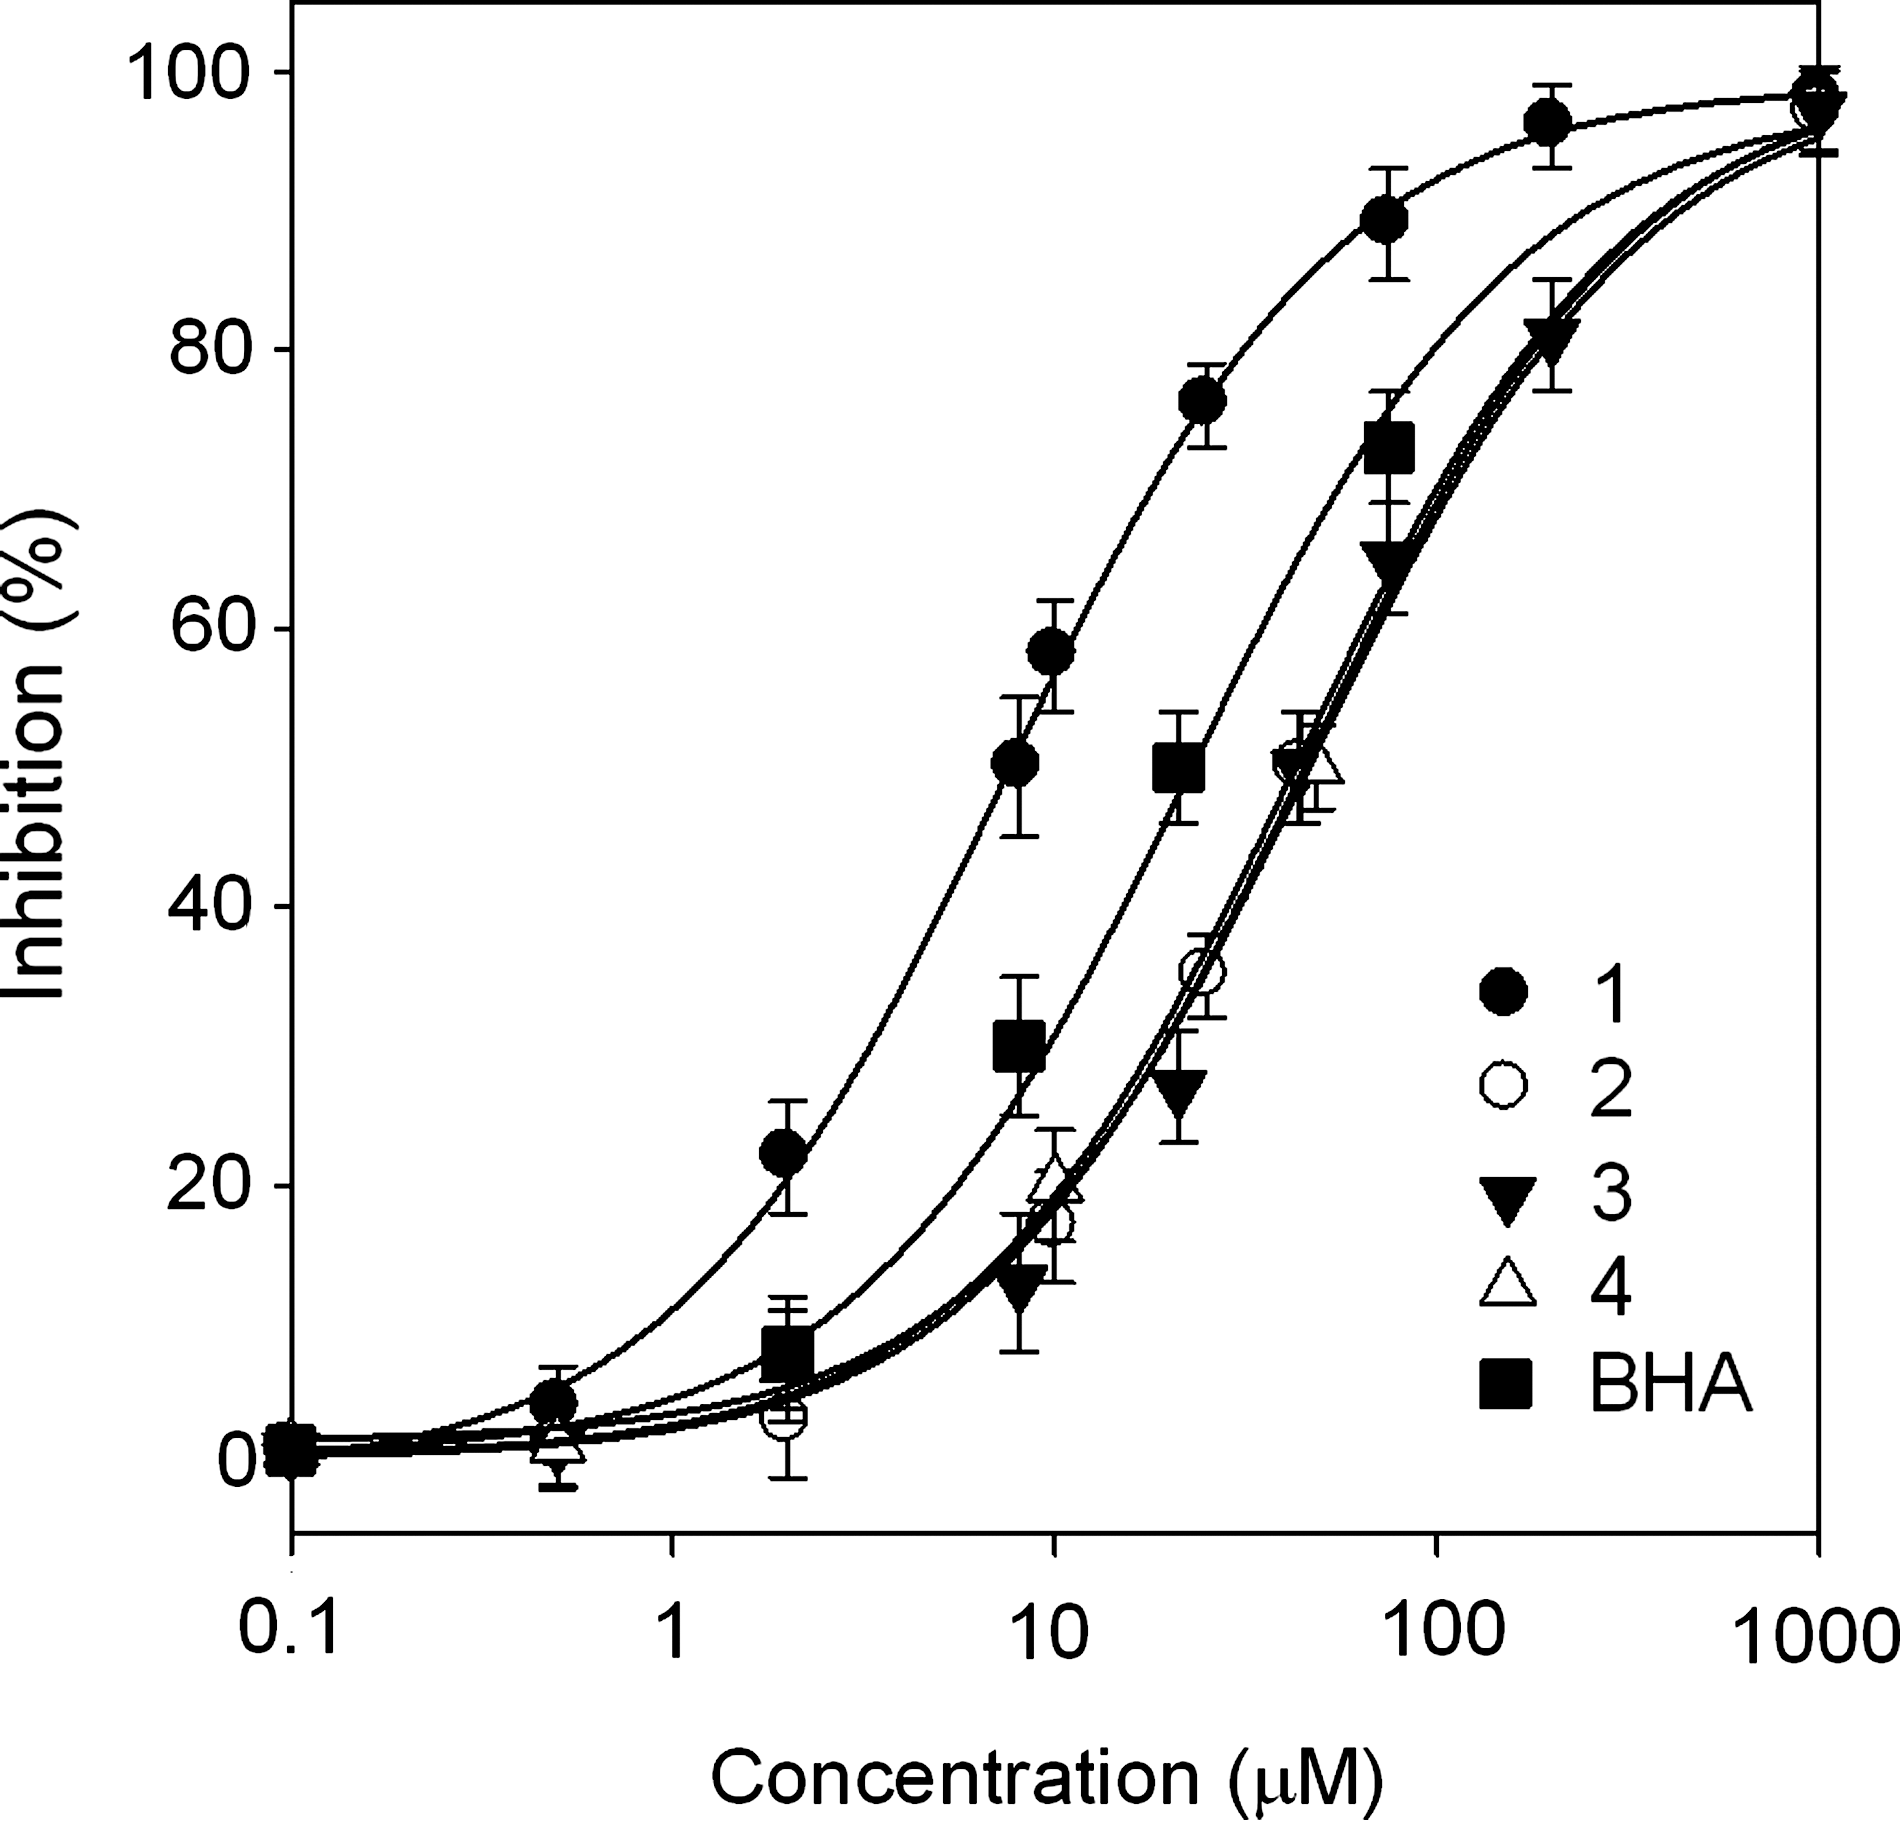
1,1-Diphenyl-2-picrylhydrazyl radical scavenging activities of compounds
The inhibitory activity of compound
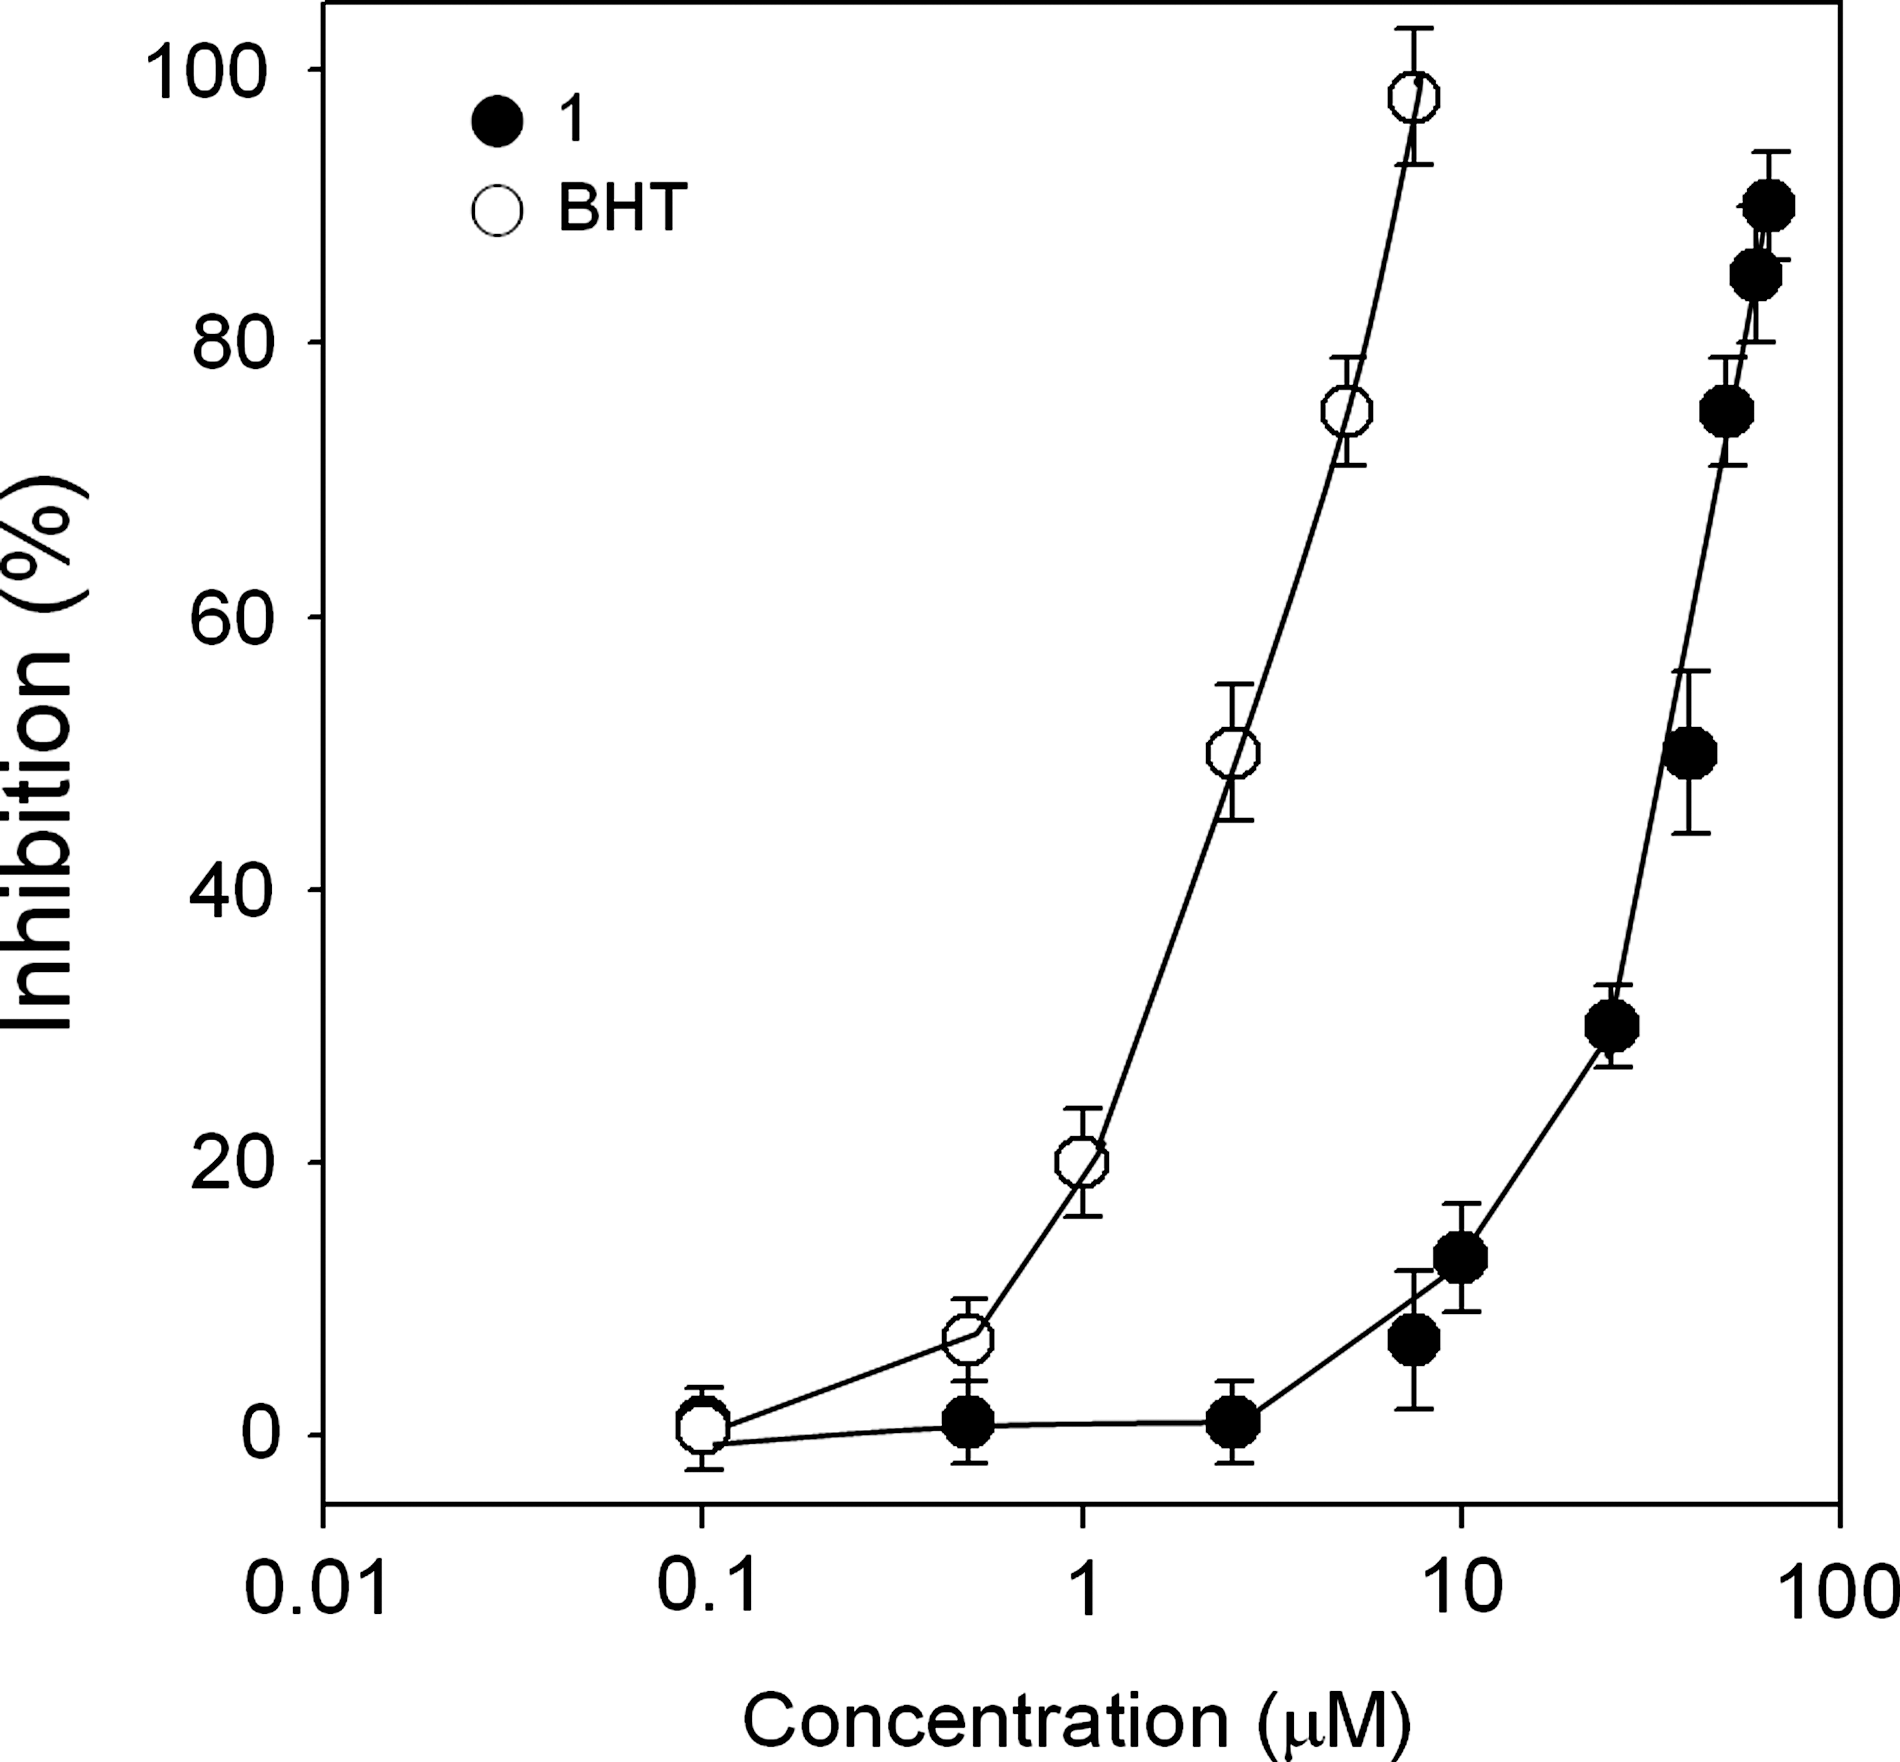
Inhibitory activities of compound
The contents of the flavonoids of rice extracts were then correlated to antioxidant activity. For this reason, quantitative analysis of flavonoids
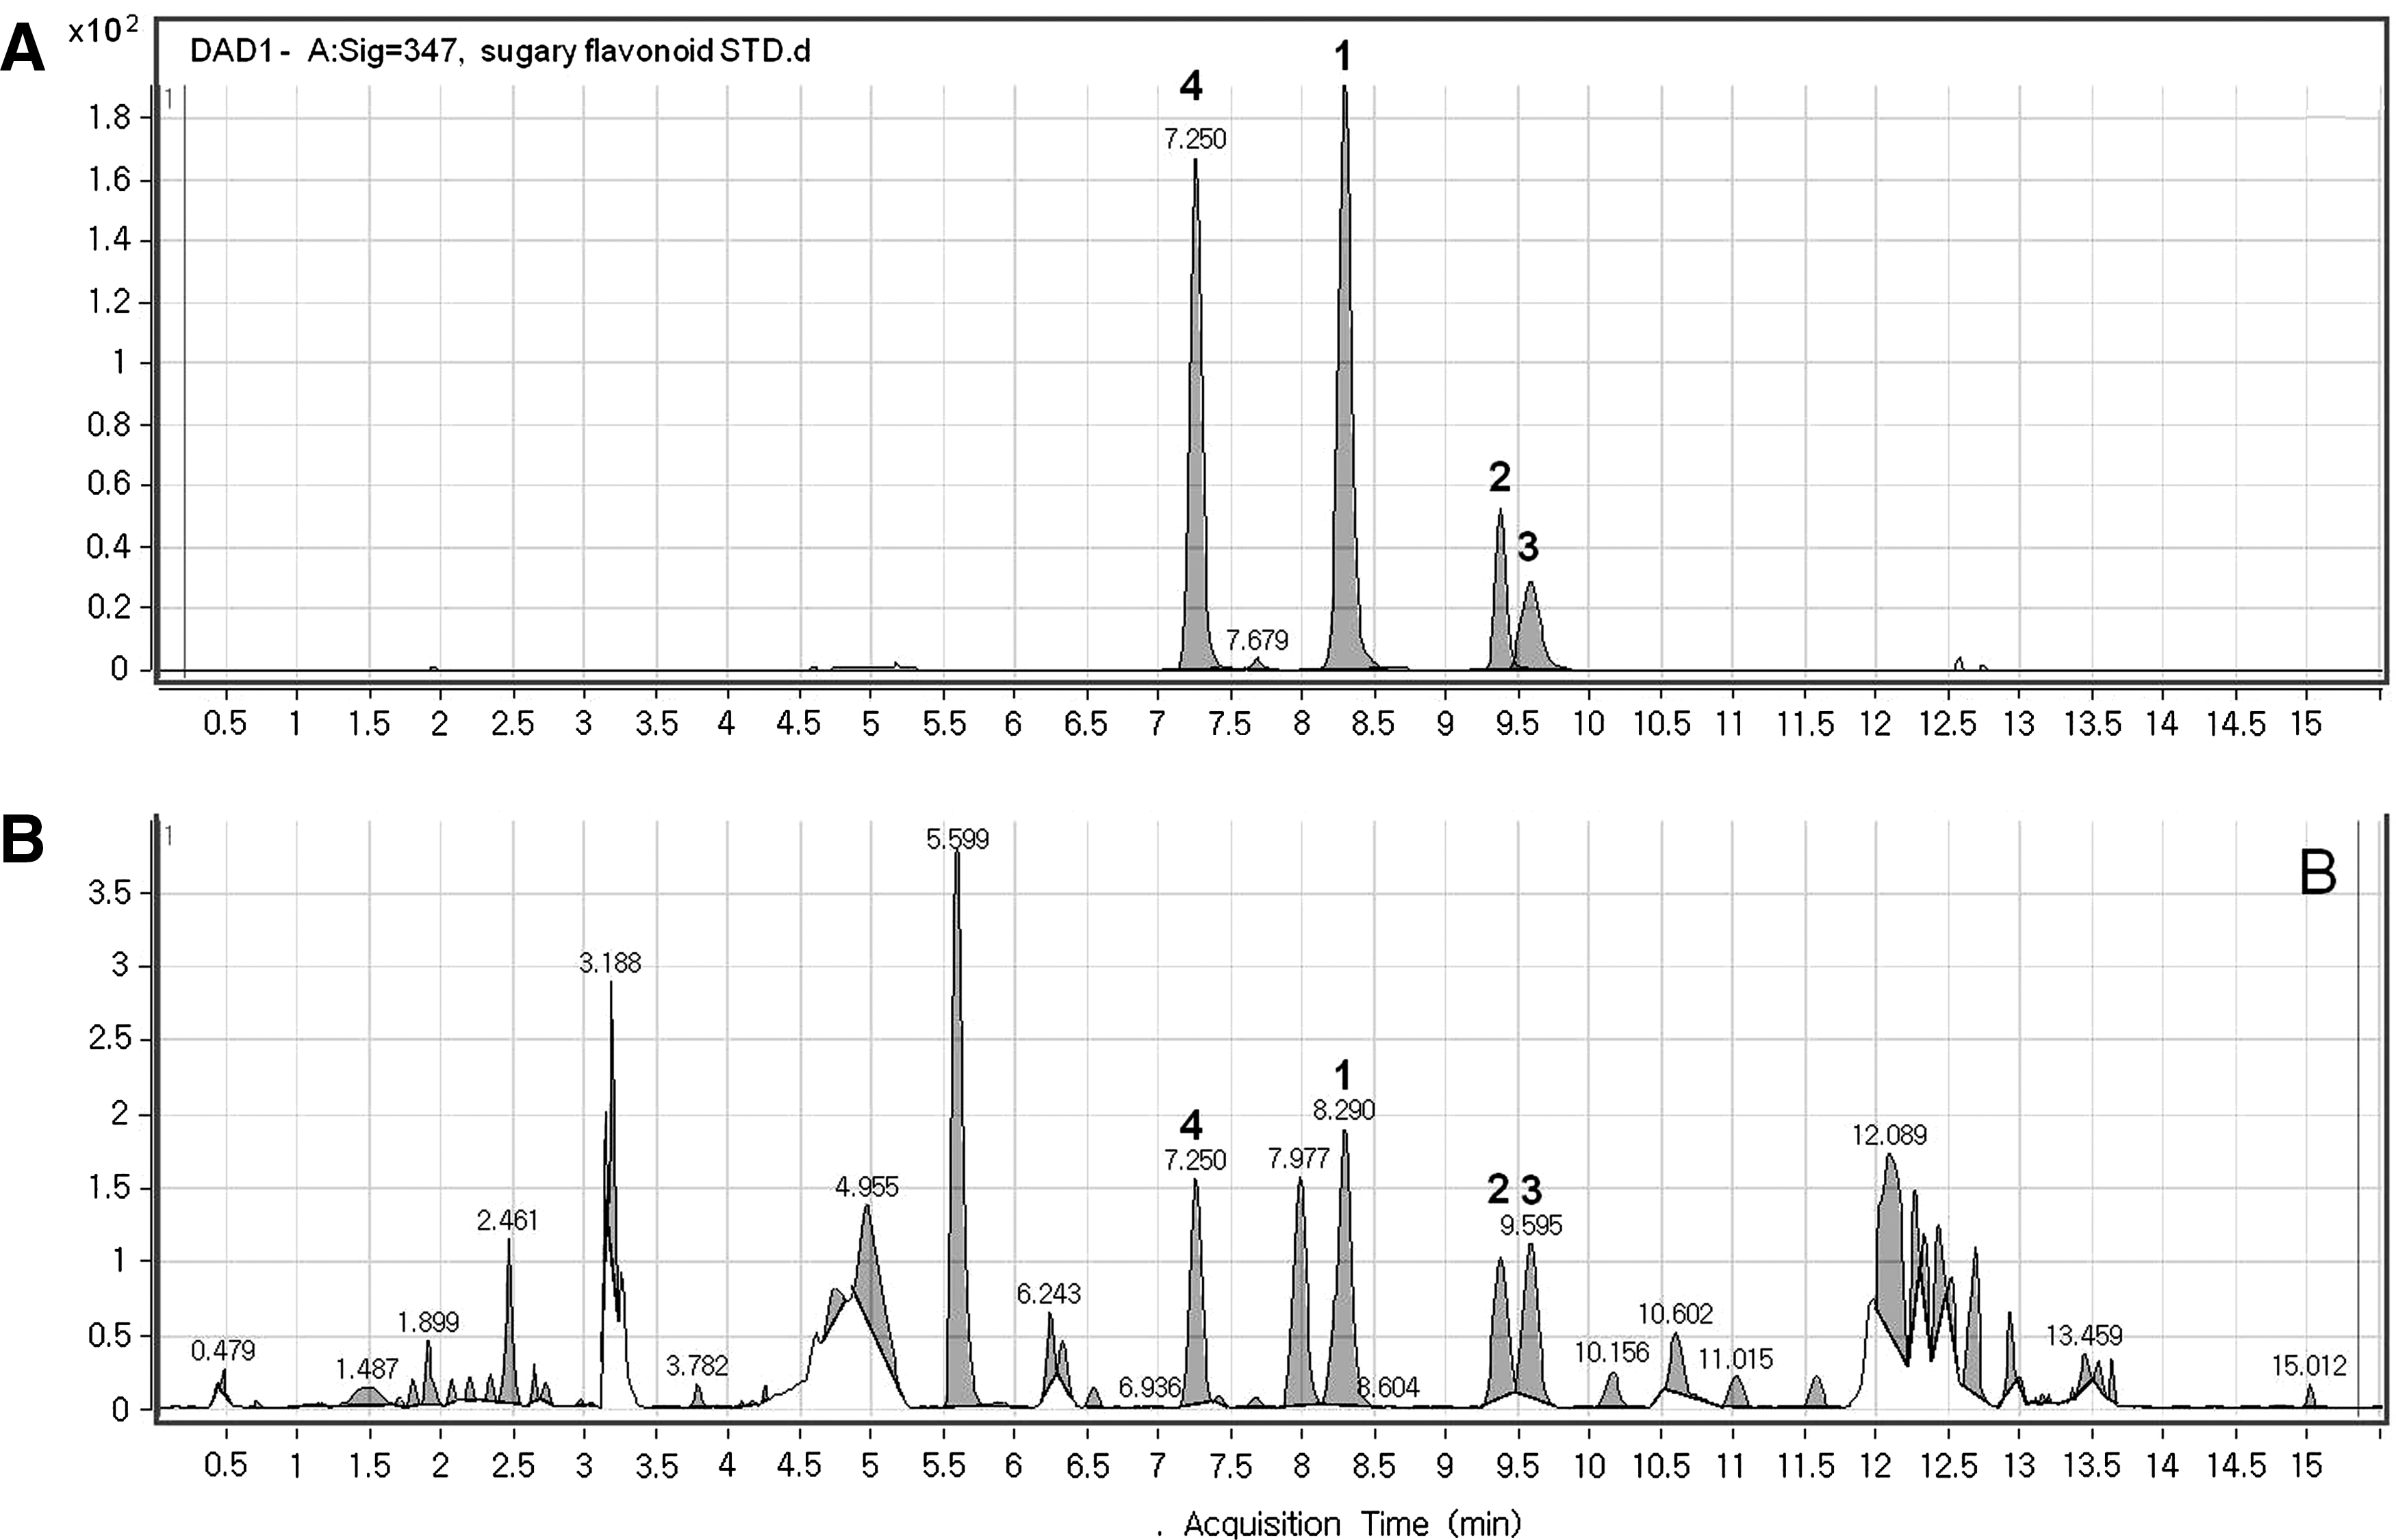
High-performance liquid chromatography/diode array detection (DAD) analysis of grains of sugary rice:
y, peak area; x, concentration of the standard (in μg/mL).
LOD, limit of detection; LOQ, limit of quantification.
Footnotes
Acknowledgment
This work was supported by the Next Generation Bio-Green 21 (grant PJ008020) Project from the Rural Development Administration of Korea.
Author Disclosure Statement
No competing financial interests exist.