
Abstract
Much attention has been focused on food components that may be beneficial in preventing lifestyle-related diseases. In this study, we investigated the effects of saponins of sea cucumber (SSC) on high-fat diet–induced obesity, insulin resistance, and fatty liver in mice. C57/BL6 mice were fed a high-fat diet, containing 0.03% SSC, or 0.1% SSC for 8 weeks. Both doses of SSC exhibited a weight-loss effect and significantly decreased adipose tissue weight, in both visceral and subcutaneous depots. Furthermore, 0.1% SSC treatment dramatically decreased the hepatic triglyceride and total cholesterol accumulation. Mice administrated with 0.1% SSC had significantly decreased serum glucose and insulin levels, lower homeostatic model assessment for insulin resistance index, and area under the blood glucose curve, suggesting that insulin sensitivity is enhanced by dietary SSC. Dietary SSC also prevented adipokine imbalance, by increasing adiponectin production and decreasing tumor necrosis factor alpha level caused by high-fat diet. Overall, these data demonstrate that SSC could improve certain metabolic parameters associated with obesity.
Introduction
O
Attention has recently focused on functional food components that may be beneficial in preventing diet-induced obesity and diabetes, because they are considered to be less toxic and have fewer side effects than drugs. These bioactive compounds present in food can alter gene expression and cellular events, resulting in the modification of metabolic homeostasis. In this context, this study was designed to investigate the potential to attenuate metabolic syndrome of a food-derived component, saponins extracted from sea cucumber.
Sea cucumber is well known as a traditional and precious seafood in Asian countries, especially consumed in China, Japan, and Korea. Sea cucumber is one of the most important aquaculture species in China, and its output value has reached 20 billion RMB in the last year. Sea cucumber is considered beneficial to health due to the high content of bioactive substance, including saponins and cerebrosides polysaccharides. Saponins are thought to be the most important bioactive composition of sea cucumber. 5 Saponins of sea cucumber (SCC) are primarily triterpene glycosides of lanosterol type aglycone with a saccharide moiety attached at the C-3 position. 6
There are several studies describing the antitumor effect of SCC both in vivo and in vitro. 7,8 Nonetheless, little is known about its potential effects on obesity and insulin resistance. In our previous study with a nonalcoholic fatty liver disease (NAFLD) model induced by orotic acid, we observed that SCC decreased hepatic steatosis in rats by normalizing lipid metabolism. 9 It could be assumed that SCC might have the possibility to ameliorate obesity-associated metabolic disorders. Therefore, the goal of this study was to determine the effect of SCC on BW gain, hepatic steatosis, insulin resistance, and inflammation in a high-fat diet–induced mouse model of metabolic syndrome.
Materials and Methods
Preparation of SCC
The body walls of sea cucumber (Pearsonothuria graeffei) were ground into powders. An amount of 1000 g powder was extracted three times by refluxing with 60% ethanol at 70°C. The filtrates were combined and subjected to vacuum evaporation (Heidolph) to remove ethanol. After evaporation, the concentrated extracts were loaded onto an HP20 resin column (Mitsubishi) and eluted with water, 80% methanol, and 100% methanol in sequence. The fraction eluted with 80% ethanol was collected and evaporated in vacuum, and then lyophilized. The dry weight yield of crude saponins was approximately 11%.
High-performance liquid chromatography assay of SSC
The final extracts were analyzed with an Agilent 1100 high-performance liquid chromatography (HPLC) system, equipped with a variable-wavelength detector at 205 nm, and an octadecylsilane column (5 μm, 250 mm×10 mm; YMC) to determine the concentration of various triterpene glycosides. The mobile phase was a linear gradient starting at 50% acetonitrile in 0.1% aqueous trifluoroacetic acid for 15 min, then increasing to 75% acetonitrile in 15 min. The flow rate was set to 1.5 mL/min. Retention time of all single triterpenen glycosides was confirmed by comparison with authentic standards.
Animals and diets
The experiment was carried out according to the guidelines of ethical committee of experimental animal care at Ocean University of China. Four-week-old male C57/BL6 mice were purchased from Vital River. The mice were housed under controlled temperature of 24°C and 12-h light–dark cycles. All the mice had free access to water and diet for 5 days. Then, the mice were randomly assigned to four groups, such that there were eight animals per treatment with two mice housed in one cage. All groups were balanced for initial BW. Group 1 mice were fed with low-fat (LF) diet; group 2 mice were fed with high-fat (HF) diet; group 3 mice were fed with HF diet plus 0.03% SSC (0.03% SSC); group 4 mice were fed with HF diet plus 0.1% SSC (0.1% SSC). SSC doses were based on the previous data we obtained on rat, which showed that treating rats with 0.05% SSC improved lipid metabolism significantly. Supplementation of 0.1% SSC in mouse (100 mg/kg BW) was equivalent to 0.05% supplementation in rat (50 mg/kg BW), as calculated with equivalent surface area dosage conversion factor. 10 The animals received LF diet (11% kcal from fat) and HF diet (48% kcal from fat) considered two control groups, respectively. The experimental diets were designed based on AIN-93G, composition of which is presented in Table 1. Energy calculation method is included in the caption of Table 1.
AIN-93G mineral mix.
AIN-93G vitamin mix.
Food energy=4×amount of carbohydrate + 4×amount of protein + 9×amount of fat. Energy density of carbohydrate, protein, and fat are 4, 4, and 9 kcal/g, respectively.
LF, low-fat diet; HF, high-fat diet; SSC, saponins of sea cucumber; 0.03% SSC, high-fat diet plus 0.03% SSC; 0.1% SSC, high-fat diet plus 0.1% SSC.
BW and food intake were measured every 2 days throughout the experiment. On day 56 of the experiment, the mice were sacrificed after overnight fasting. Whole blood, liver, kidney, heart, and adipose tissue (subcutaneous, epididymal, and perirenal) were collected and weighed.
Oral glucose tolerance test
Oral glucose tolerance test (OGTT) was performed on day 50 of the study. Mice were deprived of food for 10 h before the test. Blood was collected from the tail vein and glucose concentration was measured with the OneTouch Basic glucose monitor (LifeScan) as baseline before glucose administration. Then, the mice were given 2 g glucose/kg of BW by oral administration, and blood glucose was determined at 30, 60, 90, and 120 min after oral glucose administration.
Biochemical analyses of serum sample
Collected blood samples were centrifuged at 1500 g for 10 min at 4°C. The serum was decanted and stored at 4°C for immediate analysis. Total cholesterol (TC), triglyceride (TG), high-density lipoprotein–cholesterol (HDL-C) and glucose were determined by enzymatic regent kits (Biosin), according to the manufacturer's protocol. The levels of serum insulin and adiponectin were measured by ELISA kits (Invitrogen), and serum tumor necrosis factor alpha (TNF-α) was measured by enzyme-linked immunosorbent assay using a commercial kit (Biolegend).
The homeostatic model assessment for insulin resistance (HOMA-IR) was calculated from insulin and glucose values using the following formula
11
:
Hepatic lipid levels determination
After surgical removal, a portion of each fresh liver was collected for liver lipid extraction. Hepatic lipids were extracted according to the method of Folch et al. 12 with chloroform–methanol 2:1, and then dissolved using Triton X-100. TG and TC concentrations in liver were determined using enzymatic reagent kits.
Statistical analyses
All statistical analyses were performed using SPSS software. t-Test was used to compare means between LF group and HF group. One-way analysis of variance with Tukey's post hoc test was used to compare HF group and saponin treated groups. All the values in tables and figures are expressed as mean±standard error of the mean. P<.05 was considered statistically significant.
Results
Components of SSC
HPLC analysis of the crude saponins from P. graeffei is shown in Figure 1. SSC contained 91.2 mg total triterpene glycosides/100 mg SSC (wt/wt), suggesting that triterpene glycosides are the main component of the extracts. Peaks 2 and 5 were shown to be the two main glycosides, identified as Holothurin A and Echinoside A. Several other glycosides were also present in quite low content (peaks 1, 3, and 4).
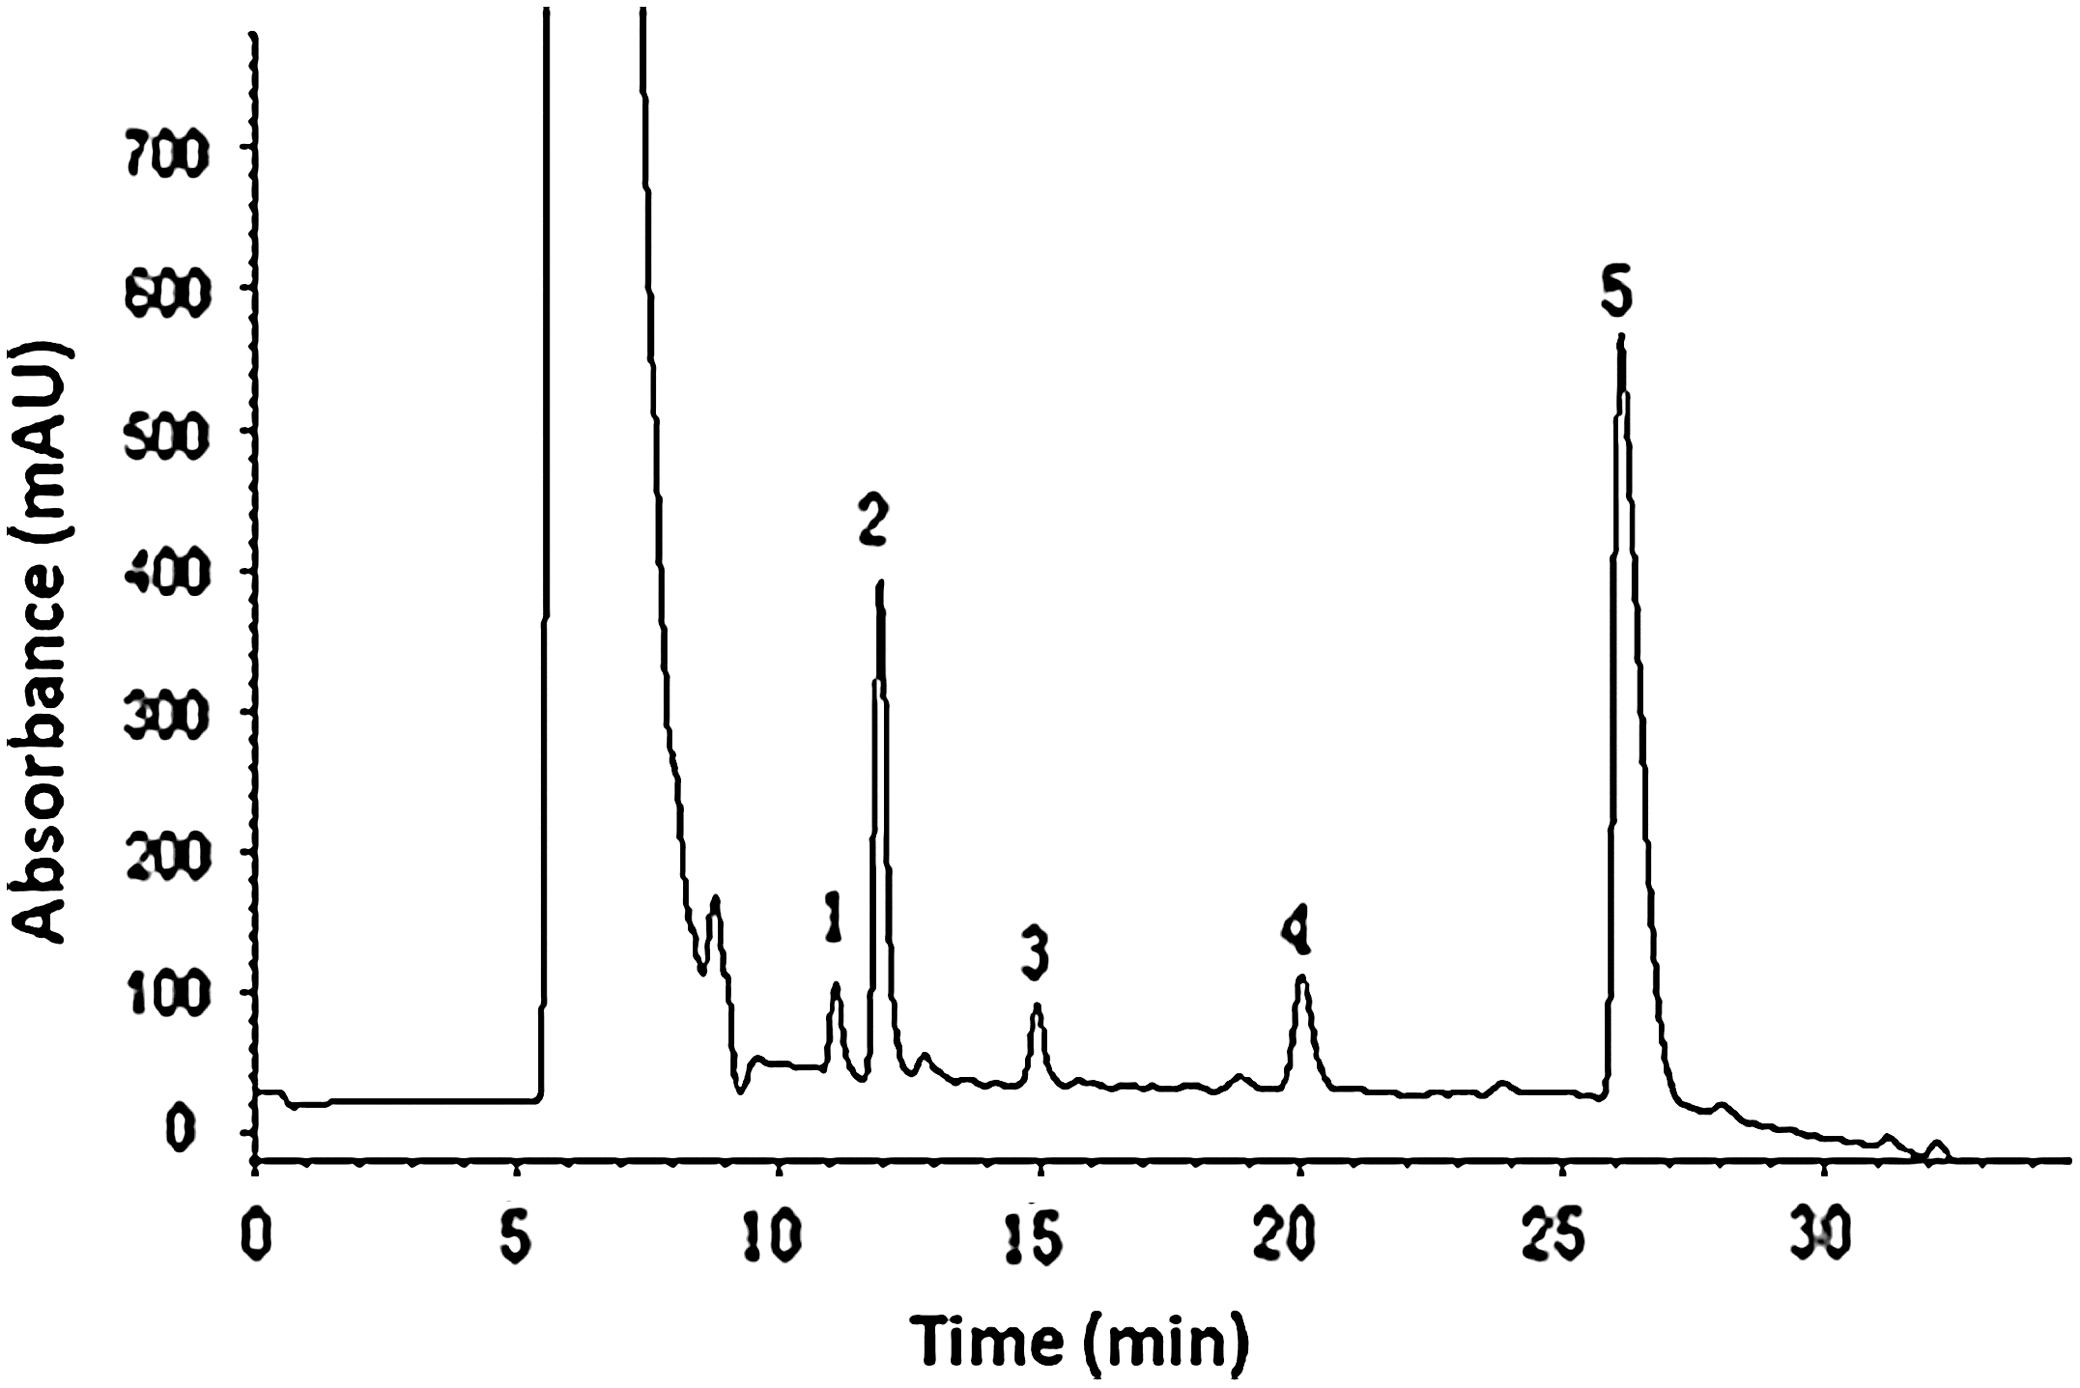
HPLC analysis of crude saponins extracted from Pearsonothuria graeffei. Experimental conditions: Column, octadecylsilane column (5 μm, 250 mm × 10 mm; YMC); Gradient elution, 50% acetonitrile in 0.1% aqueous trifluoroactic acid for 15 min, and then to 75% acetonitrile in 15 min; elution flow-rate, 1.5 mL/min. Peak 1: Holothurin A1, Peak 2: Holothurin A, Peak 3: Holothurin C, Peak 4: 24-dehydroechinoside A, Peak 5: Echinoside A.
Effect of SSC on food intake, caloric intake, and BW
C57BL/6 mice were fed experiment diets for 8 weeks. Food intake by mice fed the LF diet was about 4.5 g/day (Table 2). Food intake by mice fed the HF, HF plus 0.03% SSC, and HF plus 0.1% SSC diets was about 3.3 g/day throughout the experiment (Table 2). No significant difference in food intake was observed among those groups fed with HF diet. These data showed that SSC had no impact on appetite. It is important to note that mice on LF diet consumed more food and energy than mice on the HF diet. Energy intake by the HF diet mice was 16.18 kcal/day, whereas the mice on the LF diet consumed 17.50 kcal/day. Note: the listed calories seem high for mice but changing to cal seems to low. If the values are in joules, it might make more sense. Cumulative BW of mice are shown in Figure 2. HF mice were significantly heavier than LF mice after 30-day treatment. These trends remained throughout the course of the treatment period, and the addition of SSC suppressed BW gains within the high-fat dietary treatments. By the end of the experiment, SSC treatment mice weighed significantly less than the HF mice (Table 2). BW gain, as estimated with final BW minus initial BW, was 2.1-folder lower in mice supplied with 0.1% dietary SSC compared with HF mice.
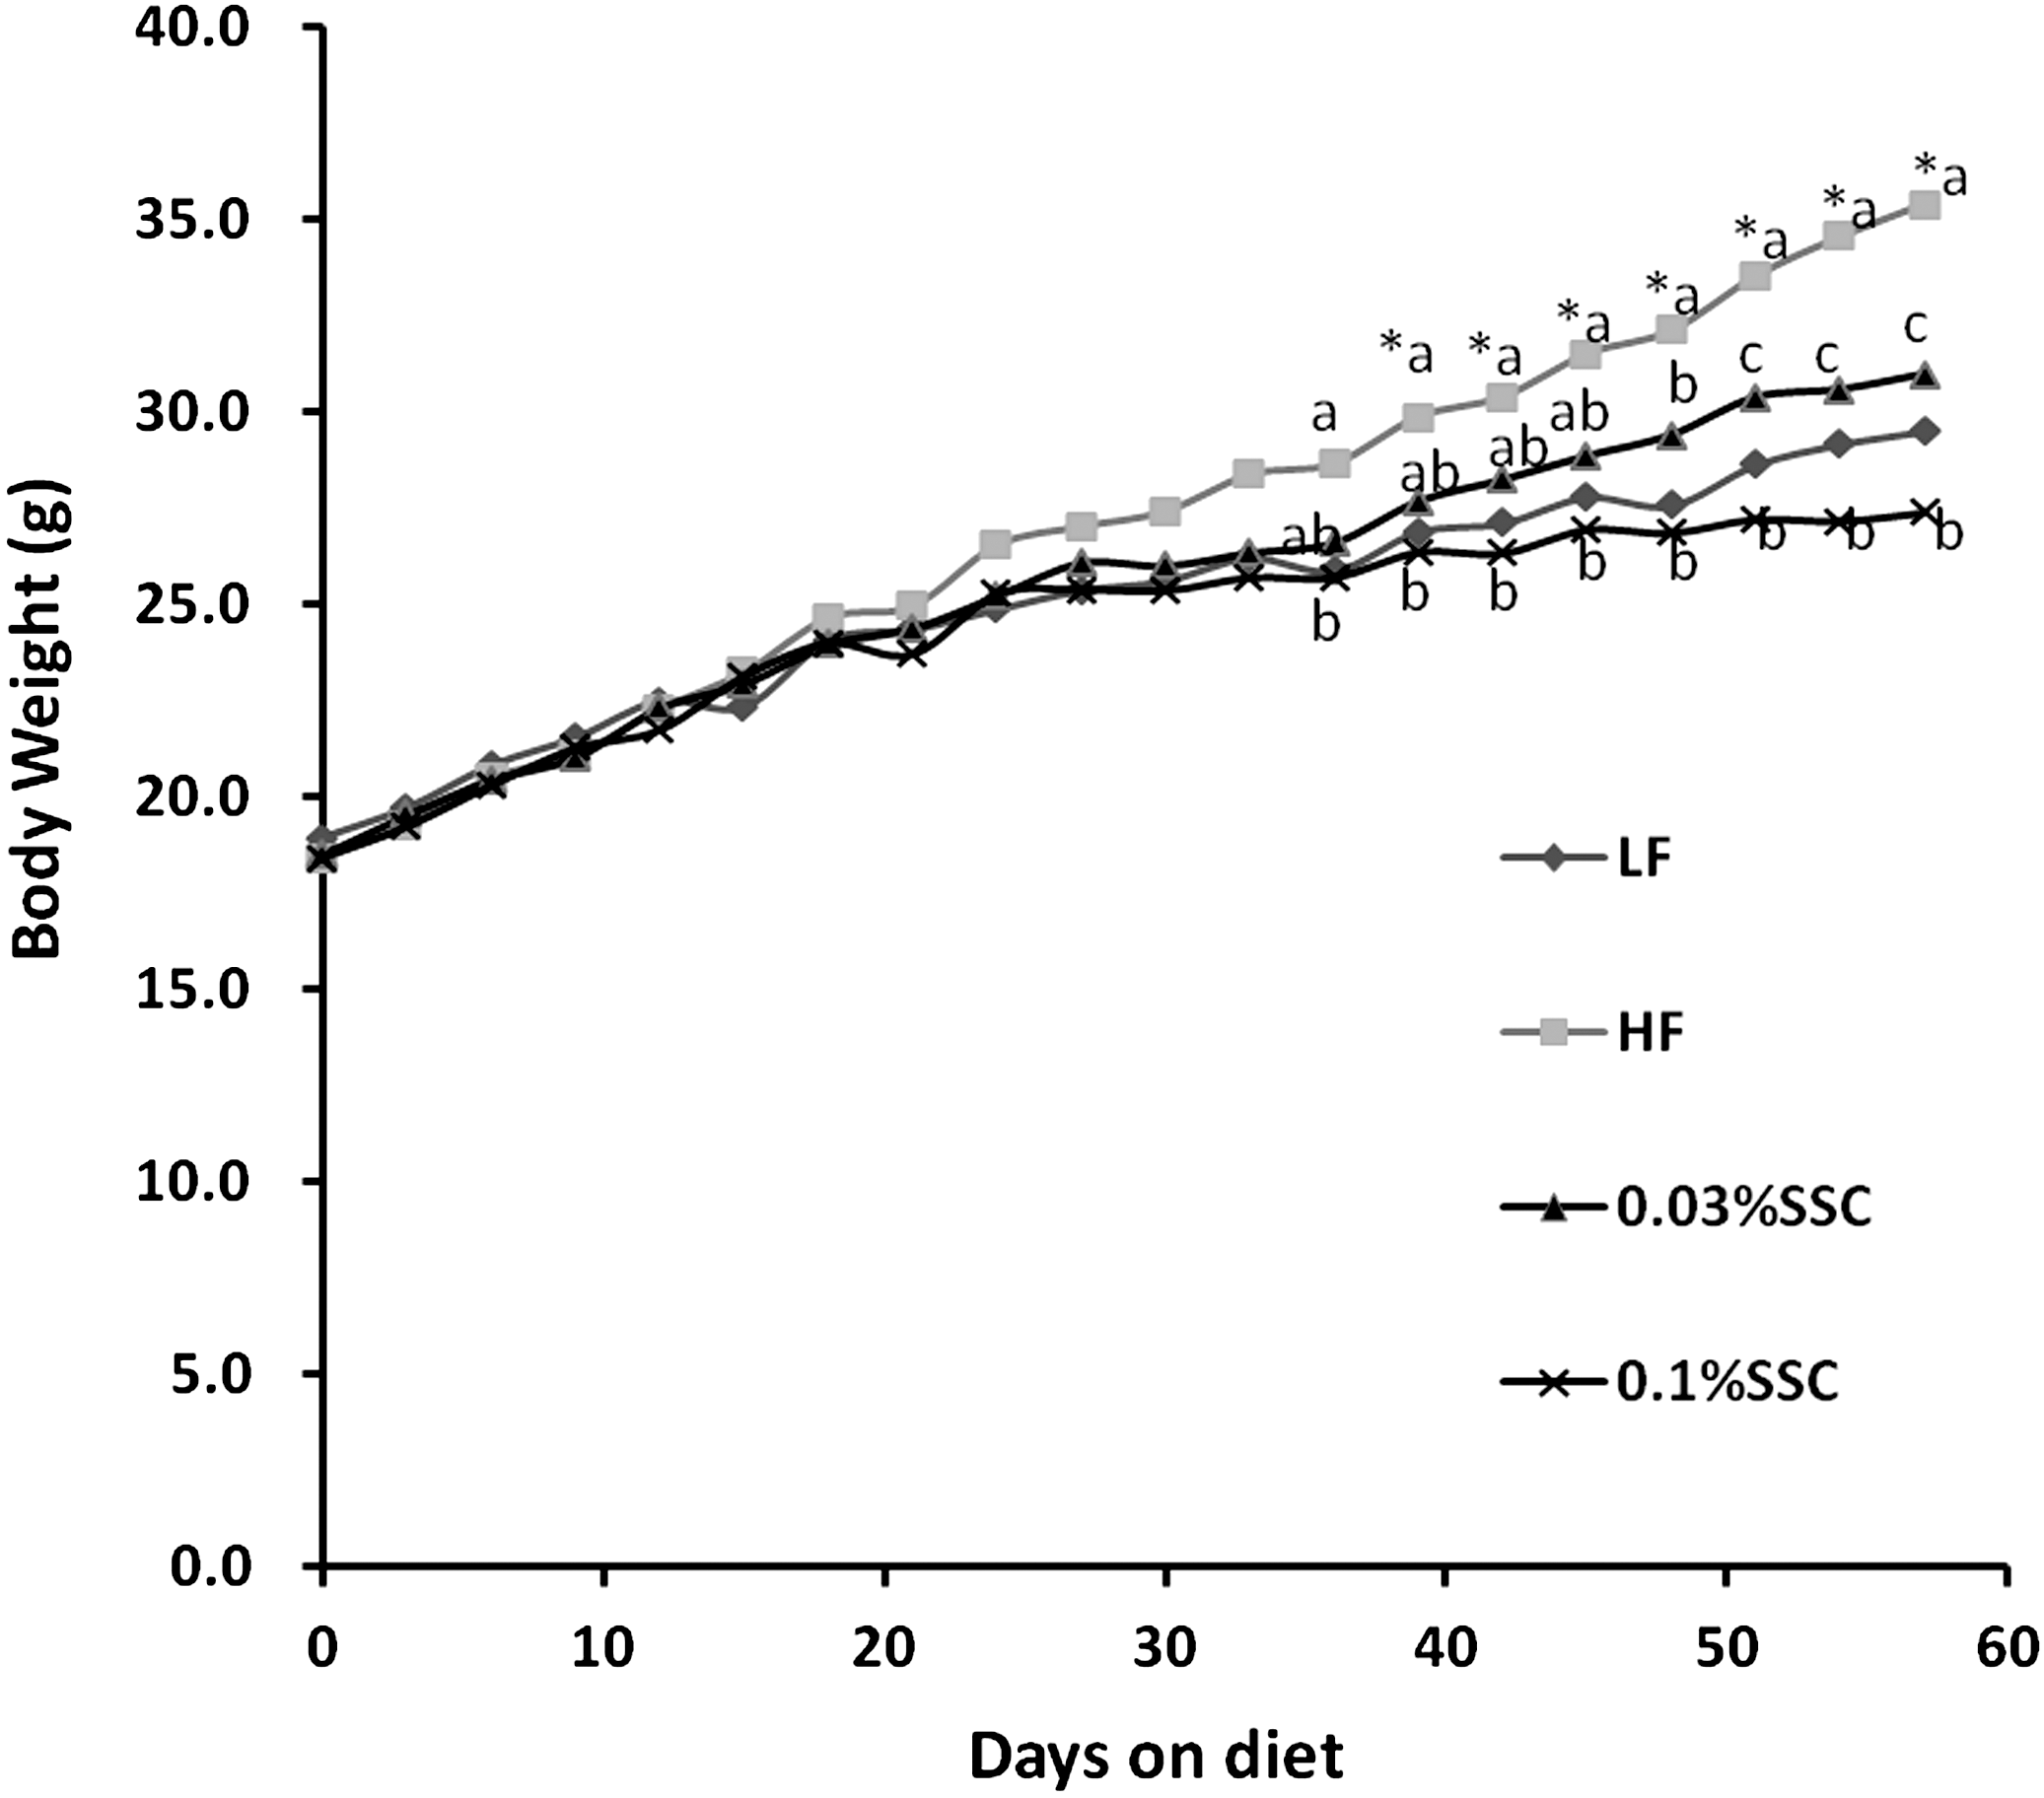
Dietary SSC suppressed body weight in HF diet–fed C57/BL6 mice. Male C57/BL6 mice were fed with each diet for 56 days. *P<.05 vs. LF group (t-test). abcMeans with different superscripts among HF and SSC groups are significantly different (P<.05, one-way ANOVA). SSC, saponins of sea cucumber; LF, low-fat; HF, high-fat; 0.03% SSC, HF diet + 0.03% SSC; 0.1% SSC, HF diet + 0.1% SSC; ANOVA, analysis of variance.
Male C57/BL6 mice were fed with each diet for 56 days. Values are presented as mean±SEM (n=8).
%BW=WAT weight/body weight×100.
Total WAT=subcutaneous WAT + perirenal WAT + epididymal WAT.
P<.05 vs. LF group (t-test).
Means with different superscripts among HF and SSC groups are significantly different (P<.05, one-way ANOVA).
WAT, white adipose tissue; SEM, standard error of the means; ANOVA, analysis of variance.
All mice behaved normally without any obvious health problems. Plasma levels of aspartate aminotransferase (AST) and alanine aminotransferase (ALT), indicator of liver disease or injury, were assessed at the end of the experiment. HF mice showed higher AST and ALT level than LF mice (P<.05, P<.01). However, serum AST and ALT level were decreased significantly in mice fed with 0.03% and 0.1% SSC compared with HF mice.
Effect of SSC on adipose tissue weight
Relative adipose tissue weight is expressed using a ratio of the adipose tissue weight and BW. The results showed that HF mice exhibited a 2.0-fold increase in total adipose tissue weight (P<.01), compared to LF mice (Table 2). This was attributed to the fat accumulation in subcutaneous, perirenal, and epididymal depots (P<.01 for all depots). At the end of the experiment, both 0.03% and 0.1% SSC treatment significantly decreased body fat (P<.05, P<.01). It is important to note that high-dose SSC treatment dramatically suppressed adipose tissue weight (65% decrease, P<.01), even lower than that of LF mice. The reduction of body fat was apparent in the subcutaneous (68% decrease, P<.01), perirenal (71% decrease, P<0.01), and epididymal depots (52% decrease, P<.01) (Table 2).
Effect of SSC treatment on serum lipid levels
After 56 days of HF or LF diet, HF mice had higher serum TC and HDL-C concentration compared with LF mice (P<.01, P<.01) (Table 3), but serum TG concentration was not altered by HF diet. Interestingly, the results showed that 0.1% SSC treatment attenuated the elevation of TC (13% decrease, P<.05), whereas 0.03% SCC treatment did not decrease serum TC. A similar trend was also observed in serum TG. The mice fed diets containing 0.1% SSC had lower serum TG concentration than HF mice, which was decreased to 0.77±0.04 mmol/L (38% decrease, P<.01). SSC treatment did not change serum HDL-C levels. Whereas HF mice exhibited higher atherogenic index (AI) compared with LF mice (55% increase, P<.01), mice fed diets containing 0.1% SSC had lower AI than HF mice (P<.05) (Table 3).
Male C57/BL6 mice were fed with each diet for 56 days. Values are presented as mean±SEM (n=8).
AI=(serum TC – serum HDL-C)/serum HDL-C.
P<.05 vs. LF group (t-test).
Means with different superscripts among HF and SSC groups are significantly different (P<.05, one-way ANOVA).
TC, total cholesterol; TG, triglyceride; HDL-C, high-density lipoprotein–cholesterol; AI, atherogenic index.
Effect of SSC treatment on hepatic lipid levels
The liver weight of mice fed with LF, HF, 0.03% SSC, and 0.1% SSC diet was similar among all groups. HF diet led to significant lipid accumulation in the liver, and hepatic TG and TC concentrations were increased to 29.74 mg/g liver (1.65-fold, P<.01), and 6.01 mg/g liver (20% increase, P<.01) (Table 3). In contrast, feeding HF mice with SSC reversed the effect and tended to make mice leaner. The hepatic TG content of mice fed with 0.03% SSC and 0.1% SSC diet was decreased to 22.53±3.45 (P=.09) and 12.10±1.39 (P<.01) mg/g liver, respectively. In addition, hepatic TC content was significantly reduced in mice fed with 0.1% SSC diet compared with HF mice (P<.01) (Table 3).
Effect of SSC treatment on OGTT, serum glucose, and insulin levels
OGTT was performed on day 50 of the experiment. Baseline blood glucose level was higher in HF mice than that of LF mice, and mice treated with SSC showed lower baseline blood glucose concentration compared to HF mice. Figure 3 shows that mice fed HF diet were found to be glucose intolerant when compared to mice fed HF diet. Thus, the average blood glucose levels of LF mice and HF mice after 120 min of oral administration of glucose (2 g/kg BW) were 7.0 and 10.5 mmol/L, respectively.

Dietary SSC improved the glucose tolerance in HF diet–fed C57/BL6 mice. An oral glucose tolerance test (2 g/kg) was performed on 50 days. Male C57/BL6 mice were fed with LF diet, HF diet,HF diet + 0.03% SSC; and HF diet + 0.1% SSC. Values are presented as mean±SEM (n=8). *P<.05 vs. LF group (t-test). abMeans with different superscripts among HF and SSC groups are significantly different (P<.05, one-way ANOVA). SEM, standard error of the mean.
In contrast, mice fed diets containing 0.03% and 0.1% SSC improved glucose tolerance, as indicated by the blood glucose levels of 8.3 and 6.8 mmol/L at 120 min (Fig. 3). These data indicated that both SSC treatment improved glucose tolerance in HF diet–fed mice. It can be proved by calculation of area under the blood glucose curve (AUC). The AUC was significantly greater in mice fed with LF diet compared to HF diet (P<.01), and both 0.03% and 0.1% SSC treatment showed decrease of AUC (Table 4).
Male C57/BL6 mice were fed with each diet for 56 days. Values are presented as mean±SEM (n=8).
HOMA-IR=fasting glucose (mmol/L)×fasting insulin (mU/L)/22.5
P<.05 vs. LF group (t-test).
Means with different superscripts among HF and SSC groups are significantly different (P<.05, one-way ANOVA).
AST, aspartate aminotransferase; ALT, alanine aminotransferase; HOMA-IR, homeostatic model assessment for insulin resistance; AUC, area under glucose curve.
HF mice exhibited increased serum insulin concentration compared with LF mice (P<.05). 0.1% SSC mice had reduced serum insulin levels compared with HF mice (13% decrease, P<.01). Mice fed HF diet showed significantly higher serum glucose than mice fed LF diet (P<.01), whereas mice treated with 0.1% SSC had lower blood glucose concentration compared to HF mice (P<.05) (Table 4). Consistent with the results of AUC, mice fed with HF diet had a significantly greater HOMA-IR index compared with LF mice, whereas mice treated with both dose SSC exhibited marked decreased HOMA-IR compared with HF mice (Table 4).
Effect of SSC treatment on serum cytokine concentrations
The effect of the HF diet on serum cytokine concentration was also evaluated. The results showed that HF mice had no difference in serum adiponectin levels compared with LF mice. However, serum adiponectin was significantly increased by 0.1% SSC treatment (Fig. 4A). When serum adiponectin levels were adjusted using total adipose tissue (white adipose tissue) weight, a significant decrease was found in the mice fed the HF diet (P<.01). In contrast, both 0.03% SSC (2.5-fold, P<.01) and 0.1% SSC (4.3-fold, P<.01) consumption induced relative adiponectin level (Fig. 4B).
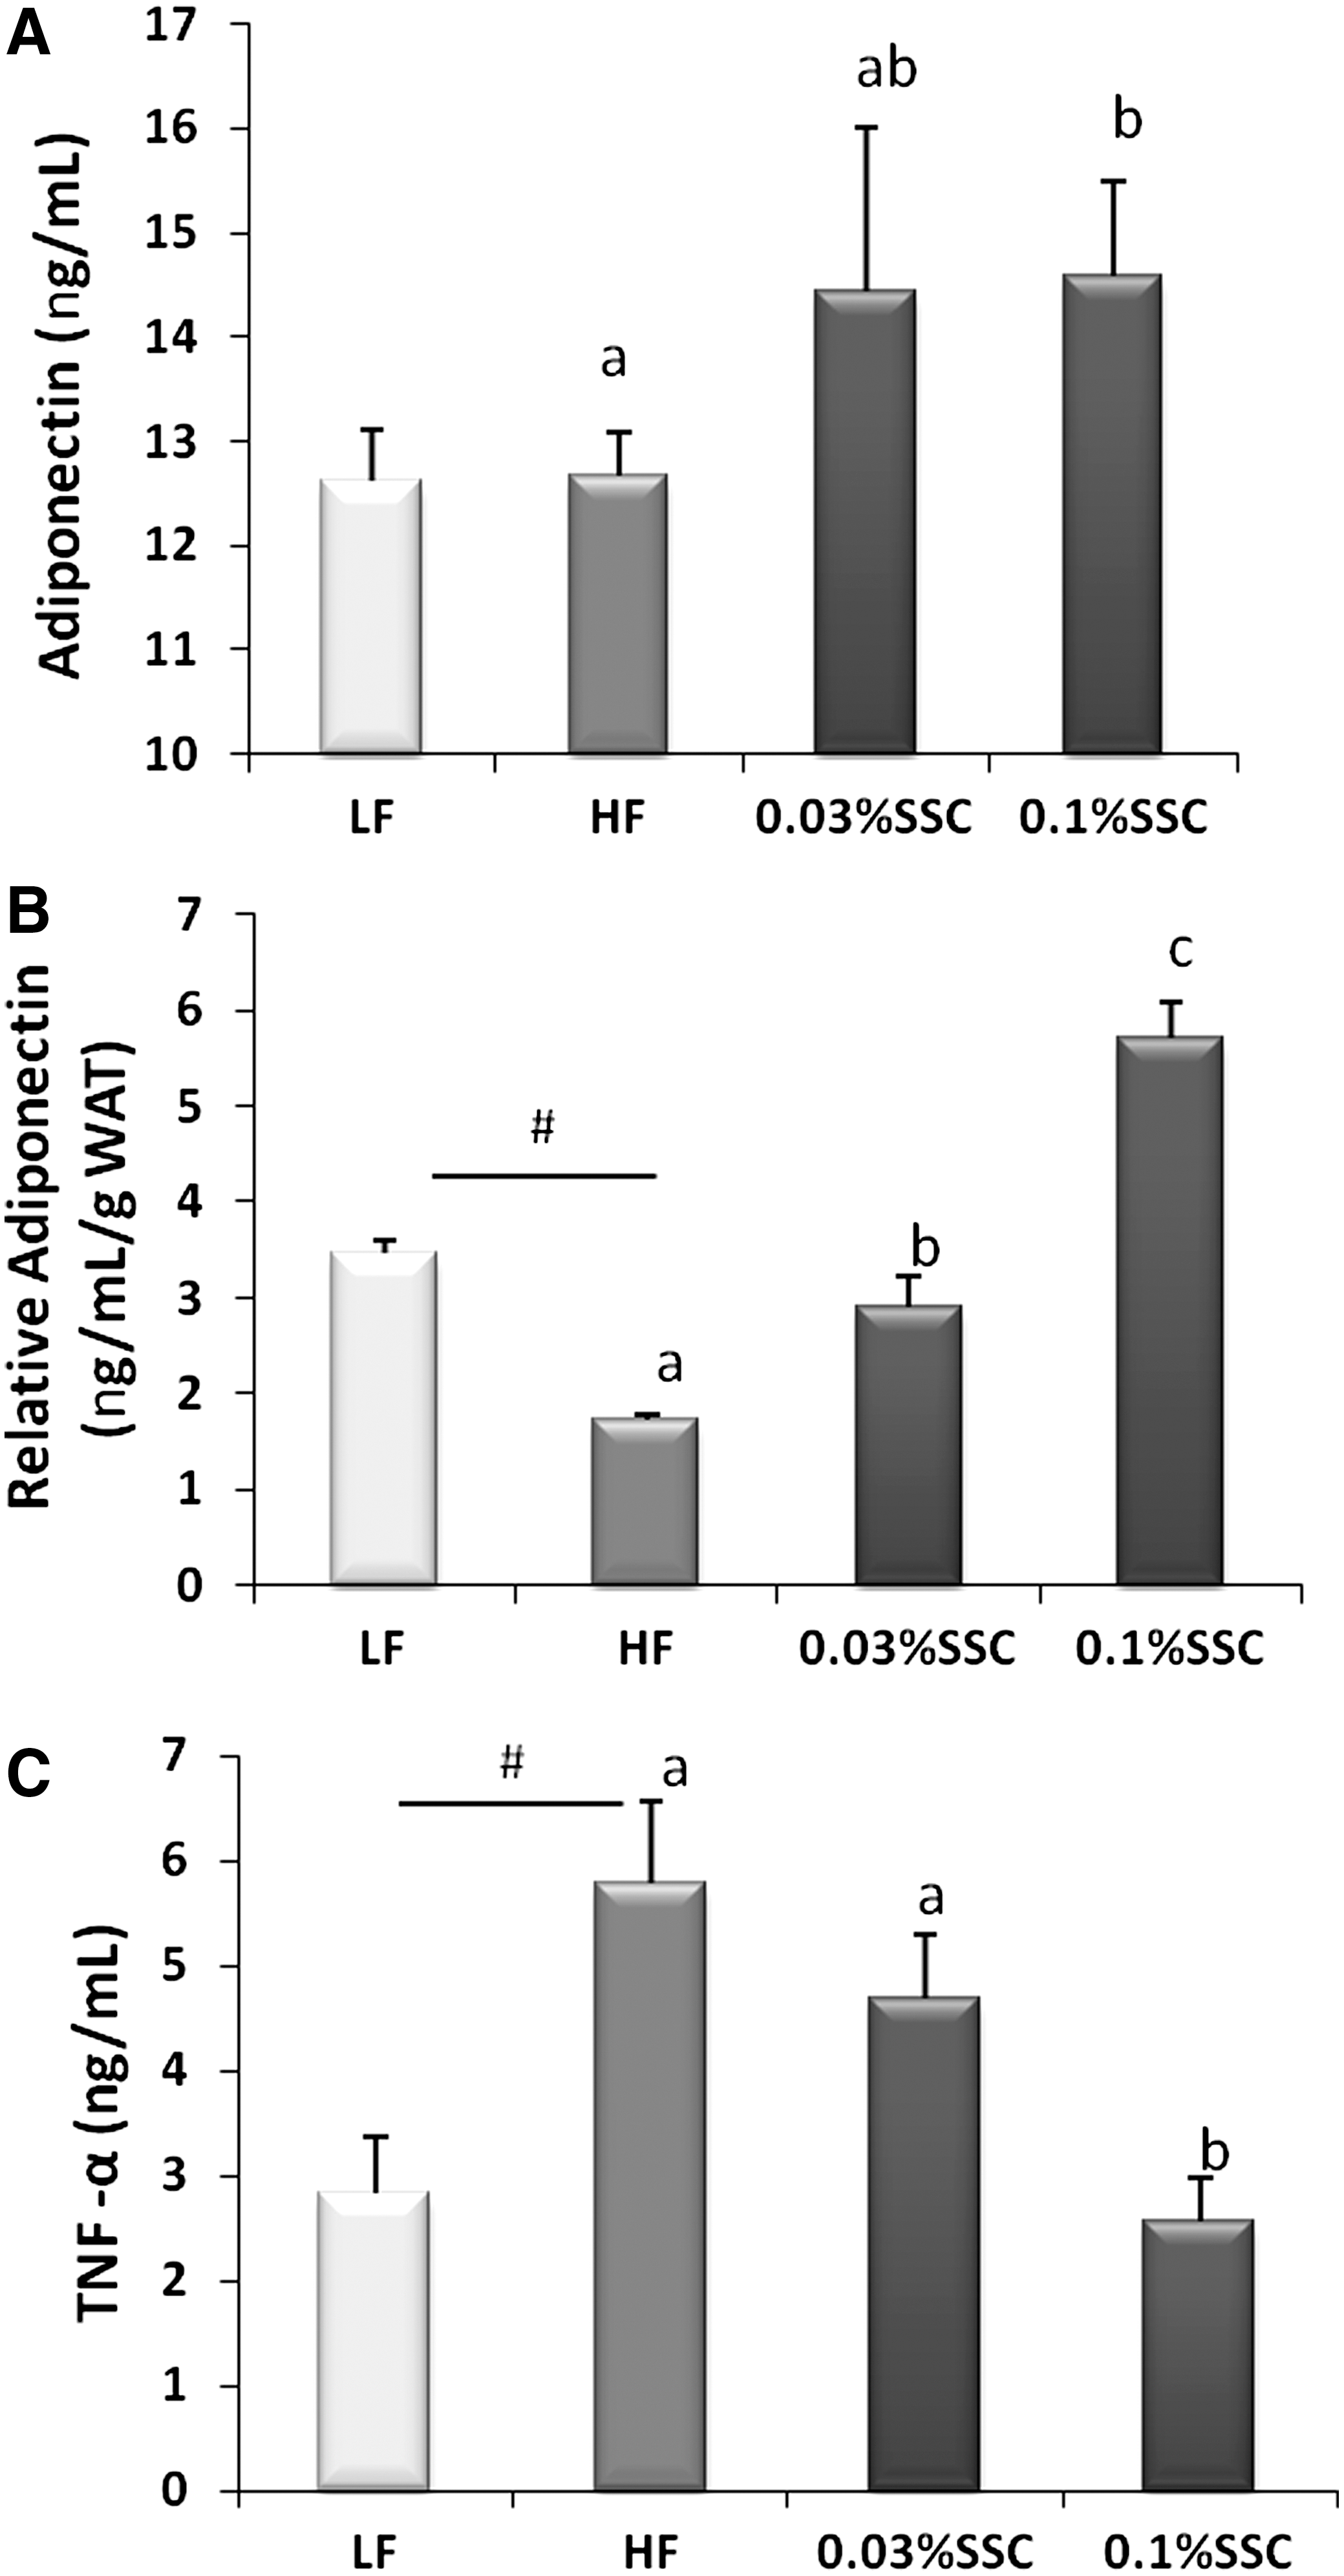
Dietary SSC improved adipokine imbalance in HF diet–fed C57/BL6 mice. Male C57/BL6 mice were fed with each diet for 56 days: LF diet, HF diet, HF diet + 0.03% SSC, and HF diet + 0.1% SSC. Relative adiponectin=serum adiponectin (ng/mL)/total white adipose tissue weight (g). Values are presented as mean±SEM (n=8). *P<.05 vs. LF group (t-test). abcMeans with different superscripts among HF and SSC groups are significantly different (P<.05, one-way ANOVA).
Mice fed HF diet showed significant higher serum TNF-α level than mice fed LF diet (2.0-fold, P<.01), whereas mice treated with 0.1% SSC had lower serum TNF-α concentration compared with HF mice (P<.01). No significant difference in serum TNF-α was observed with 0.03% SSC administration (Fig. 4C).
Discussion
High-energy intake leads to excessive lipid accumulation in adipose tissue, which is a crucial factor in the development of obesity, hepatic steatosis, and insulin resistance. Recently, many studies have focused on the search for functional food ingredients that can suppress the accumulation of body fat. In the present study, we investigated whether SSC attenuates metabolic disorders associated with HF diets. C57BL/6 mice were chosen here because they are susceptible to diet-induced obesity. 13 The HF group exhibited obesity with less energy intake than the LF group, suggesting that development of obesity is not only associated with energy intake, but also the type and content of dietary lipid. Results from epidemiologic studies are consistent with this point. It is recognized that type of fat but not total amount of fat predicts serum lipid levels; replacing saturated fat with unsaturated fat is more effective in lowering risk of coronary heart disease than simply reducing total fat consumption. 14 The data showed that food and energy intakes of each SSC treatment group did not vary much during the entire experiment, when compared with HF group. However, SSC treatment resulted in weight-loss and significantly decreased adipose tissue weight, in both visceral and subcutaneous depots. The observation indicated that the antiobesity effect of SSC is independent of food intake. Moreover, SSC-treated mice seemed have no abnormal behaviors during the experiment. Serum ALT and AST, makers of liver injury, were reversed to normal level by SSC. The results indicate that chronic exposure to SSC did not have any appreciable toxicity.
The most critical factor in the emergence of metabolic diseases is obesity. 15 Adipose tissue is not just an inert tissue devoted to energy storage, but also an active participant in regulating physiologic process. It modulates metabolism by releasing types of cytokines, including anti-inflammatory and proinflammatory cytokines. 16,17
Adiponectin is one of adipocyte-derived cytokines, which is considered as a potential therapeutic target for obesity-related disorders. 18 It plays a key role in regulating of fatty acid β-oxidation in peripheral tissues. Adiponectin activated 5′adenosine monophosphate–active protein kinase and peroxisome proliferator–activated receptor α (PPARα) signaling pathway, leading to a stimulation of fatty acid β-oxidation. Epidemiological evidence has indicated that circulating adiponectin levels are reduced in patients with obesity, insulin resistance, or cardiovascular disease. 19,20 As is reported in previous research, our data revealed that relative adiponectin level was significantly reduced in the obese mice. It is interesting that dietary SSC dramatically increased the relative adiponectin level, suggesting an elevated adiponectin secretion by adipose tissue. In our previous study, SSC supplementation enhanced fatty acid β-oxidation through a PPARα-mediated pathway in rats with fatty livers. 9 Therefore, we assume that antiobesity effect of SSC may be partially attributed to accelerating fatty acid β-oxidation pathway activated by adiponectin. Future studies are needed to determine whether SSC attenuates development of obesity by enhancing fatty acid β-oxidation.
The metabolic syndrome is a group of pathological conditions related to obesity and insulin resistance. 1,3 It is clearly established that long-term consumption of a HF diet induces obesity and IR. 14,20 In this study with a 8-week HF diet, we also observed that obesity mice represented glucose tolerance, accompanied with an increase of serum insulin. SCC treatment significantly decreased serum glucose and insulin level, and showed lower HOMA-IR index and AUC in HF diet–fed mice. Reduction of circulating insulin was observed in SSC-treated animals, suggesting that insulin sensitivity is enhanced by dietary SSC.
It is widely accepted that obesity-induced inflammation plays a key role in the development of metabolic syndrome. 2,15 TNF-α is a proinflammatory cytokine secreted by adipose tissue that can directly lead to insulin resistance by inhibiting insulin signal transduction cascades. Therefore, TNF-α is considered a likely mediator of the insulin resistance associated with high adiposity. Elevated TNF-α level has been detected in several experimental obesity models and obese humans. 21 –23 This phenomenon was also observed in our study, HF diet–fed mice showing a higher TNF-α level than lean mice. SSC treatment decreased serum TNF-α, and this may be one mechanism by which SSC improves insulin resistance. On the other hand, the elevated TNF-α concentration may be a result of the increased adipose tissue, and the reduction of TNF-α by SSC treatment may be secondary to the decrease in body fat.
In addition, increasing evidence suggests that adiponectin may be one of the insulin-sensitizing cytokines. 22 Adiponectin administration reverses insulin resistance in various mouse models of obesity and diabetes. Furthermore, adiponectin-knockout mice exhibited severe insulin resistance that was reversed by adiponectin administration. 22,23 Our results indicated that dietary SSC did not only decrease circulating TNF-α level, but also increased adiponectin level. The double beneficial action of SSC is very exciting. The elevated production of adiponectin caused by SSC treatment may partly account for the improvement of insulin resistance.
In type 2 diabetics and obese individuals, an increase of hepatic TG levels tissues is generally observed. 24 –26 Mice fed on HF diet also showed hepatic steatosis in this study. Interestingly, consumption of SSC dramatically decreased the lipid accumulation in the liver. The hepatic TC concentration in 0.1% SSC-treated mice was similar to that of LF control, but TG concentration was even lower than that of the LF group. This finding is supported by our previous study, in which we reported that SSC alleviated hepatic steatosis in orotic acid induced fatty liver rats. 9
The effect of SSC on hepatic steatosis may be attributed to its effects on insulin resistance. Recent studies have suggested that hyperinsulinemia and insulin resistance may play a role in the pathogenesis of NAFLD. 27 It has now been proposed that NAFLD is associated with metabolic syndrome. 4 Insulin resistance causes elevated serum free fatty acid and enhances liver uptake of fatty acids, which are then stored as TG and cause hepatic lipid accumulation. 20,28 It is possible that SSC improves insulin sensitivity and consequently reduces the risk for hepatic steatosis. Further studies should be undertaken to determine the causal relationship between insulin resistance and hepatic steatosis, and the role of SSC in attenuating those metabolic disorders.
In conclusion, the present study demonstrated that SSC treatment suppressed BW gain, decreased body fat, normalized glucose tolerance, improved hyperlipidemia, and suppressed hepatic lipid accumulation by preventing adipokine imbalance in high-fat diet–fed mice. To our knowledge, it is the first systematically evaluation of its beneficial effect on obesity-associated diseases. Our findings suggested that dietary SSC may reduce the risk of developing obesity, type 2 diabetes, and metabolic syndrome.
Footnotes
Acknowledgments
Financial support for this study was provided by International Science and Technology Cooperation Program of China (No. 2010DFA31330) and National Natural Science Foundation of China (No. 31000795 & No. 30972285).
Author Disclosure Statement
No competing financial interests exist.