
Abstract
Diabetes has reached epidemic levels in the whole world, and the use of bioactive compounds that may have the capacity to prevent and treat diabetes is of great interest. Sulforaphane (SFN) is a compound which is found in cruciferous vegetables and that acts as both a potent antioxidant and regulator of gene expression. The aim of this study was to evaluate the effect of SFN in diabetes induced by streptozotocin (STZ). Male Wistar rats were gavaged with water or 0.1, 0.25, or 0.5 mg/kg of SFN before an injection of STZ (80 mg/kg). Animals treated with SFN showed fasting glycemia, insulin sensitivity, and hepatic glycogen concentrations, similar to the control group (nondiabetic), and different from the diabetic group. Diabetic animals also presented elevated levels of serum triacylglycerols (TAG), urea, and creatinine, and all SFN doses were able to reverse these alterations. However, the same doses of SFN accentuated alterations in total cholesterol, alanine, and aspartate aminotransferase levels, and had no effect on hepatic TAG, HDL cholesterol, and uptake of 2-deoxy glucose in adipose tissue and soleum muscle. Based on the effects inferred by the present data, SFN presented some positive effects against diabetes induction, although the impairment of hepatic function and cholesterol levels were aggravated after treatment with the compound.
Introduction
D
In the face of this scenario, there is an increased scientific interest about bioactive compounds that may have the capacity to prevent either the occurrence of diabetes or the disease progression. 9 –11 Sulforaphane (SFN) is a glycoside sulphide belonging to the isothiocyanates group that is found in cruciferous vegetables, mostly broccoli and cauliflower. Isothiocyanates are a class of anticarcinogenic phase II enzyme inducers, responsible by detoxification processes, 12,13 that act as activators of transcription factor NF-E2–related factor-2 (Nrf2) which regulates gene expression through the promoter antioxidant response element. Nrf2 regulates the transcription of protective and metabolic enzymes such as glutathione reductase and NADPH-quinone oxireductase. 14 Although most of the evidence of SFN benefits is related to the prevention and inhibition of the carcinogenesis process, 15 –17 recent data show other functions related to this compound, such as antiinflammatory, antiapoptotic, cardiac, and neuroprotective properties, besides preserved pancreatic function in streptozotocin (STZ)-diabetic rats. 13,18,19
Based on these data, the aim of this study was to evaluate the effect of SFN oral administration in the clinical parameters of diabetes management in a rat experimental model of this disease.
Materials and Methods
Reagents
R, S -SFN was purchased from LKT Laboratories (St. Paul, MN, USA). STZ and glycogen was obtained from Sigma Chemical Co. (St. Louis, MO, USA). 2-[U-14C]-Deoxy-D-Glucose (specific activity 308 mCi/mmol) was obtained from Amersham International (Buckinghamshire, United Kingdom). Optiphase Hi-Safe 3 was purchased from Perkin-Elmer (Boston, MA, USA). All other chemicals used were obtained from Merck S.A., Porto Alegre, Brazil. Diagnostic kits were obtained from Labtest® (Lagoa Santa, MG, Brazil).
Animals and treatments (type 1 diabetes induction)
Sixty-day-old male Wistar rats were obtained from the Central Animal House of the UFRGS Biochemistry Department, the Federal University of Rio Grande do Sul, Brazil. They were maintained under a standard dark-light cycle (lights on between 7:00 a.m. and 7:00 p.m.) at a room temperature of 22°C±2°C and received a standard commercial diet and water ad libitum. Animal care followed the official governmental guidelines in compliance with the Federation of Brazilian Societies for Experimental Biology and was approved by the ethics committee of the Federal University of Rio Grande do Sul, Brazil.
To determine the effects of SFN, the rats were randomly divided into five groups: a control (CT) group, an STZ group, and three STZ groups pretreated with different SFN concentrations. During 3 days before diabetes induction, the rats were daily gavaged either with 300 μL of deionized water (CT and STZ group) or with 0.1, 0.25, and 0.5 mg/kg of SFN diluted in deionized water (SFN0.1, SFN0.25, and SFN0.5 groups, respectively). On the 4th day, in order to induce diabetes, the rats were intraperitoneally injected either with saline (CT group) or with STZ 80 mg/kg of body weight dissolved in saline (STZ, SFN0.1, SFN0.25, and SFN0.5 groups) (Sigma, St. Louis, MO, USA), after an overnight fasting. The diabetes induction was confirmed 48 h after the injection, and only animals with a blood glucose ≥250 mg/dL−1 were considered diabetic. 20 The duration of the study was set as 10 days to evaluate the effects of SFN pretreatment on the acute alterations of the disease.
Insulin responsiveness test
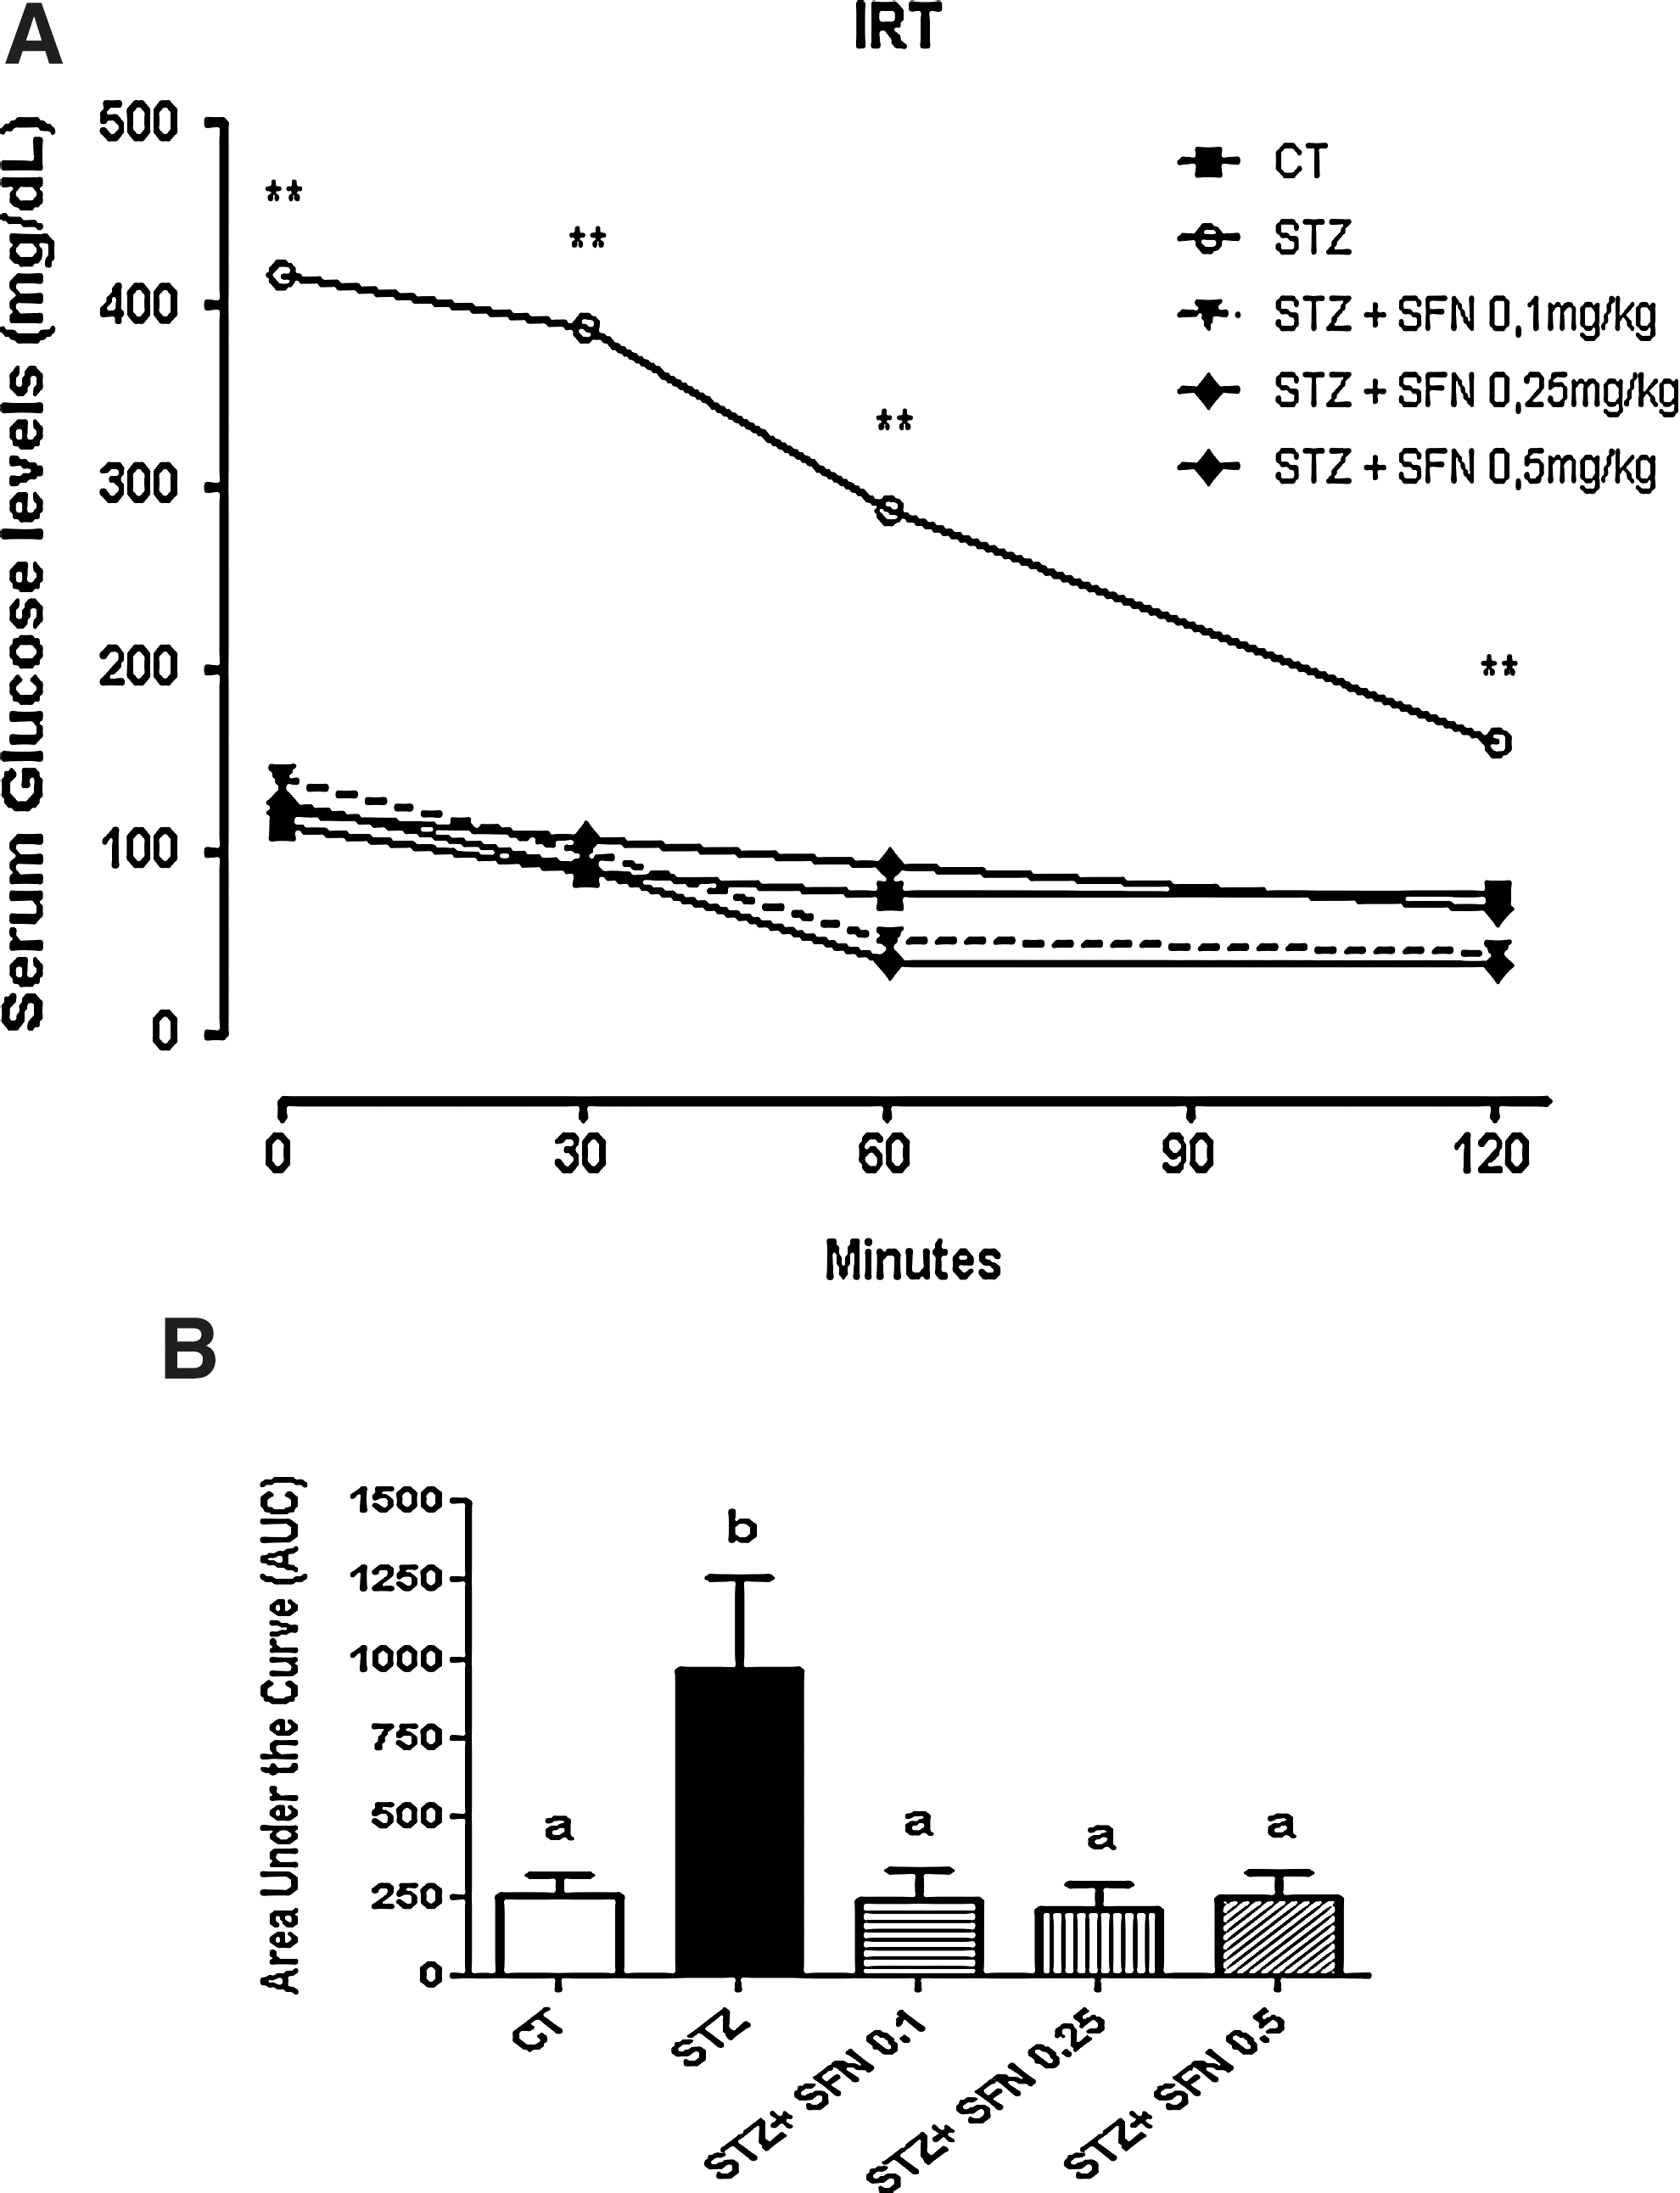
An insulin responsiveness test (IRT) was performed 9 days after diabetes induction and before the test rats were fasted for 6 h. Subsequently, they were intraperitoneally injected with an insulin solution (Humulin; Lilly France S.A., Fergesheim, France) at a dose of 1 U/kg body weight. Blood samples were obtained from the cut tip of the tail immediately before, as well as 30, 60, and 120 min after the injection. The glycemia was determined using a glucometer (Accu-Chekt Active; Roche Diagnostics, Mannheim, Germany).
Blood and tissue preparation
One day after the IRT animals had been killed by decapitation, blood samples were immediately collected and centrifuged at 5000 g for 10 min to obtain serum. Liver, retroperitoneal and epididymal adipose tissue, and soleus skeletal muscle were dissected, weighted, and samples of these tissues were separated to perform a posterior specific analysis.
Blood biochemical parameters
Serum levels of total cholesterol, HDL cholesterol, TAG, urea, creatinine, and enzymatic activities of alanine aminotransferase (ALT) and aspartate aminotransferase (AST) were measured with commercial kits (Labtest, Lagoa Santa, MG, Brazil).
Hepatic and muscular glycogen concentration
Strips of soleus muscle weighting about 70–80 mg and samples of liver weighting about 150 mg were used to determinate hepatic and muscular glycogen concentrations, which were measured by the Krisman Method. 21
Uptake of 2-deoxy glucose in soleus skeletal muscle and adipose tissue
Strips of soleus muscle weighting about 70–80 mg and samples of retroperitoneal adipose tissue weighting 200 mg were incubated at 37°C with gentle agitation for 30 min in Krebs-Ringer bicarbonate buffer (KRB) at pH 7.4, which was earlier oxygenated (95% O2:5% CO2 mixture for 1.0 min) and contained 5 mM glucose and 0.1 μCi 2-[U-14C]-deoxy-D-glucose. The medium was sparged with 95% O2:5% CO2 throughout the incubation to prevent tissue hypoxia. After incubation, the reaction was stopped by placing the flasks on ice (4°C). The incubation system was removed, and the slices were washed thrice with 1.0 mL KRB. The slices were transferred to tubes and centrifuged at 2000 g for 10 min. The supernatant was removed, and 0.2 mL of a 2 M NaOH solution was added to the pellet. After the tissue homogenization, the scintillation liquid (Optiphase HiSafe®) was added, and the radioactivity incorporation was measured in a Wallac scintillation counter (Turku, Finland).
Statistical analysis
Data were analyzed with SPSS 17.0 software. An insulin tolerance test was analyzed by Repeated Measures analysis of variance (ANOVA) and post-hoc Bonferroni's test. Parametric variables were tested by one-way ANOVA and post-hoc Tukey's test, and nonparametric variables were tested by the Kruskall–Wallis test. Results are expressed as either mean±standard deviation or median (min-max).
Results
Body composition, glycemia, and insulin sensitivity
Table 1 shows the body composition and pre- and postinduction fasting glycemia of the CT, STZ, and SFN (SFN0.1, SFN0.25, and SFN0.5) groups. There was no difference in body weight among the groups before diabetes induction, and even after all the groups had presented an increment of it after 10 days, the final weight was lower in the STZ, SFN0.1, SFN0.25, and SFN0.5 groups compared with the CT group (P<.01). A slight difference was observed in the SFN0.25 and SFN0.5 groups, which showed a higher body weight than the STZ and SFN0.1 groups (P<.05). A comparison of the initial and final body weight resulted in the gain being only significant in CT (P<.05), although a trend could be observed in SFN0.25 and SFN0.5 (P=.07) (data not shown). The other groups exhibited some negative values related to this parameter because of some animals that did not gain weight.
n=8. Data are expressed as mean±standard deviation or median (min–max). Statistical analysis performed with one-way ANOVA followed by either Tukey's test or Kruskall–Wallis test.
Fasting.
Different letters mean P<.05 among groups.
CT, control; SFN, sulforaphane; STZ, streptozotocin; ANOVA, analysis of variance.
With regard to retroperitoneal and epididymal adipose tissue, CT and all STZ+SFN groups were different from the STZ group, which had epididymal fat twofold lower than the other groups (P<.01). Liver weight also was lower in the STZ group compared with the other groups (P<.05) and again, SFN0.25 and SFN0.5 presented a subtle difference from the STZ and SFN0.1 groups (P<.05). Preinduction glycemia was measured in order to test whether there was any difference in this parameter among the groups before the STZ injection or SFN treatment, which was not observed (P>.05). Postinduction fasting glycemia was used to detect the animal sensibility to the treatment and to confirm diabetes diagnosis, which could be observed in the glycemia threefold higher in the STZ group compared with the CT and all STZ+SFN groups (P<.01). A test between pre- and postinduction fasting glycemia in the same group was also performed, and although all of them had an increase of this parameter, only STZ presented an elevated glycemia that was statistically significant (data not shown) (P<.01).
In order to test insulin sensitivity, the animals were submitted to IRT and at time 0, before an insulin injection, the STZ group showed glucose levels that were almost 300% higher than the other groups (Fig. 1A, P<.01). The difference between the STZ×CT and STZ×STZ+SFN groups was sustained during 30, 60, and 120 min after the injection (P<.01 along the test), and there were neither differences in all glycemic measures between the CT and STZ+SFN-treated groups nor differences between the SFN doses, which can be confirmed by the area under the curve (Fig. 1B, P>.05).
Glycogen concentration and 2-Deoxy Glucose uptake
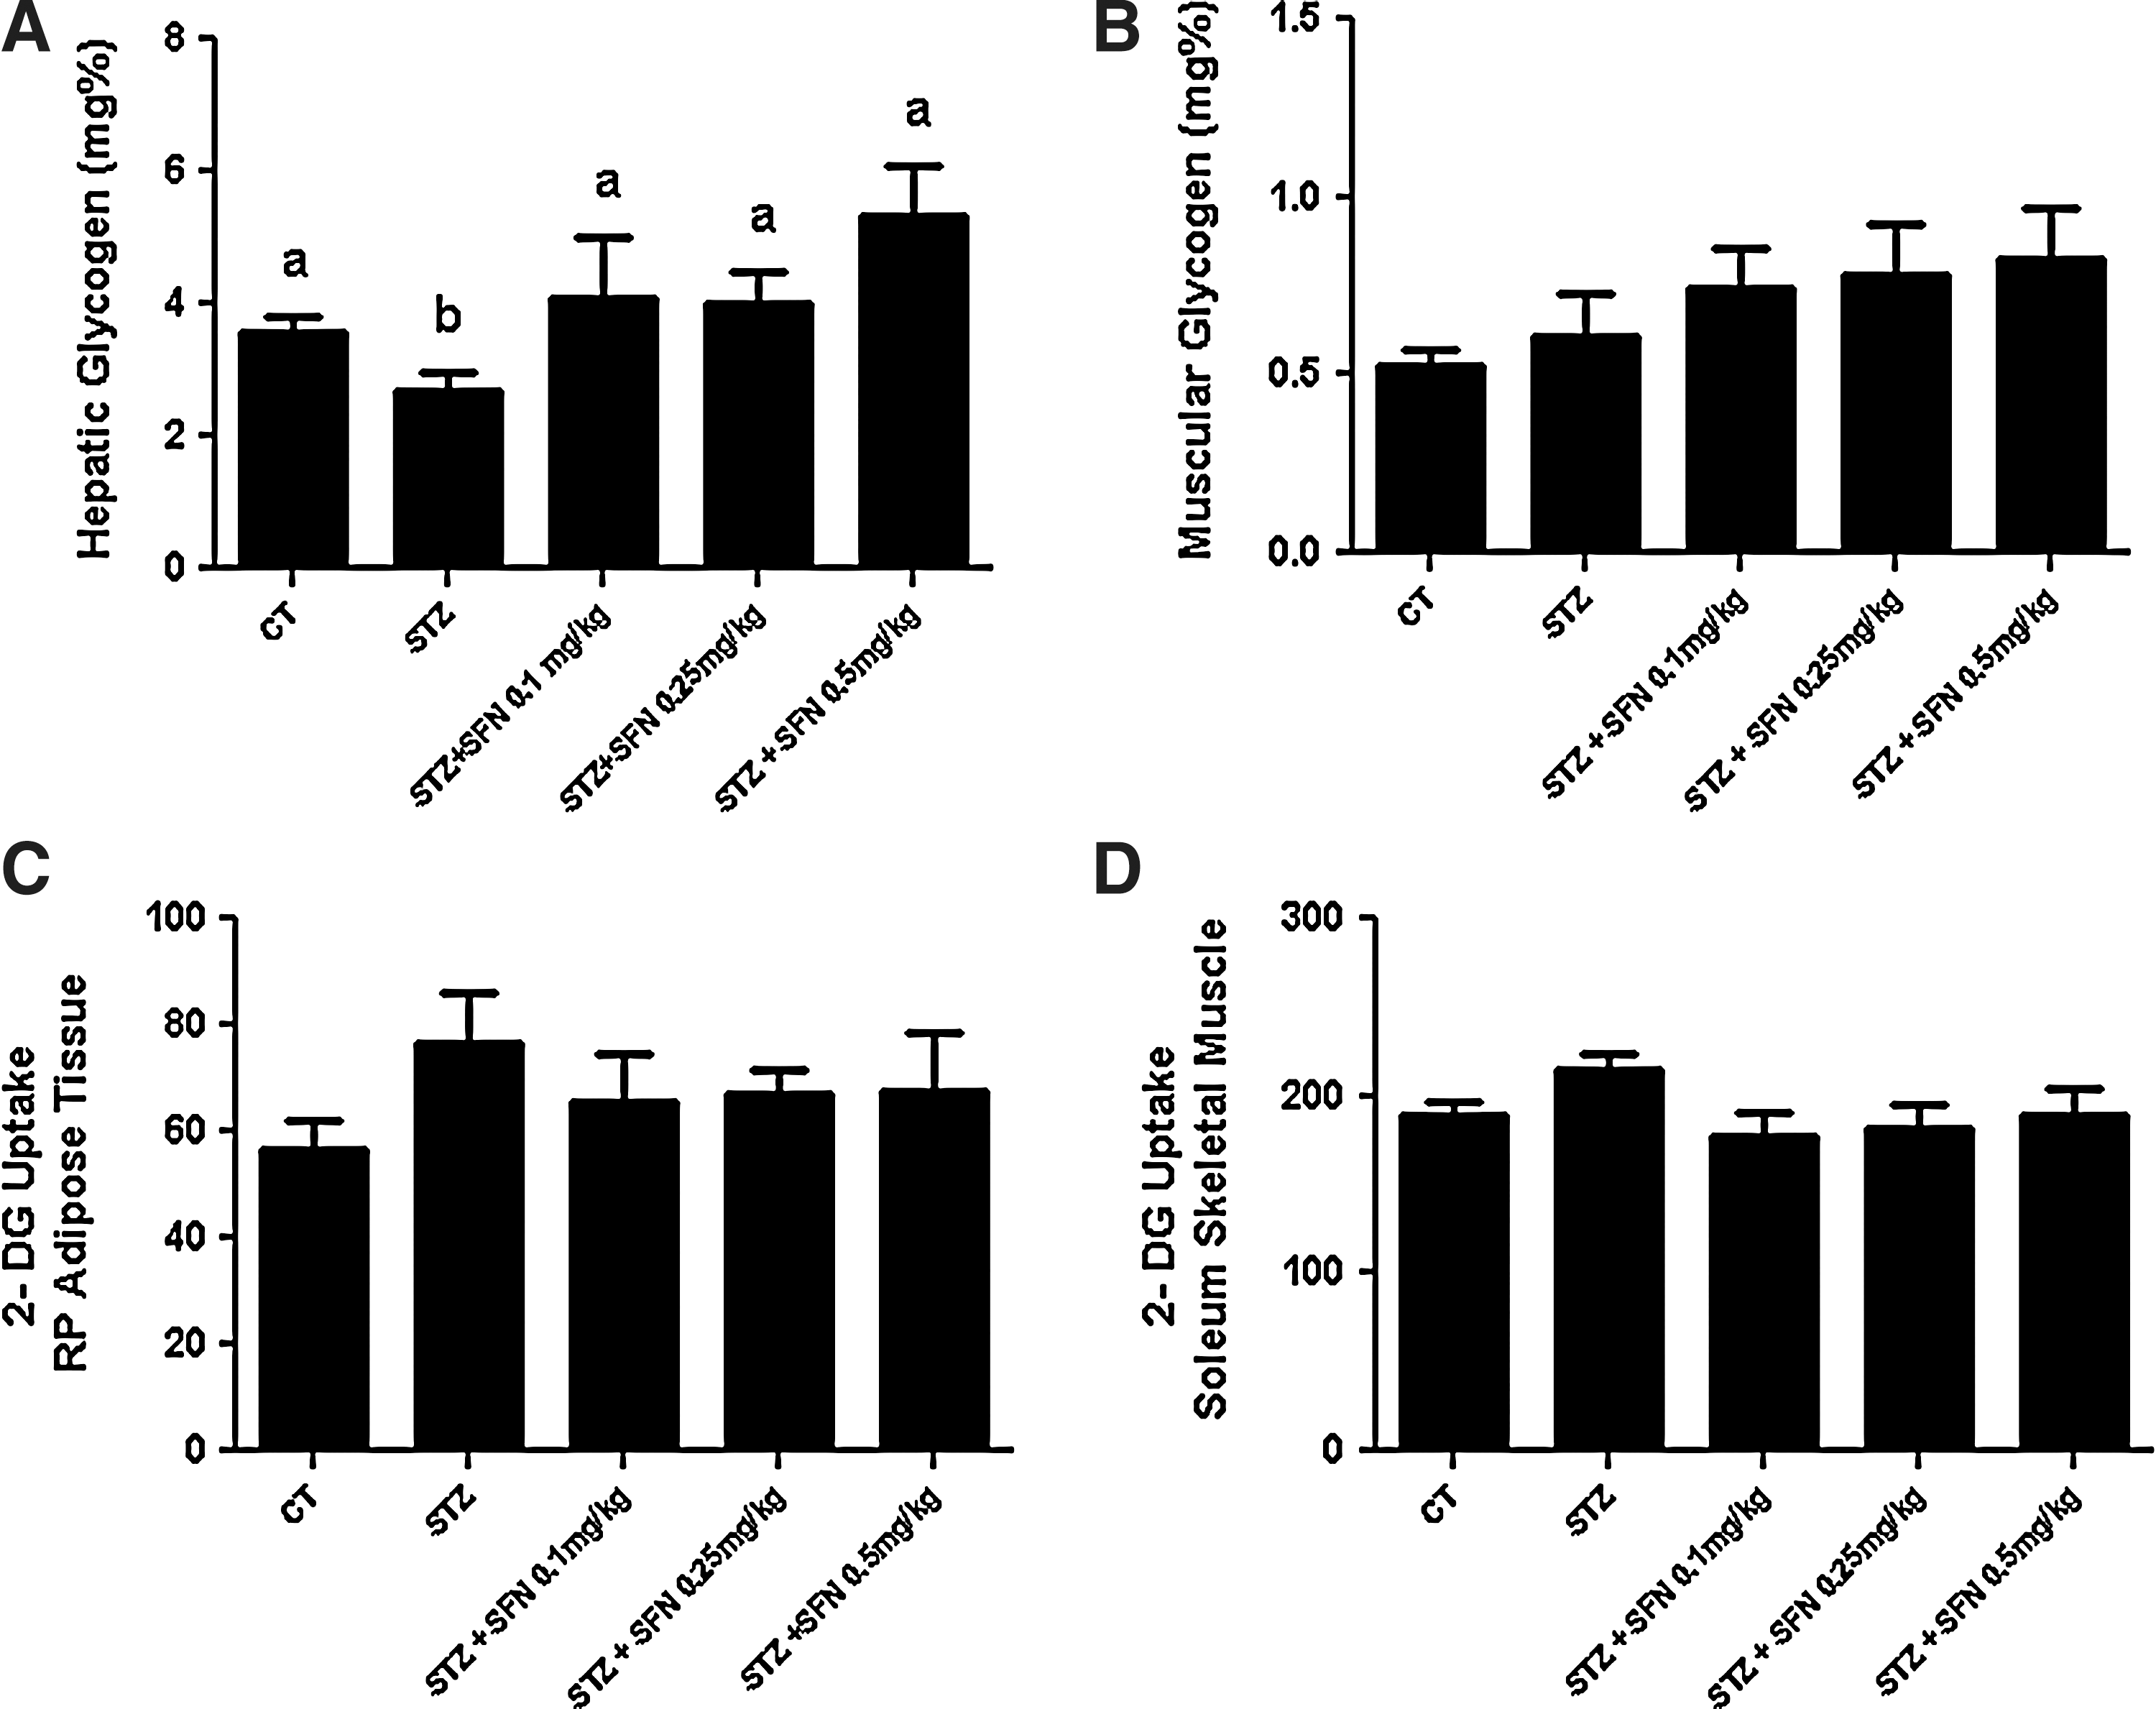
Glycogen concentration was measured to test this model of diabetes and the possible effect of SFN; once untreated, diabetic subjects usually present lower levels of this energetic substrate, especially in the liver. 22,23 According to this, hepatic glycogen was decreased in STZ compared with the CT, SFN0.1, SFN0.25, and SFN0.5 groups (Fig. 2A, P<.05), and no differences among the other groups were found (Fig. 2A, P>.05). On the other hand, no differences could be observed in muscular glycogen compared with the CT group (Fig. 2B, P>.05), although the concentration increased according to the SFN dose but without a statistically significant difference.
Glycogen concentration and 2-deoxy-glucose (2-DG) uptake of the groups (n=8).
2-deoxy glucose uptake was verified to infer the adipose tissue and muscle ability after SFN treatment and diabetes induction once these tissues are insulin dependent to uptake glucose. Retroperitoneal adipose tissue did not show any statistical differences among the groups (Fig. 2C, P>.05), although the STZ group showed an increase in this parameter compared with the CT group. This same pattern occurred in 2-deoxy glucose uptake in the soleus skeletal muscle of the STZ group, which was slightly higher than the CT group, but was not different from all the STZ+SFN groups (Fig. 2D, P>.05, respectively) and again without a statistically significant difference between all of them.
Biochemical parameters
Considering the most common comorbidities of diabetes, we evaluated the lipid profile, hepatic, and kidney markers of the animals after the treatments. The STZ group presented elevated levels of total cholesterol, compared with the control, and SFN doses were not able to reverse this alteration, once the SFN0.1, SFN0.25, and SFN0.5 groups were different from CT (Table 2, P<.05). However, the opposite was observed in serum TAG levels, where 0.1, 0.25, and 0.5 mg/kg of SFN improved this parameter compared with the STZ group, being similar to CT (Table 2, P<.05 and P>.05 respectively); while HDL cholesterol did not vary among them. Although hepatic TAG showed no differences, ALT and AST activity was twofold higher in the STZ and all STZ+SFN groups compared with CT (Table 2, P<.05). With regard to kidney function, the urea levels of SFN0.1, SFN0.25, and SFN0.5 were lower than the CT and STZ groups, which did not differ (Table 2, P<.05 and P>.05, respectively), and creatinine levels were increased in only the STZ group compared with the others (Table 2, P<.05), with all the STZ+SFN groups being similar to the CT group.
n=8. Data are expressed as mean±standard deviation or median (min-max). Statistical analysis performed with one-way ANOVA or Kruskall–Wallis test.
Different letters mean P<.05 between groups.
HDL, high-density lipoprotein; TAG, triacylglycerols; ALT, alanine aminotransferase; AST, aspartate aminotransferase.
Discussion
Diabetes care focuses primarily on glucose control and lipid lowering, in order to avoid the disease progression and the major deleterious consequences of it, such as liver dysfunction, diabetic nephropathy, and cardiovascular disease. In this way, research conducted on bioactive compounds that could exert positive effects against those alterations is very relevant. Due to this, the aim of this study was about SFN effects on the main markers of diabetes clinical treatment. Moreover, to our knowledge, there are no studies that evaluate oral SFN treatment and its effects with regard to these same parameters.
In this diabetes model, the STZ+SFN-treated groups presented a positive effect in glycemia by the administration of this compound before the STZ injection, which is cytotoxic to β-cells and can be used to induce experimental diabetes in rodents. 24,25 Fasting glycemia and the glycemic curve from the IRT of SFN-treated groups proposes a preservation of pancreatic β-cells, once these two parameters are standard methods of determining glucose intolerance and diabetes diagnosis. 26,27 To perform the glycemic curve, we choose not to perform a glucose tolerance test, because the STZ group already has fasting hyperglycemia without a glucose load. The SFN mechanism of action on glucose metabolism was demonstrated by Song et al., 18 in a model of diabetes induced with STZ, which presented a decrease in reactive oxygen species production and an inhibition of the NF-κB pathway in the pancreas, thus preserving insulin secretion.
Weight loss is very common in decompensate diabetes, and decreased body weight in diabetic rats suggests the degradation of structural proteins that is possibly due to high levels of counter-regulatory hormones, 28,29 which also could explain the lower liver weight presented by the STZ and SFN groups, once not only structural proteins but also visceral proteins are susceptible to degradation. 30 With regard to this, SFN was not able to reverse these alterations in any group. Most of the times, protein degradation is followed by an increased lipolysis to sustain gluconeogenesis, decreasing adipose tissue, such as presented by the STZ group. However, all SFN doses succeeded to prevent the loss of retroperitoneal and epididymal adipose tissue, which were similar to the CT group.
To sustain hormonal catabolic effects, hepatic glycogen is an important key for the maintenance of blood glucose, and a decrease of it is an expected alteration that is related to the lack of insulin, 22,23 as can be observed in the STZ group. Lower levels of hepatic glycogen accentuate the degradation of body proteins, which are known to contribute as an energy source in gluconeogenesis according to the carbohydrates that are becoming unavailable. 31 This information corroborates to the final body weight and hepatic glycogen level presented by the STZ group. The three doses of SFN prevent this decrease, keeping the hepatic glycogen levels of these groups not only similar to the CT group, but also a little higher. In this way, it is known that some phytochemicals are capable of preventing the conversion of glucose-6-phosphate to glucose by the inhibition of glucose-6-phosphatase, preserving the glycogen concentration. 20,32,33 Surprisingly, no differences were found in muscular glycogen between the groups, as muscular glycogen usually decreases in animal models of diabetes using STZ, 34,35 and we assume that these levels do not decline in the STZ group due to the time of the disease (10 days), which is a limitation of our study, because it is shorter than most of the studies that quantify muscular glycogen in rodent models. 35,36 Regardless, the muscular glycogen content in the STZ+SFN groups slightly increased according to the increase in the SFN dose.
Another unexpected response was the absence of alterations in glucose uptake in the adipose tissue and soleus muscle in diabetic animals. Commonly, untreated diabetes impairs the ability of adipose tissue and muscle to uptake glucose properly due to the glucose transporter 4 present in them that enables them to be insulin dependent. 37,38 In this sense, a work by Cameron-Smith et al. 39 demonstrated that the in vivo muscular and adipose tissue uptake of 2-Deoxy-Glucose (2-DG) in STZ-diabetic rats can be higher than that in nondiabetic rats, proposing that this may occur in an attempt to compensate the alterations in insulin action.
Besides changes in glucose metabolism, other common features of diabetes are dyslipidemia, hepatic dysfunction, and nephropathy. 30,40,41 Unlike what was expected, SFN doses increased total cholesterol, ALT and AST enzymatic activity and decreased urea levels. The frequent elevation of transaminases levels is a sign of liver diseases, 41 and most of the time, hepatic dysfunction in diabetes occurs due to nonalcoholic fatty liver disease, mediated by the accumulation of TAG in the liver, which we could not observe. In the same way, the dose-dependent decrease of urea below CT levels could be considered indicative of the impairment of the urea cycle, as an accentuated decline of this metabolite could be related to hepatotoxicity. 42 We suggest that almost all these negative effects on total cholesterol, transaminases, and urea levels could be modulated by the association of STZ+SFN, as only STZ increases total cholesterol and ALT and AST levels besides decreasing urea levels, and the phytochemical may enhance this effect. Once our research group used another model of diabetes induction with a highly palatable diet for 4 months, concomitantly to SFN 1 mg/kg oral treatment daily, and this model exhibited no differences between the groups with regard to any of these same parameters (Souza et al., unpublished data).
On the other hand, SFN was efficient to decrease serum TAG in a dose-dependent way, while HDL cholesterol, a protective molecule in the cardiovascular system, was apparently not affected by either STZ or SFN administration. All SFN doses demonstrated a protective effect against the toxicity of hyperglycemia in the kidney by lowering creatinine levels, which is very promising, because nephropathy is one of the most prevalent consequences of decompensate diabetes. 3,29 A recent work by Zheng et al. 43 showed that the molecular mechanism of SFN protection against diabetic nephropathy is through Nrf2 activation of antioxidant enzymatic defenses (NADPH-quinone oxireductase and γ- glutamylcysteine synthetase) and suggests that this same pathway could exert an insulin-independent action in the reduction of blood glucose.
In summary, our study presents some beneficial effects of SFN in the prevention of diabetes that is induced by STZ related to the maintenance of glycemic levels, hepatic glycogen, and kidney function which are similar to nondiabetic animals, besides the amelioration of serum TAG levels. The duration of diabetes in this study was not only a limitation in some parameters, such as muscular glycogen and 2-DG uptake in the adipose tissue and muscle, but it was also an attempt to understand the acute effects of diabetes on this model of prevention. The negative findings about total cholesterol, transaminases activity, and serum urea levels are possibly due to the enhancer effect of SFN on STZ derangements, once that in another model of diabetes induction without STZ and even with a higher dose of SFN, during more time of treatment, none of these alterations could be observed. More studies are required to fully explain the molecular mechanisms of SFN in peripheral tissues, although some positive effects could be inferred by the present data.
Footnotes
Acknowledgment
This work is dedicated to the life and memory of Marcos Luiz Santos Perry, a beloved friend, a mentor, and a professor of Biochemistry.
Author Disclosure Statement
No competing financial interests exist.