
Abstract
Puerarin (PU) and curcumin (CU), used commonly in traditional Chinese medicine and Ayurveda, have been shown to possess potent anti-inflammatory, anti-oxidation, and neuro-protective properties. Despite the experimental success of CU and PU in in vitro and animal models, their effectiveness has not yet been demonstrated in clinical trials, possibly because of their poor bioavailability. We hypothesized that gold nanoparticle (AuNP)-formulated PU (PU-AuNP), CU (CU-AuNP), or a combination of PU and CU (PU-CU-AuNP) were a more effective and nontoxic alternative to their bulk (nonformulated) counterparts. To test the hypothesis, bioavailability, therapeutic potency, and toxicity of bulk CU and/or PU were compared with those of their nanotized counterparts in rats subjected to the lipopolysaccharide (LPS)-induced inflammation. This study showed that a 20-mg/kg dose of bulk PU or a mixture of PU and CU did not, while their nanotized counterparts, PU-AuNP, CU-AuNP, or PU-CU-AuNP, effectively suppressed the LPS-induced inflammation and cytotoxicity in rats. In addition, PU-CU-AuNP was more potent than PU-AuNP or CU-AuNP alone. The blank AuNP (bAuNP) at ≤40 mg/kg dose did not cause any adverse effects (blood and brain lactic acid concentrations, kidney function, and neuronal apoptosis were measured) in animals. Therefore, the present observations suggest that a bi-functional AuNP loaded with CU and PU may effectively suppress the LPS-induced inflammation and cytotoxicity provided the following conditions are met: (1) The AuNP dose is at or below the no-effect dose; (2) the nanoparticles release a therapeutic dose of CU and PU in vivo; and (3) the active ingredients are released into the intracellular component of the brain.
Introduction
K
Numerous approaches, including adjuvant treatment, liposome coupling, and nanopreparations, have been undertaken to improve the bioavailability of CU or PU. 16,18 –21 The nanopreparations of CU or PU allowed a rapid absorption, high plasma half life (t 1/2) and improved the blood–brain uptake of the herbs in vivo. 22,23,24 In the present study, we have designed and validated gold nanoparticles (AuNPs) functionalized with PU (PU-AuNP), CU (CU-AuNP), or a combination of PU and CU (PU-CU-AuNP) that, when taken up by the lysosomes, released CU and/or PU into the cytoplasm. We hypothesized that the bi-functional AuNP containing both CU and PU (PU-CU-AuNP) was more effective than the mono-functionalized PU- or CU-AuNP in suppressing the lipopolysaccharide (LPS)-induced acute toxicity without significant adverse effects in rats.
Although functionalized nanoparticles have been shown to improve the bioavailability of low-bioavailable compounds, 22,23,24 their use in clinical treatment has not gained acceptance due to certain technological difficulties. Unlike the bulk compounds whose medicinal activity and toxicity depend on the dose, nanoparticles' medicinal activity and toxicity, in addition to the dose, also depends on their (1) size, as studies have shown that the bioavailability, the medicinal properties, and the toxicity of 10, 50, and 100 nm nanoparticles may be considerably different; (2) functionalization since polyethylene glycol (PEG) functionalized neutral/zwitterion nanoparticles may be more bioavailable than cationic nanoparticles; and (3) reactivity since nanoparticles' binding to plasma proteins may alter their bioavailability and t 1/2. 25 –29 Taken together, these observations indicate that, at a given dose, the data collected from different sizes of or from differently functionalized nanoparticles may not be comparable. Therefore, it is essential to characterize the bioavailability, medicinal properties, and possible adverse effects of nanoparticle preparations for their intended application. In the present study, the beneficial and adverse effects of nanoparticle-formulated PU and/or CU were assessed in rats receiving blank AuNP (bAuNPs) (no CU or PU), a mixture of bAuNP and free CU and PU, PU-AuNP, CU-AuNP, and PU-CU-AuNP and then challenged with an i.p. injection of LPS. The following indices were measured.
(1) The bioavailability and bio-distribution by analyzing Au (from the nanoparticles), CU, and PU in blood and different tissues,
(2) The safety and nonspecific toxicity by measuring kidney function, cytotoxicity, and neuronal apoptosis.
(3) The protective effects of the nanopreparations against the LPS-induced cytotoxicity, neuronal apoptosis, and inflammation.
Materials and Methods
Synthesis and characterization of nanoparticles
Experimental procedures for the synthesis and characterization of AuNPs are described in the Supplementary section (Supplementary Data are available online at
Animal experiments
Control study
To establish the baselines, male rats (Sprague Dawley) weighing ∼200 g (named G1 rats) were housed in metabolic cages for 24 h urine collection. Then, rats were divided in two sub-groups of five rats in each: (1) G1+LPS subgroup receiving by i.p. injection 100 μL of LPS (1 mg/mL) and (2) G1−LPS subgroup receiving by i.p. injection 100 μL sterile phosphate-buffered saline (PBS) (control for LPS) via i.p. injection (Table 1). 30 At different time intervals after LPS injection, groups of rats were anesthetized by halothane inhalation and their blood, liver, and brain samples were collected. 3 The samples were either analyzed immediately or stored at −80°C for further analysis.
bAuNP—not functionalized.
Free CU and PU mixed with bAuNP.
PU functionalized AuNP (PU-AuNP, yielded comparable Au and PU dose).
CU functionalized AuNP (CU-AuNP, yielded comparable Au and PU dose).
PU and CU functionalized AuNP (yielded comparable Au, PU and CU dose).
LPS (100 μg in sterilized isotonic saline) injected intravenously for inflammation, or matrix (isotonic saline) alone injected for control.
d, dose-response study; t, time-course study; i, Variable dose regime—0, 10, 20, 40, 60, 80, and 100 mg/kg; ii, fixed dose—20 mg/kg; iii, tissue samples collected at a fixed time after; iv, tissue samples collected at different time intervals after LPS (or matrix) injection; bAuNP, blank gold nanoparticle; CU, curcumin; LPS, lipopolysaccharide; PU, puerarin.
The dose-response study
Male rats (Sprague Dawley) weighing ∼200 g were divided into five groups: G2d (received bAuNP), G3d (received a mixture of bAuNP, CU, and PU), G4d (received PU-AuNP), G5d (received CU-AuNP), and G6d (received PU-CU-AuNP) as shown in Table 1. Rats were housed in a metabolic cage for 24 h urine collection. As shown in Table 1, rats of G2d received, by intravenous (tail-vein) injection, different doses (5, 10, 20, 40, 60, 80, and 100 mg/kg, n=10 for each dose) of nanoparticles as described in Table 1. At 5 h after the injection, rats of each group were divided into two sub-groups of five rats in each: “+LPS” subgroup receiving 100 μL of LPS (1 mg/mL) and “−LPS” subgroup receiving sterile PBS (control for LPS) via i.p. injection. 30 At 10 h after LPS injection, rats were anesthetized by halothane inhalation, and their blood and brain samples were collected. 11 The samples were either analyzed immediately or stored at −80°C for further analysis.
Time-course study
Male (Sprague Dawley, ∼200 g) rats were divided into five groups: G2t (received bAuNP), G3t (received a mixture of bAuNP, CU and PU), G4t (received PU-AuNP), G5t (received CU-AuNP), and G6t (received PU-CU-AuNP). The animals of each group were given 20 mg/kg (determined after completion of the dose-response studies) of different nanoparticles as described in Table 1. After 5 h, rats were divided into two sub-groups and injected with either LPS (+LPS subgroup) or saline (−LPS subgroup) as described earlier. At different time intervals after LPS or saline injection (0–96 h after LPS injection), five rats from each group were anesthetized by halothane inhalation, and their blood and brain samples were collected. 3 Brain cortices were either processed immediately for isolation of neurons for analysis of apoptotic cells or frozen in liquid nitrogen. Frozen samples were analyzed for (1) analysis of Au, CU, and PU as described earlier and (2) analysis interleukin (IL)-1β, IL-10, and matrix-metalloprotein (MMP)-9 concentrations using enzyme-linked immunoassay (ELISA) in extracted proteins.
Sample analysis
Bio-distribution of Au, PU, and CU
Analysis of Au: Approximately 0.2–0.3 g of brain sample or 0.5 mL of blood was mixed with 5 mL of aquaregia and digested for 24 h. Each sample was diluted 1:1 with a solution of 2 ppm yttrium in dilute nitric acid serving as an internal standard. The instrument was calibrated using a solution of 1 ppm Au and 1 ppm yttrium in 50% aquaregia. The samples were introduced in a segment flow mode of a flameless atomic absorption spectrophotometer (Beckman model 485) by the method described by Pedersen and Graabak. 31 Au concentration was determined using a calibration curve. The brain Au concentrations were normalized to total tissue weight.
Analysis of PU and CU: Brain cells and isolated neurons were lysed using 400 μL/1010 cells, lysis buffer [20 mM Tris-HCl (pH 7.5), 150 mM sodium chloride, 1 mM sodium ethylene-diamine tetraacetic acid, 1 mM ethylene glycol tetraacetic acid, 1% Triton, 2.5 mM sodium pyrophosphate, 1 mM β-glycerophosphate, 1 mM sodium orthovanadate, and 1 μg/mL leupeptin] and clear supernatant was extracted with water-ethyl acetate mixture as described earlier. The aqueous and organic layers were separated and analyzed for PU (aqueous layer) or CU (organic layer) as previously described. 10,32
Assessment of AuNPs' safety concerns
Analysis of lactate in the brain and blood samples: Brains were frozen at about 25°C and powdered under liquid N2 in a mortar kept on dry ice using a pestle precooled in liquid nitrogen. Replicate portions of each well-mixed powdered sample were stored at −80°C. Lactate concentrations were determined using enzymatic methods previously described. 33
Assessment of kidney function: Blood and urine samples were analyzed for creatinine, protein, blood urea nitrogen, and 24 h urine nitrogen. 34 –37
Assessment of the therapeutic effects
Analysis of total neuron population in cortices: Brain cortices were removed and submerged in ice-cold phosphate-buffered saline. Then, cortices were processed for isolation of neurons as previously described. 38 Each cortex was chopped into small pieces and digested with papain (Worthington, Lakewood, NJ). The digest was overlaid onto a discontinuous density gradient of Optiprep ranging from 1.006, 1.006 to 1.030, 1.030 to 1.037, 1.037 to 1.045, 1.045 to 1.100, and 1.100 g/mL (15%–60%, top-to-bottom), respectively. Brain cells fractionated into phase 5c containing neurons were collected. 37 Neurons were incubated with anti-tubulinIII antibodies (raised in rabbit) for 4 h at room temperature. Then, the samples were incubated with Dynabeads (Dynal) labeled with goat anti-rabbit IgG (Jackson ImmunoResearch, West Grove, PA). The cells were selected using a Dynal magnetic particle concentrator. The beads were removed with DNase I, and the enriched neuronal preparations were loaded with calcein-acetomethoxy (2 μM) and subjected to flow cytometry as described next.
Analysis of apoptotic neurons in the brain: Brain samples were processed for isolation of neurons using gradient centrifugation as described earlier. 38 Fraction 5c was directly used to measure apoptosis. Cells from control and treated animals were washed with ice-cold isotonic Hepes buffer with 1.8 mM calcium chloride and centrifuged at 4°C and 500 g for 5 min. Supernatant was discarded, and the pellets were resuspended in the Hepes buffer to achieve 5×10⁶ cells/mL. Cells were incubated with 100 μg annexin-V (AnV) for 10 min at room temperature in the dark. Then, the cells were stained with 10 μg/mL propidium iodide (PI). For instrument (Coulter Cytomics FC500; Beckman Coulter, Fullerton, CA) calibration, untreated and treated cells were incubated with culture buffer alone (cell-1), PI (cell-2), AnV (cell-3), AnV, and PI (cell-4). Cell-1 population was used to bring the entire cell population on scale. With the settings from unlabeled cells, cells 2 and 3 were used to establish proper compensation. Then, cells 4 were analyzed to establish proper placement of a quadrant region. Quadrant 1 was for necrotic cells (AnV−PI+), quadrant 2 was for late apoptotic cells (AnV+PI+), quadrant 3 was for viable cells (AnV−PI−), and quadrant 4 was for early apoptotic cells (PI−AnV+).
Analysis of IL-1β, IL-10, and MMP-9 using ELISA: Both cortices were chopped and mixed with 200 μL of lysis buffer (500 μL of 1 M Tris HCl pH 9.5, 1 mL of 0.5 M sodium fluoride, 1 μL of 200 mM zinc chloride, 250 μL of 20 mg/mL phenylmethanesul-fonylfluoride, 50 μL of 200 mM sodium orthovanadate, 1 mL of 10% (v/v) sodium deoxycholate, and MiliQ water to 10 mL total volume) with an electric homogenizer. The mixture was homogenized for ∼1 min until tissue appeared broken. Then, 800 μL lysis buffer was added to bring total homogenate volume to 1 mL. The homogenate was placed on ice for 30 min. The homogenates was transferred to 1.5 mL ultracentrifuge tubes and centrifuged homogenates at 25,000 g for 15 min at 4°C. The supernatant was collected from each tube and stored on ice. Each supernatant was split into 180 μL aliquots and stored at −80°C for further analysis. One aliquot was used for protein quantitation. The following ELISA kits were used: IL-1β and IL-10 (Thermo Scientific, Rockford, IL) and MMP-9 (R&D Systems, Minneapolis, MN).
Statistical analysis
Data were recorded as mean±SD using Microsoft Excel. Statistical analysis was performed using ANOVA followed by Tukey's Multiple-Comparison Test or t-test at <0.05 significance level.
Results
Control rats
G1+LPS (control rats without AuNP receiving LPS) and G1−LPS (control rats without AuNP and LPS) rats did not contain Au, PU, or CU in their blood, liver, or brain samples. Blood lactate concentrations in G1−LPS rats were 1.9±0.3 mM. LPS injection significantly increased blood lactate concentrations that peaked at 24 h after the injection (Fig. 1A, plot 1). Kidney function was normal in both G1+LPS and G1−LPS rats (Table 2). Neuronal densities in the brain of G1−LPS and G1+LPS rats were 5×10⁶ neurons/mm3 cortex (mostly AnV−PI− neurons) and 4.1×10⁶ neurons/mm3 cortex, respectively, representing ∼10%–15% decrease (Fig. 1A, plot 2). LPS sequentially increased IL-1β (Fig. 1A, plot 3) followed by IL-10 (Fig. 1A, plot 4) concentrations. However, IL-1β peaked to ∼300% of basal values at 5–10 h after LPS injection, while IL-10 peaked to ∼200% of basal values at 24 h after LPS injection. Figure 1B shows fluorescence cytometric sorting of neurons at different stages of apoptosis, while Figure 1C shows the time course of change in AnV−PI−, AnV+PI−, AnV−PI+, and AnV+PI+ neurons. AnV−PI− neuronal enumeration decreased, while AnV+PI−, AnV−PI+, and AnV+PI+ enumeration increased gradually after LPS injection (plot 5 for G1+LPS rats).
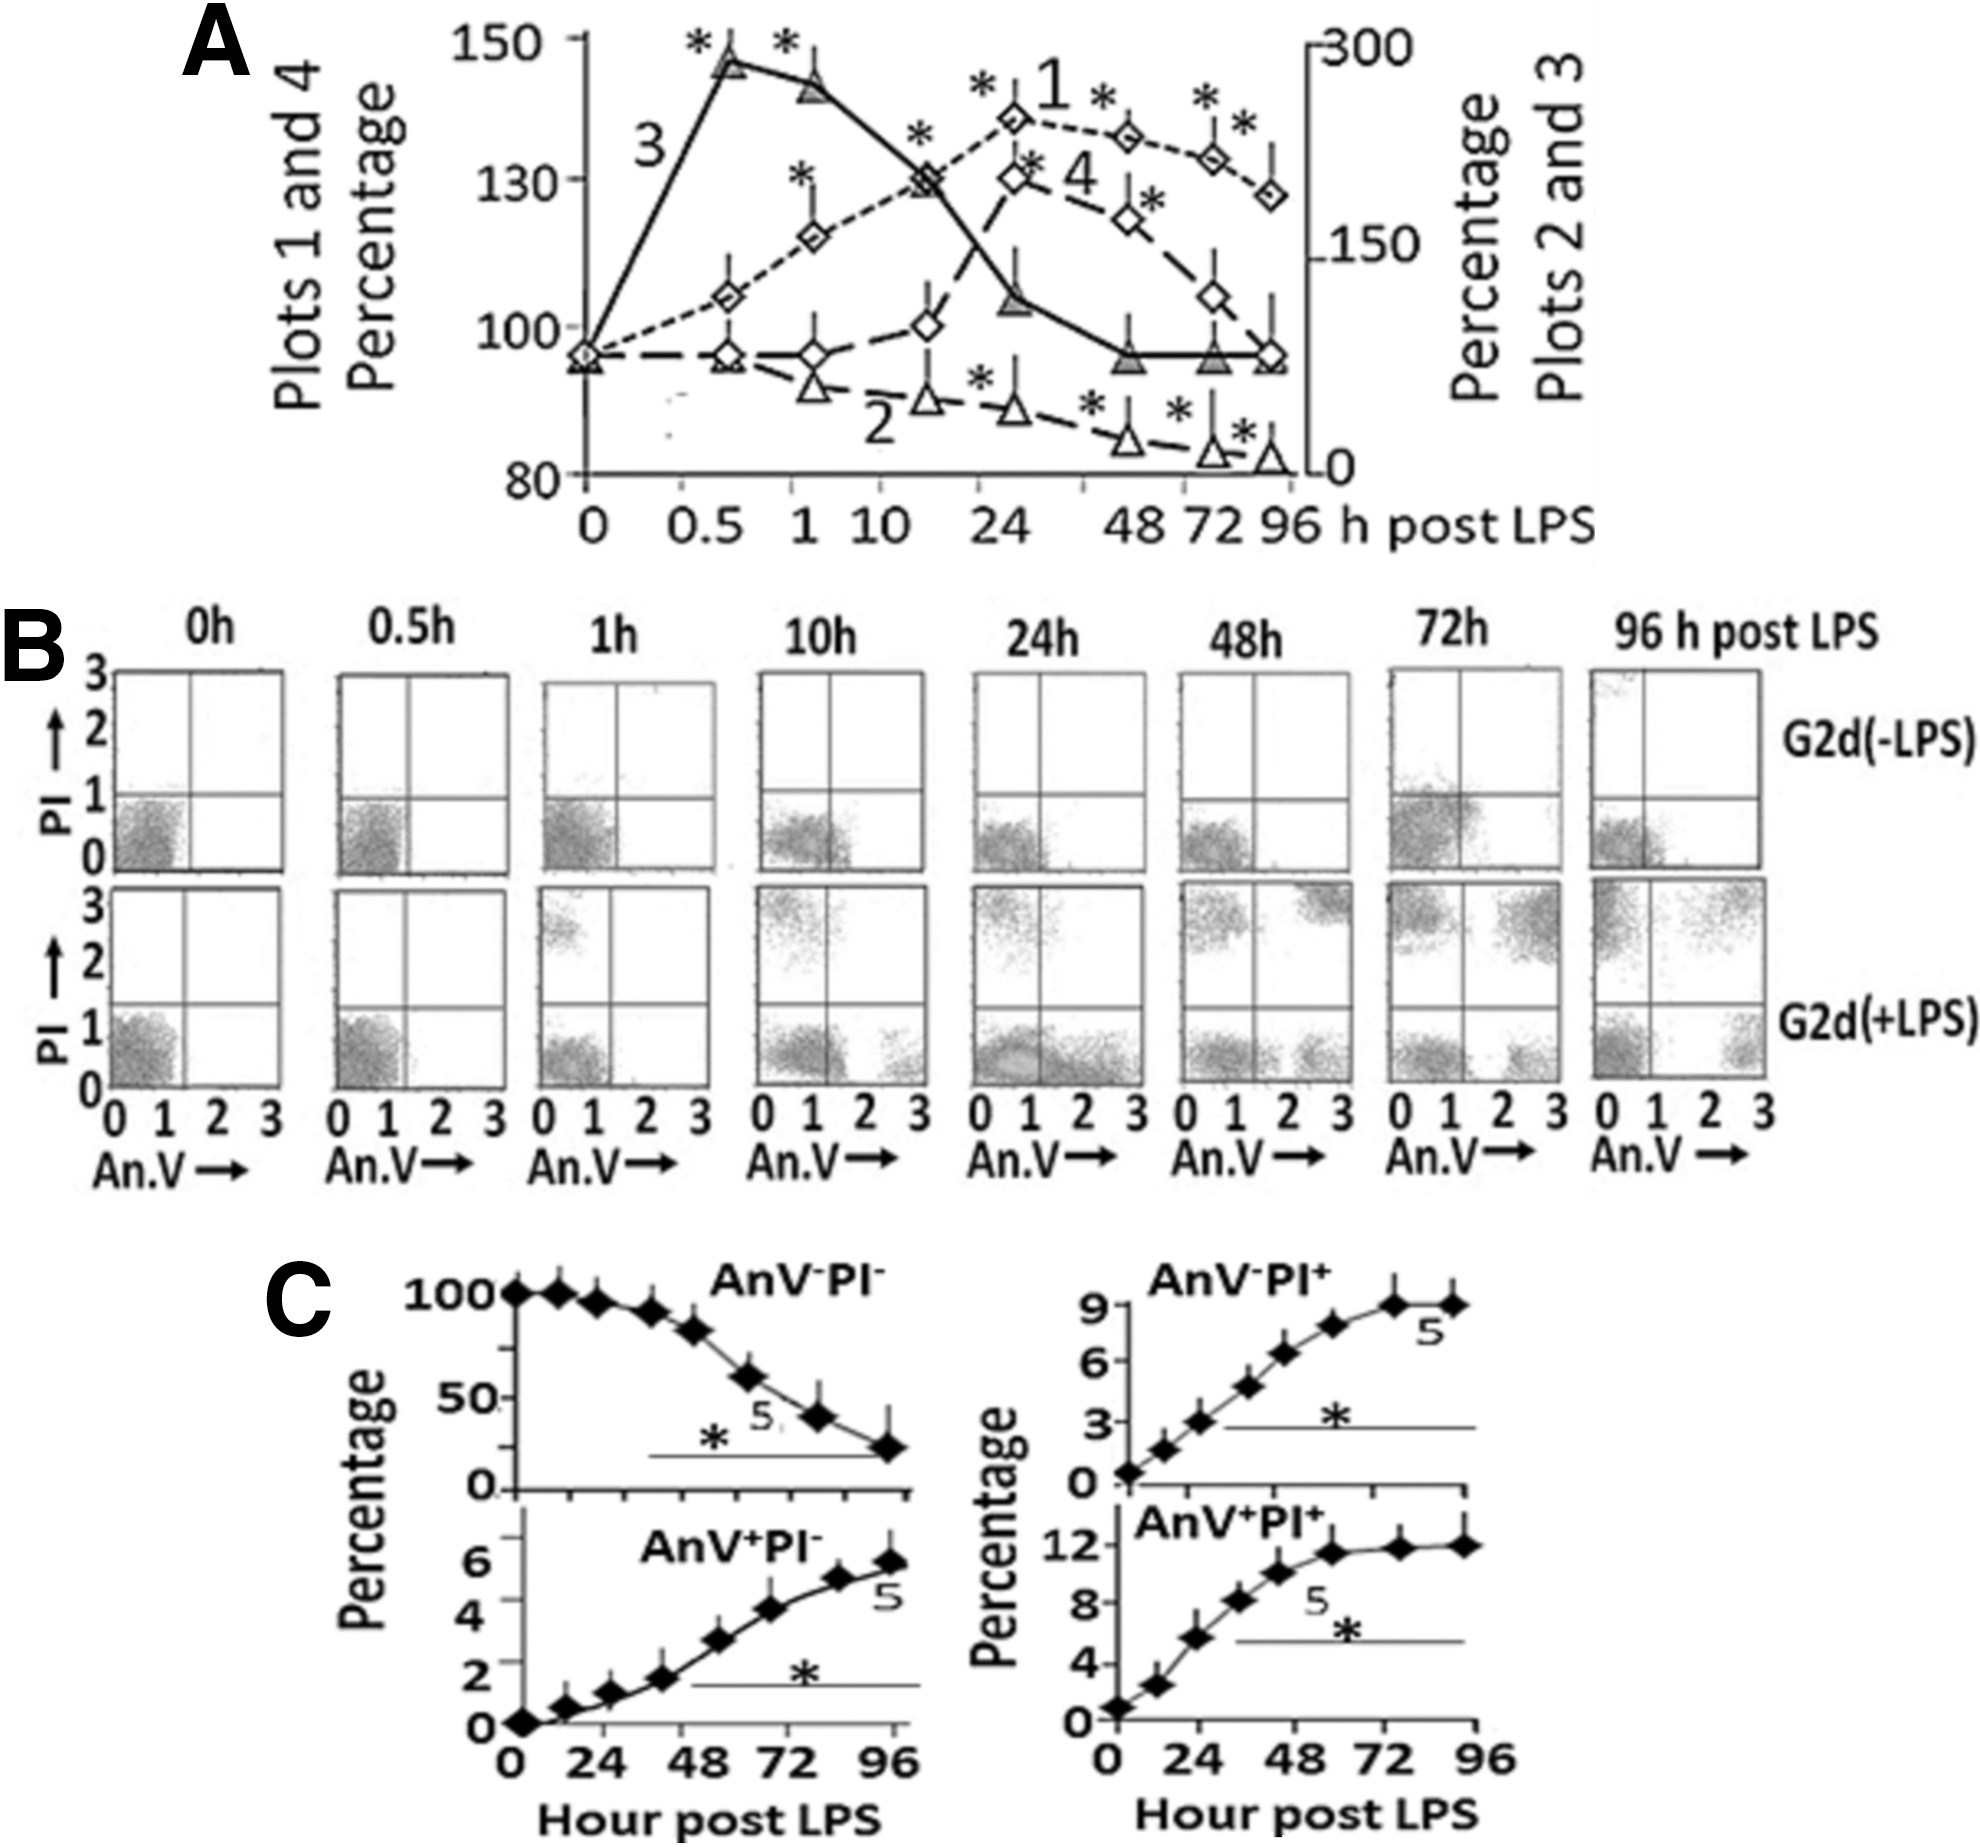
Acute effects of a single dose of LPS intraperitoneal injection in control (G1) rats.
P<.05 significant when compared with 0 h values.
B, blood; creat., creatinine; BUN, blood urea nitrogen; C/P, creatinine/protein; N ex., urine nitrogen excretion; pl., plasma; prot., protein; U, urine.
Nanoparticle-administered rats
Bioavailability of AuNPs, PU, and CU
Dose-response study:
AuNP: A linear relationship was observed between AuNP dose and Au concentrations in blood (Fig. 2A), liver (Fig. 2B), and brain (Fig. 2C) samples collected from the G2d−LPS (received bAuNP but not LPS), G3d−LPS (received a mixture consisting of bAuNP, CU and PU, but not LPS), G4d−LPS (received PU-AuNP, but not LPS), G5d−LPS (received CU-AuNP, but not LPS), and G6d−LPS (received PU-CU-AuNP, but not LPS) rats (plots 1–5, respectively). The slope of the plots for blood ranged from 0.22 to 0.28, which was significantly higher (0.17–0.1) than the slopes of the plots for liver and brain samples (Fig. 3A). Approximately 30% and 50% of AuNP (liver to brain ratio was 0.6) was extracted from blood into the brain and liver, respectively (Fig. 2). This indicated that bAuNP, PU-AuNP, CU-AuNP, and PU-CU-AuNP effectively accumulated into the brain, irrespective of their functionalization. Au concentration in “−LPS” and “+LPS” groups did not differ significantly (Fig. 3ii).
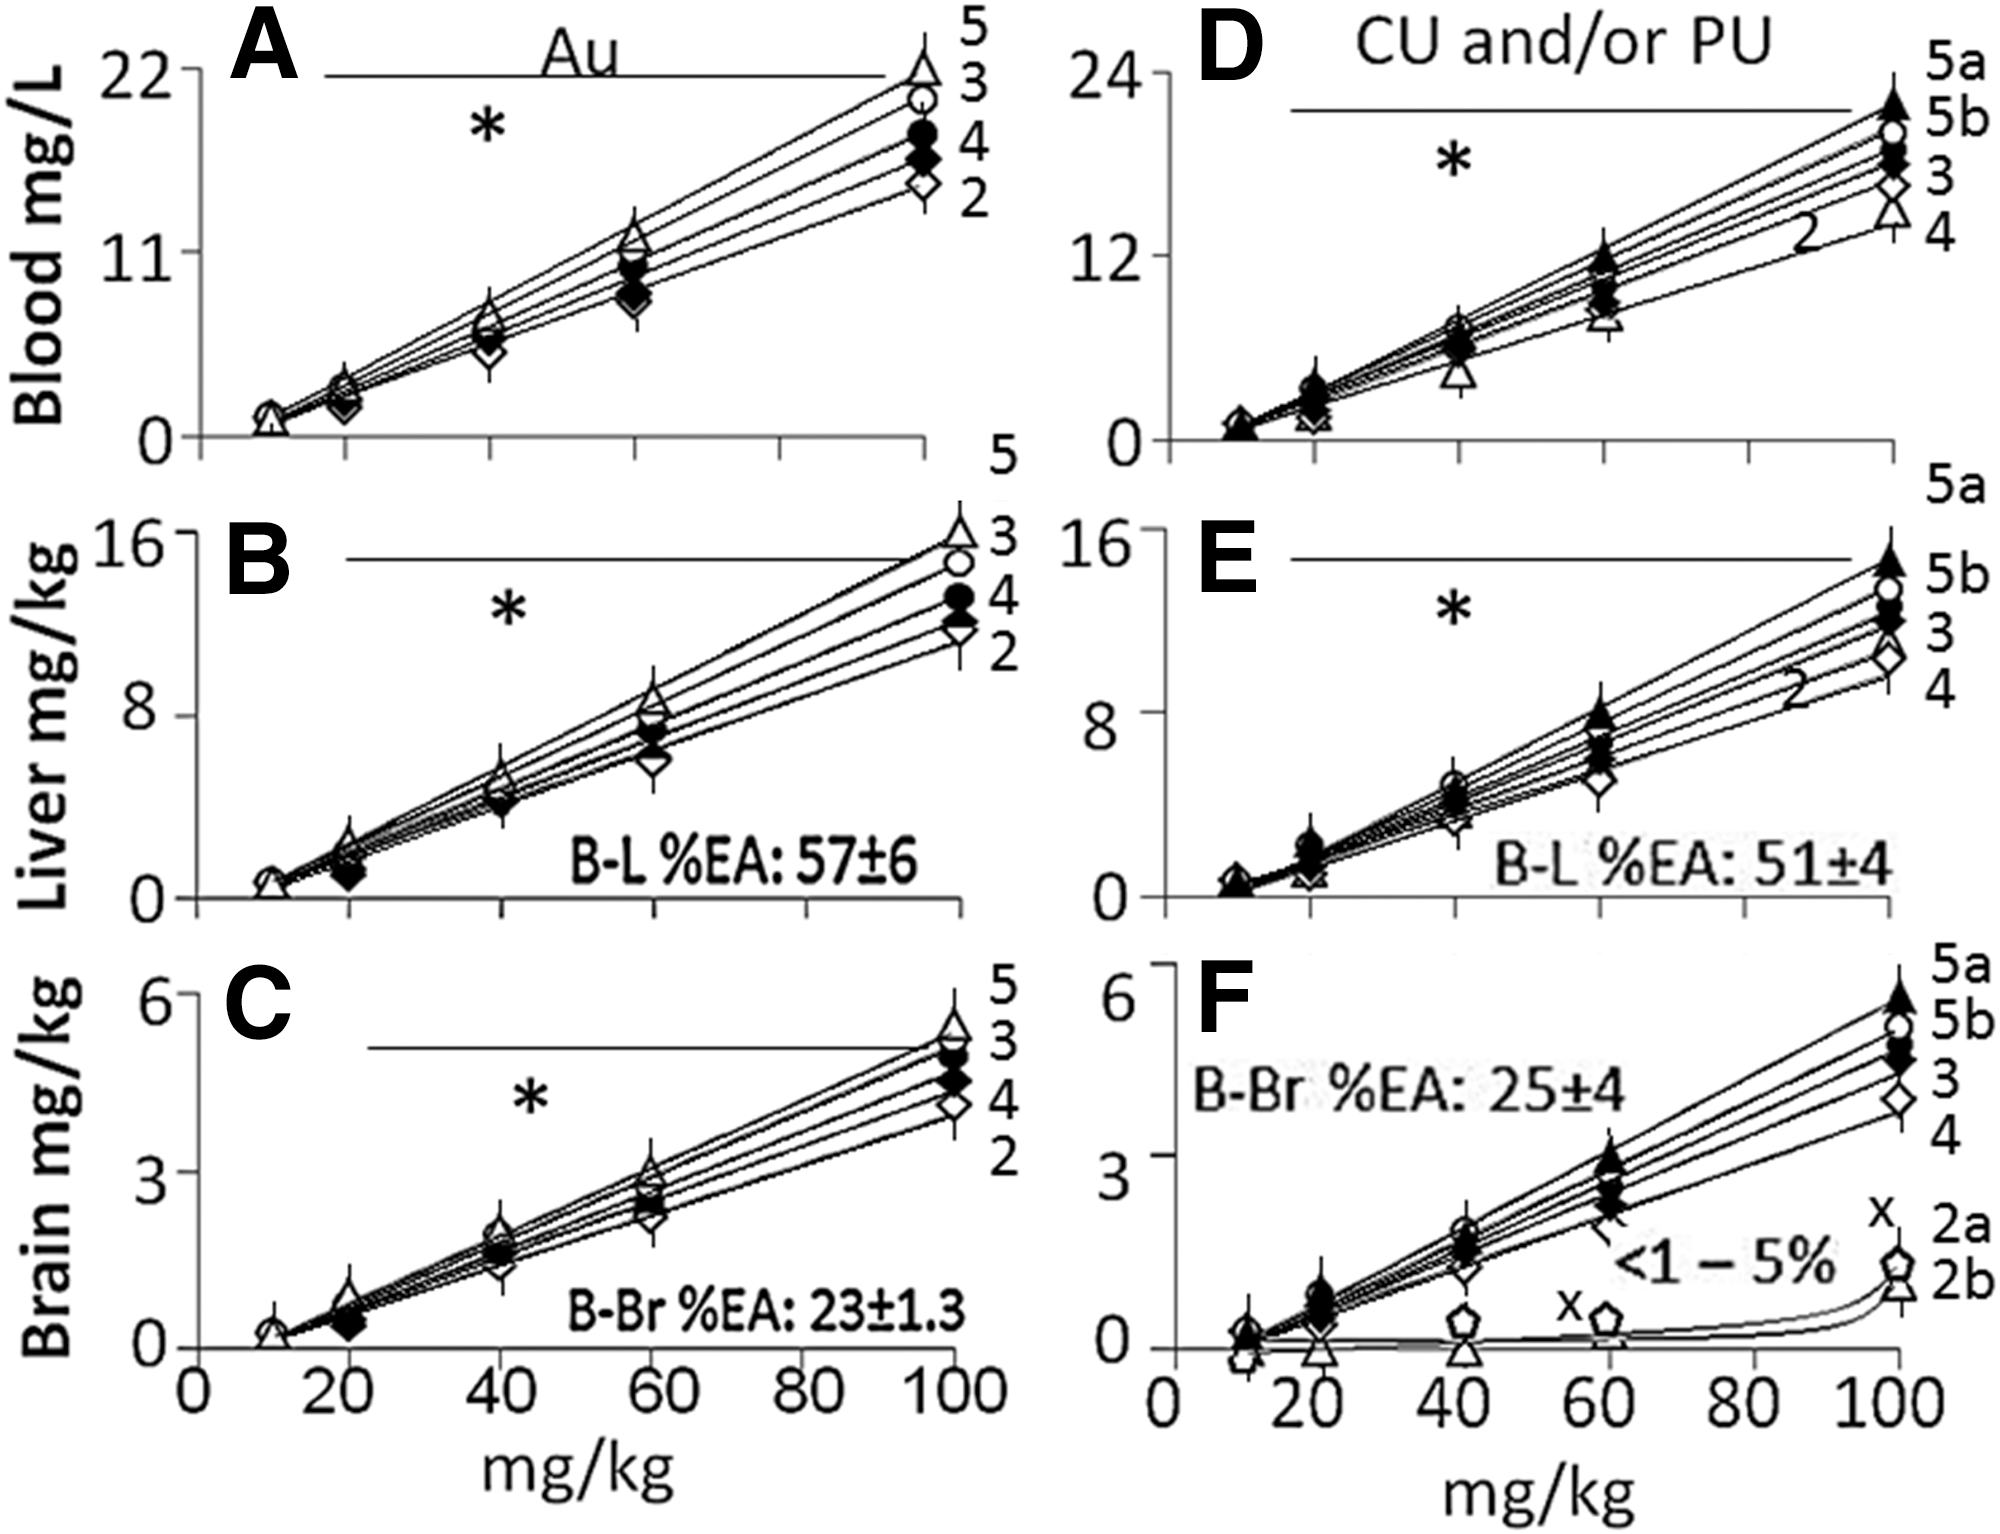
Dose-response curves for Au, curcumin (CU), and puerarin (PU) in the blood, liver, and brain samples from G2d [receiving blank gold nanoparticle (bAuNP)], G3d (receiving a mixture consisting of CU, PU, and bAuNP), G4d (receiving PU-AuNP), G5d (receiving CU-AuNP), and G6d (receiving PU-CU-AuNP) rats administered either LPS (+LPS subgroup) or the matrix alone (−LPS subgroup).

Slope of the dose-response curves for Au, PU, and CU concentrations in blood, liver, and brain samples from G2d, G3d, G4d, G5d, and G6d rats with (+LPS) or without (−LPS) LPS. Values are mean±SD, n=5. *P<.05, significant when compared with corresponding values for blood samples; x
P<.05, significant when compared with corresponding values for liver samples; @
P<.05, significant when compared with corresponding Au values for brain samples.
PU and CU: The dose-concentration curves for PU or CU were linear in (1) blood and liver samples from G3d−LPS rats (Fig. 2D, plot 2 for blood and Fig. 2E, plot 2 for liver) and (2) blood, liver, and brain samples from G4d−LPS to G6d−LPS rats (Fig. 2D, plots 3–5ab for blood, Fig. 2E, plots 3–5ab for liver, and Fig. 2F, plots 3–5ab for brain). The dose-concentration curves were nonlinear (Fig. 2F, plots 2a and 2b) for the brain of G3d−LPS rats. The slope of the G3d−LPS plots for the blood, liver, and brain samples were 0.0.25±0.05, 0.15±0.05, and <0.05 (Fig. 3C), respectively. Approximately 50% of the herbs were extracted from the blood into the liver, while less than 5% of the herbs were extracted from blood into the brain. LPS injection did ot modulate the PU and CU concentrations in the blood, liver and brain (Fig. 3D).
Time-course study:
AuNP: Fig. 4A shows the time course of change in blood Au concentrations in G2t−LPS rats given 20 mg/kg dose of bAuNP (G2t−LPS, plot 1), G3t rats given a mixture consisting of bAuNP, G4t−LPS rats given PU-AuNP (plot 3), G5t−LPS rats given CU-AuNP (plot 4), or G6t−LPS rats given PU-CU-AuNP (plot 5a for CU and plot 5b for PU). Au concentrations in blood peaked immediately after AuNP injection, remained unchanged for about 10 h, and then decreased gradually with t 1/2 value 8±0.9 h (Fig. 4A). Blood Au concentrations in the four groups did not differ significantly.
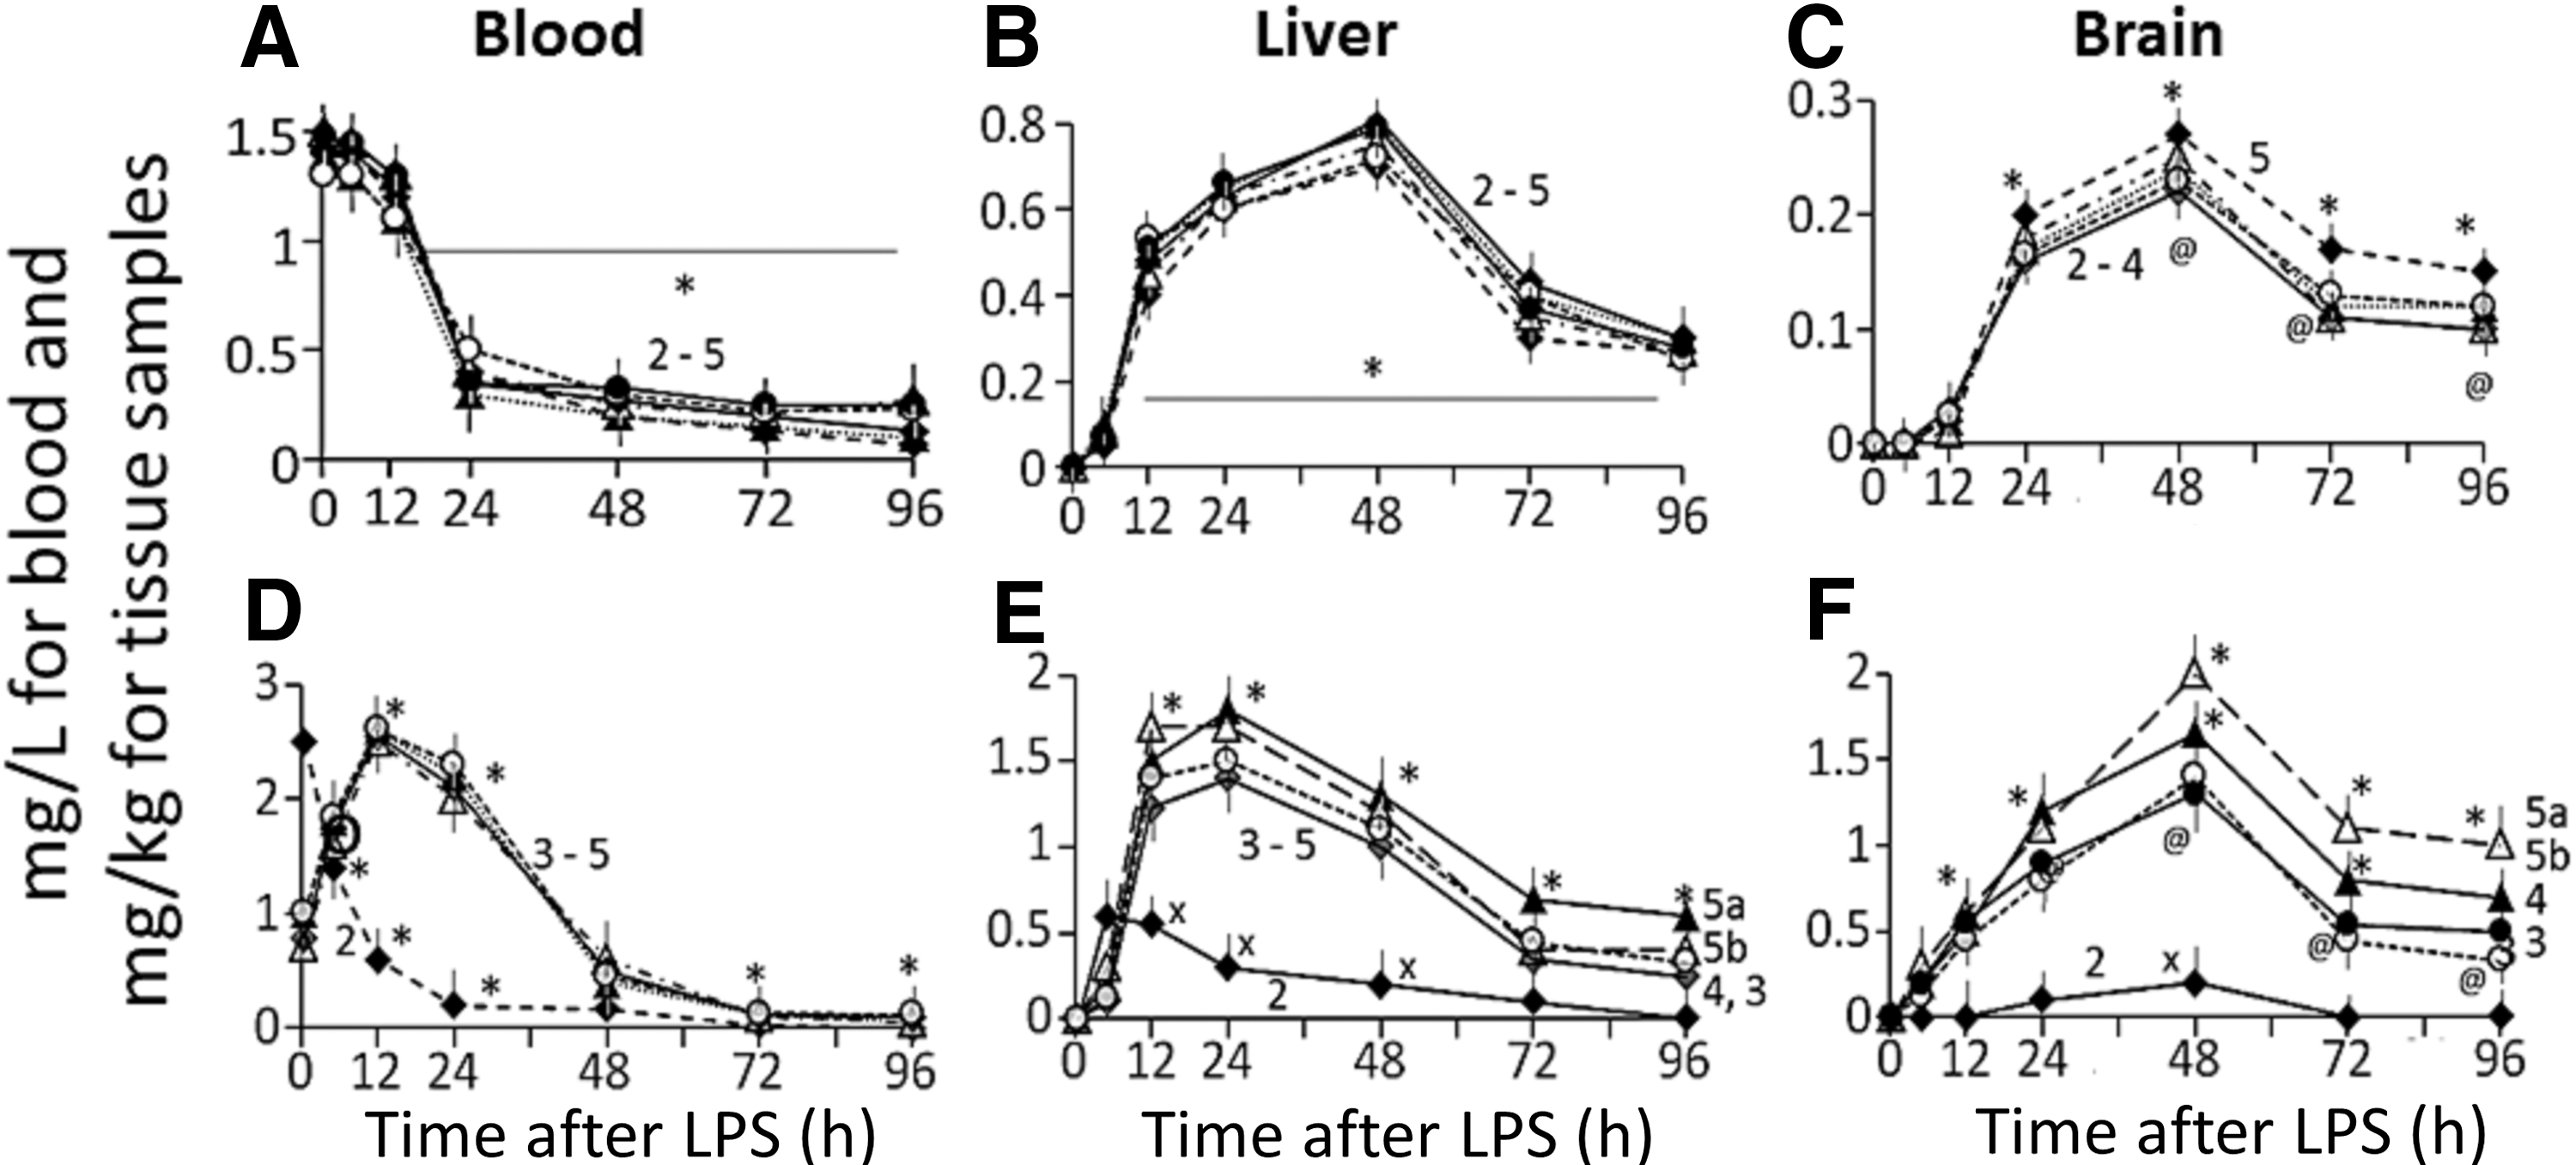
Time course of changes in Au, CU, and PU concentrations in the blood, liver, and brain samples from G2t−LPS (receiving bAuNP), G3t−LPS (receiving a mixture consisting of bAuNP, CU, and PU), G4t−LPS (receiving PU-AuNP), G5t−LPS (receiving CU-AuNP), and G6t−LPS (PU-CU-AuNP).
In the liver (Fig. 4B) and brain (Fig. 4C) samples, Au concentrations began increasing immediately after and peaked at 24 and at 48 h after the AuNP injection, respectively. Thereafter, a gradual decrease in Au concentrations occurred. Approximately 20% of the administered AuNPs remained in the tissue samples at 96 h after the nanoparticle injection. The AUC values for the timecourse of change in Au concentrations in the blood, liver, and brain samples from G3t−LPS, G4t−LPS, G5t−LPS, and G6t−LPS rats ranged from 1200 to 1700 mg·h/L for blood or mg·h/kg for tissue samples (Fig. 5A). The inter-group values or the values in “−LPS” and “+LPS” rats did not differ significantly (data not shown).
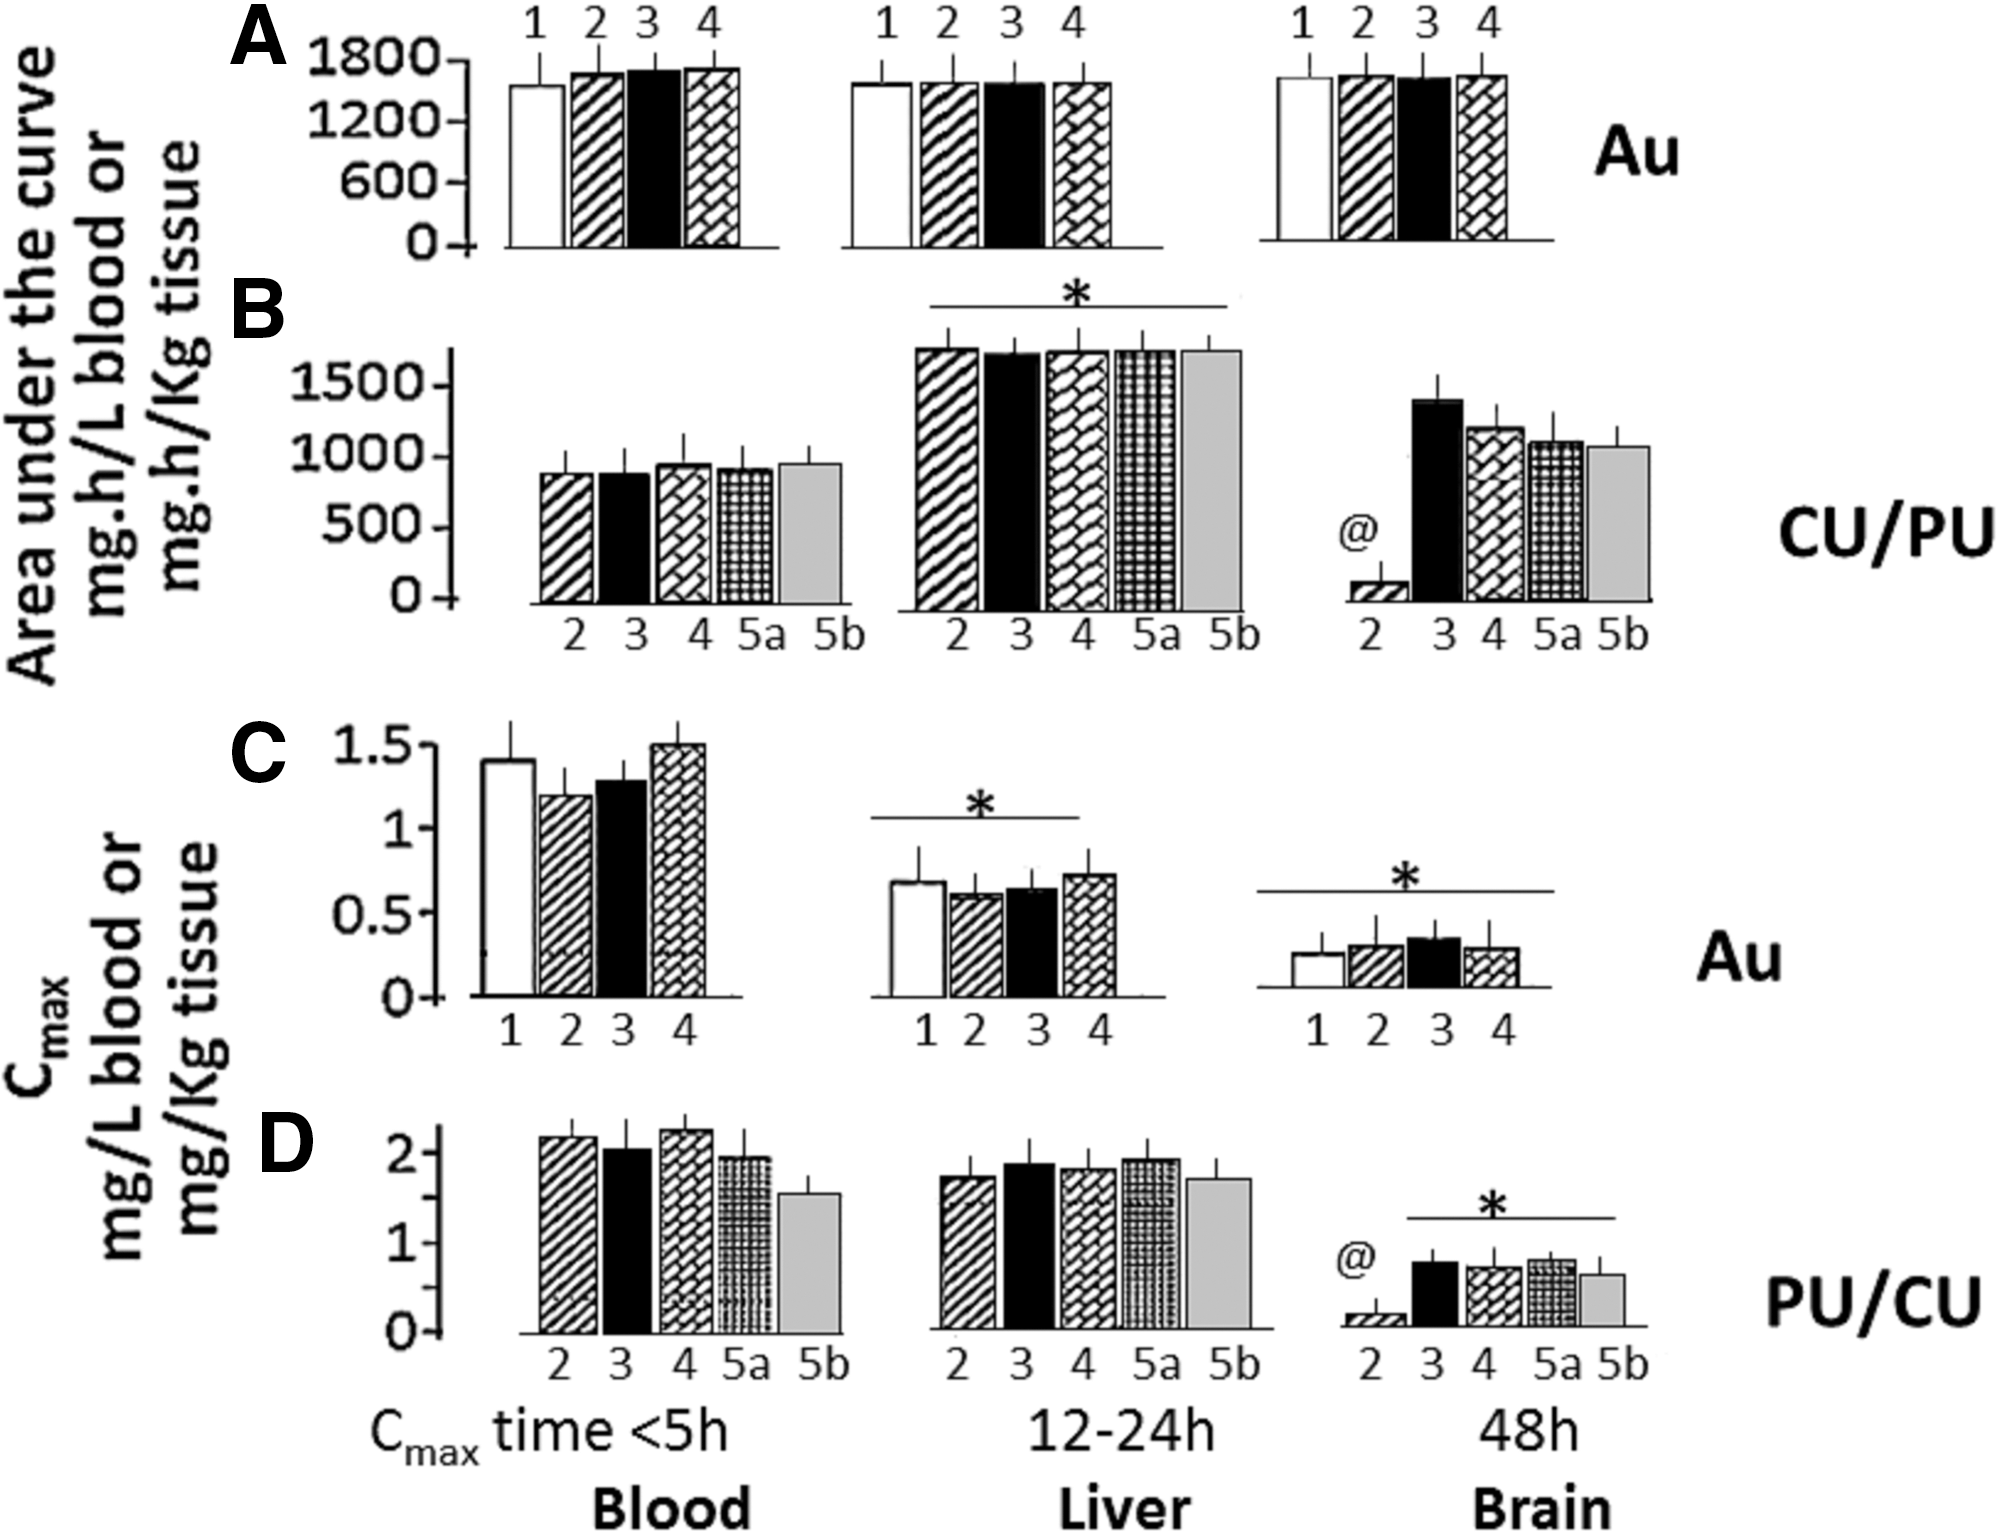
Area under the curve (AUC) and maximum concentrations (Cmax) of Au, CU, and PU in the blood, liver, and brain samples from G2t−LPS, G3t−LPS, G4t−LPS, G5t−LPS, and G6t−LPS rats.
PU and CU: In G3t−LPS rats, administration of a mixture consisting of CU, PU, and AuNP caused an immediate increase in blood CU and PU concentrations (the time courses of changes in PU and CU concentrations were comparable, thus PU data were not shown to avoid duplication), followed by a rapid decline (Fig. 4D, plot 2). CU and PU cleared blood within 48 h after the injection (Fig. 4D, plot 2).
PU and/or CU accumulation in liver (Fig. 4E, plot 2) was several fold higher than their accumulation in the brain (Fig. 4F, plot 2). In G4t−LPS and G5t−LPS rats, administration of PU-AuNP and CU-AuNP, respectively, caused a delayed increase in the herb concentrations in the blood (Fig. 4D, plots 3 and 4), liver (Fig. 4E, plots 3 and 4), and brain (Fig. 4F, plot 3 and 4). In G6t−LPS rats, PU-CU-AuNP injection also causes a delayed increase in PU and CU concentrations in the blood (Fig. 4D, plots 5a [CU] and b [PU]), liver (Fig. 4E, plots 5ab), and brain samples (Fig. 4F, plots 5ab). Brain CU concentrations peaked at 48 h after the injection and remained elevated for ∼96 h. Almost 20% of accumulated CU and PU remained in the brain and liver at 96 h. LPS injection did not modulate the time course of changes in blood and tissue PU and CU concentrations (data not shown to avoid duplication). The AUC and Cmax values for the time course of change in PU and CU concentrations showed the following patterns: AUC—Blood: G3t, G4t, G5t, and G6t comparable (Fig. 5B, bars 1–5). Liver: G3t, G4t, G5t, and G6t comparable, but >blood or brain (Fig. 5B, bars 1–5). Brain: G4t−LPS, G5t−LPS, and G6t−LPS comparable, but >>G3t (Fig. 5B, bars 1–5). Cmax—Blood: G3t, G4t, G5t, and G6t comparable, but >>brain (Fig. 5D, bars 1–5). Liver: G3t, G4t, G5t, and G6t comparable, but >>brain (Fig. 5D, bars 1–5). Brain: G4t−LPS, G5t−LPS, and G6t−LPS comparable, but >>G3t (Fig. 5B, bars 1–5).
This indicated a four to five time greater bioavailability and brain uptake of CU and PU when administered as a nano formulation than as a bulk formulation.
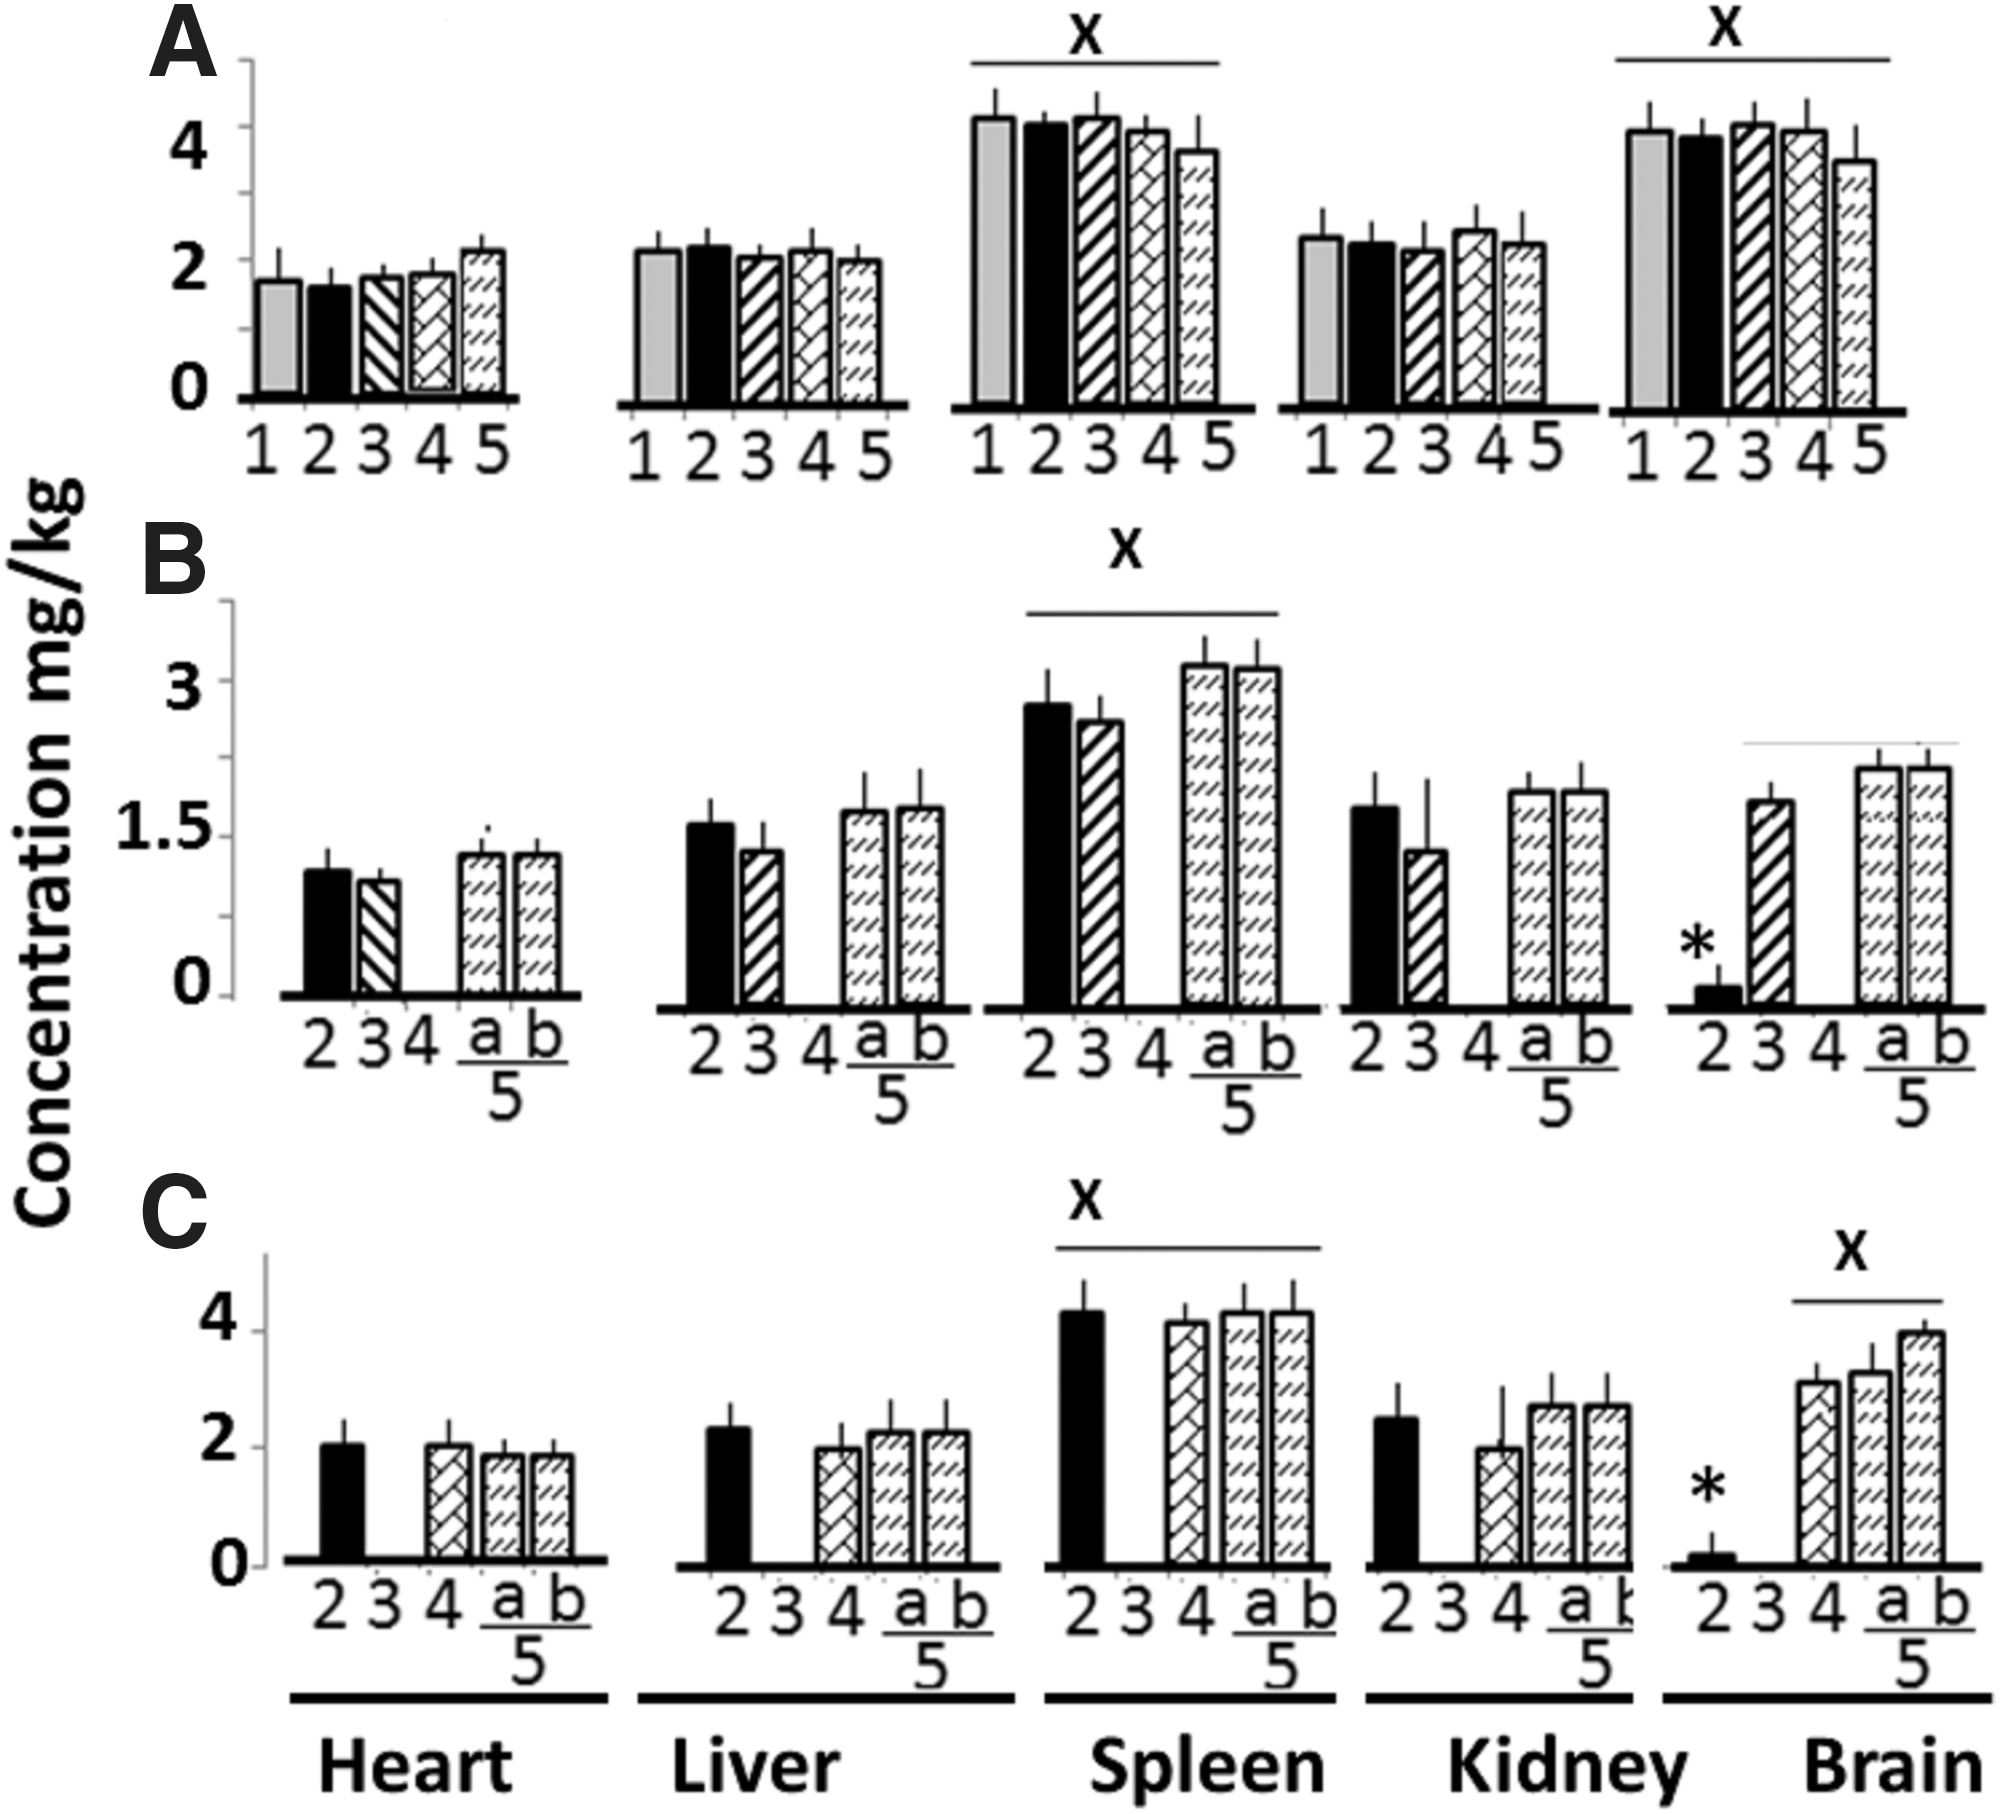
Bio-distribution
Au was widely distributed in different tissues and showed the following pattern: spleen >> liver and brain>heart and kidney (Fig. 6A). Au accumulation in each tissue sample from G3d−LPS, G4d−LPS, G5−LPS, and G6d−LPS groups did not differ significantly. The distribution of PU (in G4d−LPS rats) and CU (in G5d−LPS rats) in different tissues is shown in Figure 6B and C, respectively. PU and CU concentrations in heart, lungs, liver, spleen, and kidney samples from G4d−LPS (bar 3), G5−LPS (bar 4), and G6d−LPS (bar 5) rats did not differ significantly (CU or PU concentration/Au concentration ratio ranged from 0.5 to 0.9). However, PU and CU concentrations in the brain of G3d−LPS (CU or PU concentration/Au concentration ratio was <0.05) were significantly lower than corresponding values in other tissues (CU or PU concentration/Au concentration ratio ranged from 0.4 to 0.6). LPS injection did not significantly alter the distribution of Au, PU, and CU (data not shown). These observations further showed several-fold greater bioavailability of CU and PU when administered as a nano formulation than as a bulk formulation.
Au
Safety characterization of AuNPs
Lactate concentrations: Lactate concentrations in blood and brain samples from G2d−LPS to G6d−LPS rats receiving ≤40 mg/kg nanoparticles did not differ significantly from corresponding G1−LPS values. A significant increase in lactate concentrations occurred in the blood (Fig. 7A) and brain (Fig. 7B) samples from the rats receiving ≥60 mg/kg nanoparticles (plot 1 for G2d−LPS and plot 2 for G3d−LPS rats). Blood (Fig. 7C) and brain (Fig. 7D) lactate concentrations in all “+LPS” rats groups receiving 0–40 mg/kg AuNP differed significantly. Higher AuNP doses significantly increased lactate concentrations in G2d+LPS and G3d+LPS rats (plot 1 for G3d+LPS) and plot 4 for G3d+LPS, but not in G4t+LPS to G6t+LPS rats (plots 3–5). This suggests that PU-AuNP, CU-AuNP, and PU-CU-AuNP attenuated the adverse effects caused by high doses of AuNPs in rats, although PU-CU-AuNP was more potent than PU-AuNP or CU-AuNPs.
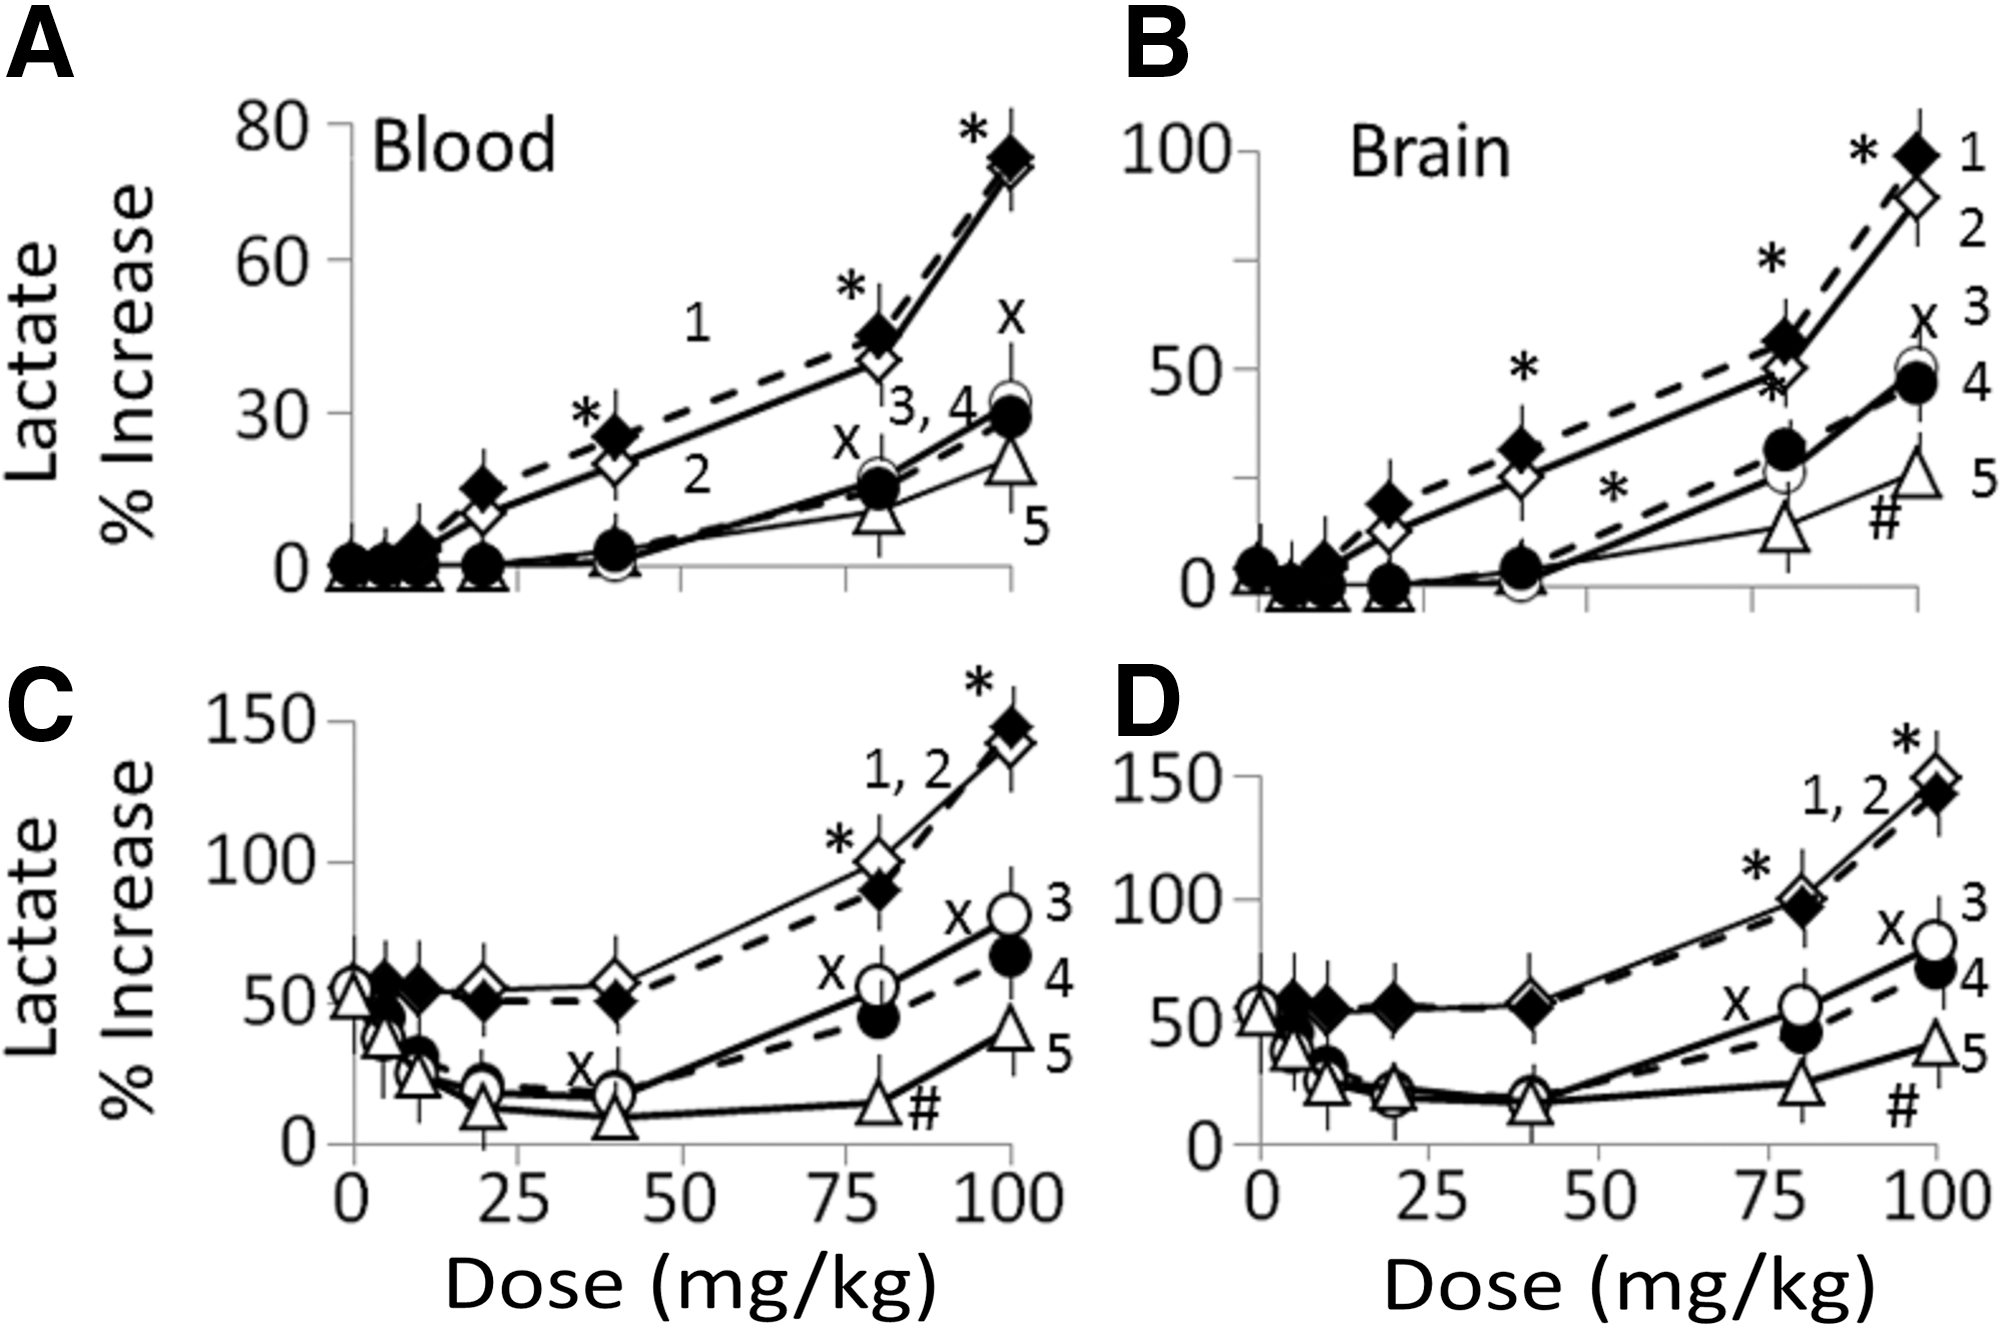
Blood and brain lactic acid concentrations in G2d to G6d rats that did not receive LPS
Kidney function test: Kidney function was not affected by AuNP doses <60 mg/kg (Table 2). At 80 and 100 mg/kg dose, blood creatinine, urine protein, and urine N excretion levels and blood creatinine/protein ratio increased significantly, while urine creatinine/protein ratio decreased significantly. This suggests that <40 mg/kg dose of functionalized AuNPs did not cause kidney damage.
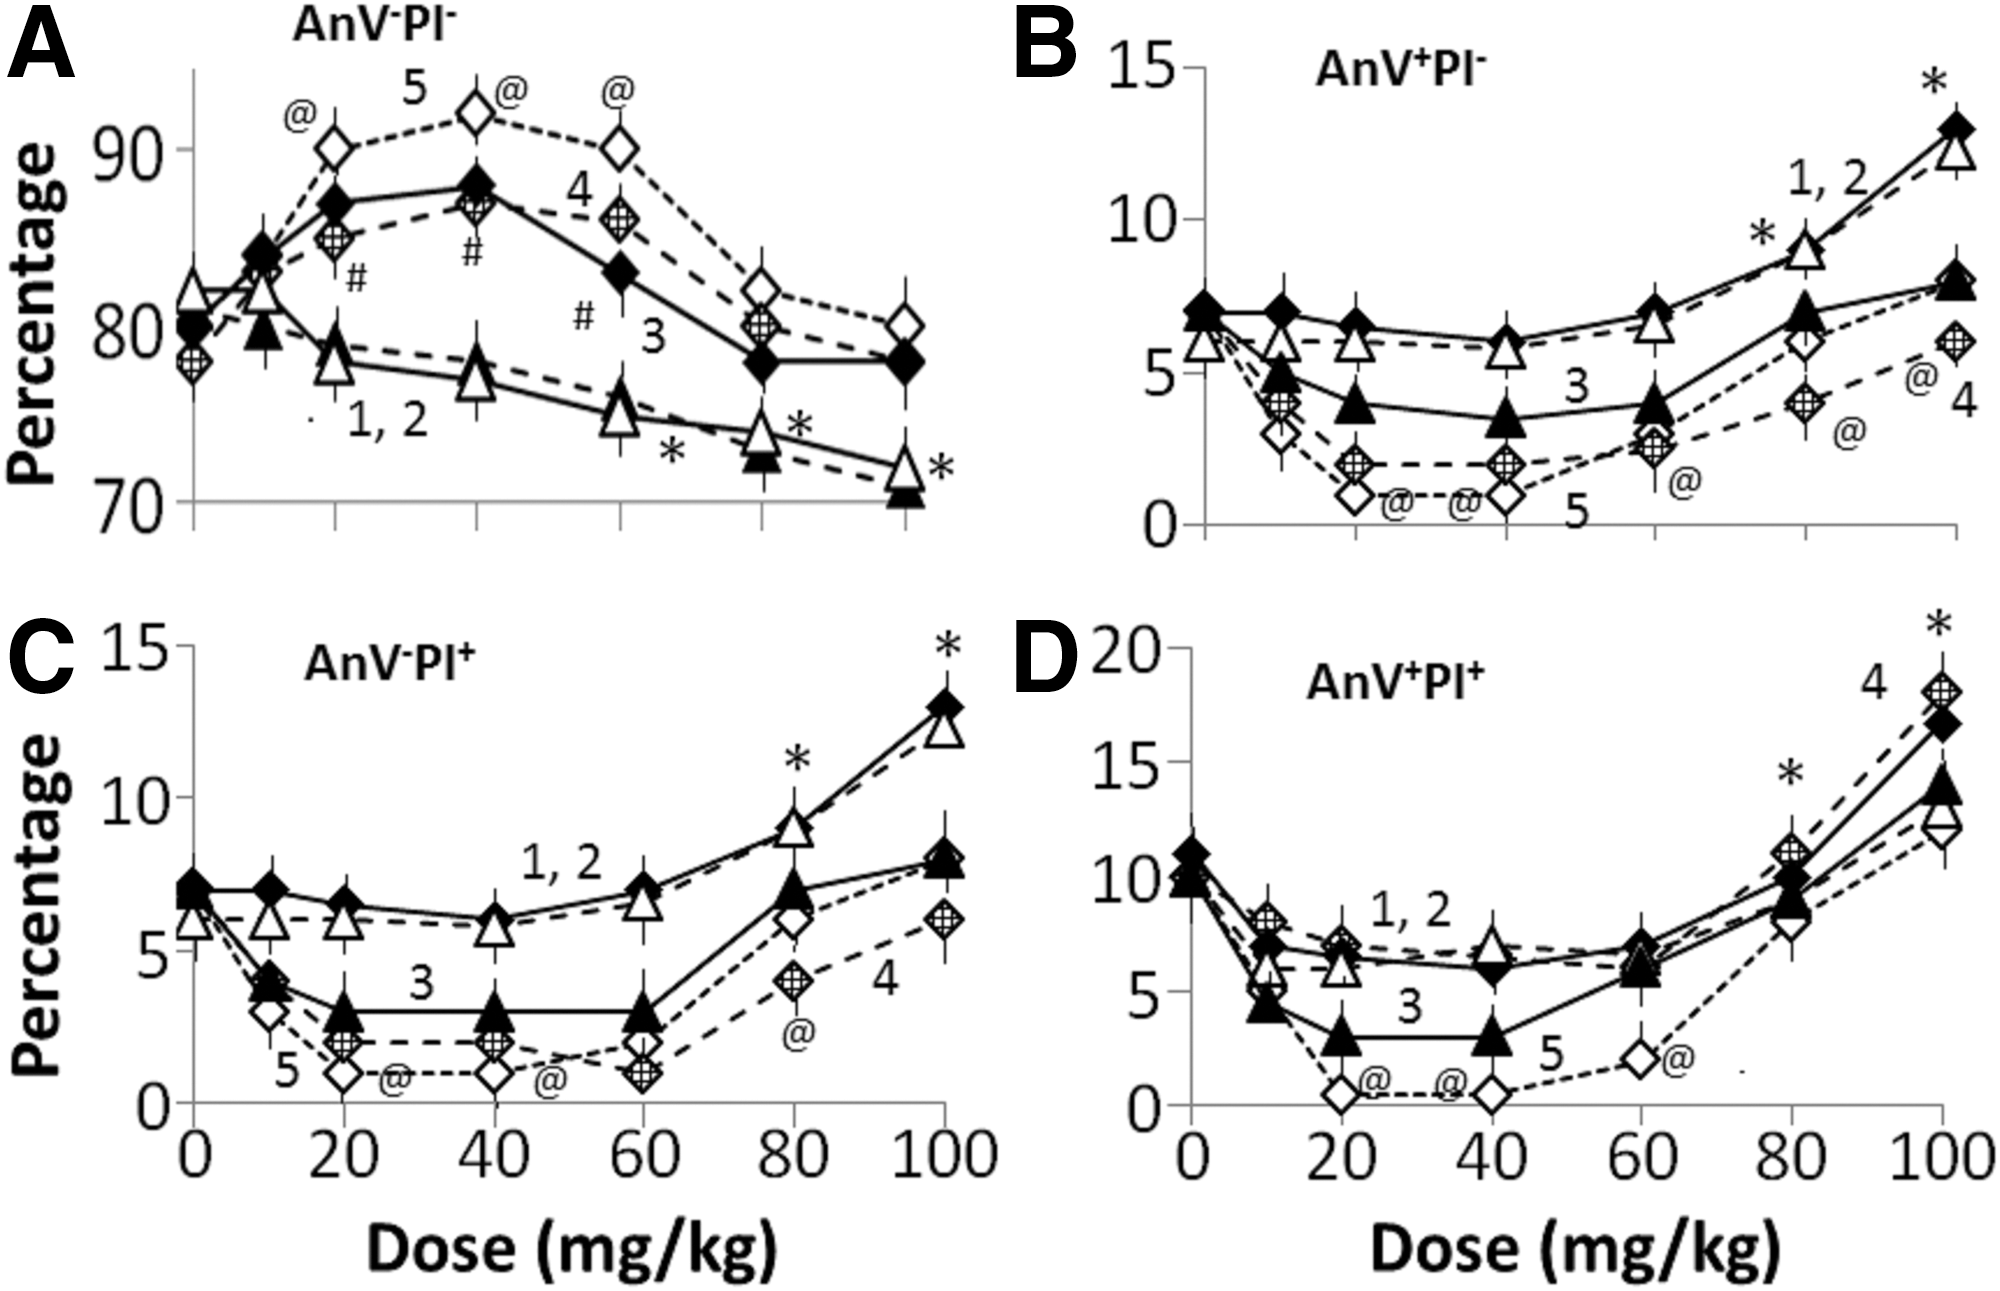
Neuronal density in the brain: Figure 8 shows the percentage change in density of neurons at different stages of apoptosis (AnV−PI− [Fig. 8A], AnV−PI+ [Fig. 8B], AnV+PI− [Fig. 8C], and AnV+PI+ [Fig. 8D]) in the brains of G2d−LPS (plot 1), G3d−LPS (plot 2), G4d−LPS (plot 3), G5d−LPS (plot 4, did not differ significantly from plot 3 values), and G6d−LPS (plot 5). At lower doses (≤40 mg/kg), the brains of all four rat groups contained mostly AnV−PI− neurons (Fig. 8A, plots 1–5), while at higher doses (≥60 mg/kg), the brain exhibited AnV−PI+ (Fig. 8B), AnV+PI− (Fig. 8C), and AnV+PI+ (Fig. 8D) neurons. At 100 mg/kg AuNP dose, apoptotic/necrotic cells accounted for 30% of total neurons. The time course of change is not shown, as (1) all rat groups contained mostly AnV−PI− neurons and (2) apoptotic neurons were not detected in the brain. Taken together, these observations suggest that AuNP doses ≤40 mg/kg do not cause the nanoparticle-induced toxicity in male rats weighing around 200g. Higher AuNP doses were toxic to these rats.

Effects of different doses of AuNPs on the distribution of AnV−PI−
Therapeutic potency of functionalized AuNPs
Dose-response studies: As shown in Figure 1C, LPS caused >20% decrease in AnV−PI− neurons and 5% to 12% increase in AnV+PI−, AnV−PI+, and AnV+PI+ neurons isolated from the brain of G1 rats at 96 h after LPS injection. Effects of AuNP doses on LPS-induced apoptosis of brain neurons are shown in Figure 9. In G2+LPS rats (Fig. 9A, plot 1) and G3d+LPS rats (Fig. 9A, plot 2) receiving ∼40 mg/kg AuNP, LPS administration caused <5% decrease in enumeration of the brain AnV−PI− neurons, but no significant change in enumeration of AnV−PI−, AnV−PI+, and AnV+PI+ neurons. AuNP dose ≥60 mg/kg caused a further dose-dependent decrease in AnV−PI− neuronal enumeration (70% of control at 100 mg/kg AuNP dose) and an increase in enumeration of AnV+PI− (Fig. 9B, plots 1 for G2d+LPS and 2 for G3d+LPS), AnV−PI+ (Fig. 9C, plots 1 and 2), and AnV+PI+ (Fig. 9D, plots 1 and 2) neurons (further 10%–20% increase at 100 mg/kg dose). In G4d+LPS to G6d+LPS rats, ≤40 mg/kg dose of PU-AuNP (plot 3), CU-AuNP (plot 4), or PU-CU-AuNP (plot 5) significantly increased AnV−PI− neuronal enumeration (Fig. 9A), but decreased enumeration of AnV+PI− (Fig. 9B), AnV−PI+ (Fig. 9C), and AnV+PI+ (Fig. 9D) neurons. A gradual decrease in AnV−PI− enumeration was observed in G4d+LPS to G5d+LPS rats at higher nanoparticle doses.
Dose-response relationships of the distribution of AnV−PI−
This suggests that the AuNP doses less than 40 mg/kg did not modulate neuronal apoptosis in the brain. At higher AuNP doses, however, a significant increase in enumeration of AnV+PI−, AnV−PI+, and AnV+PI+ neurons occurred (Fig. 9B–D). The effects of PU-AuNP and CU-PU-AuNP in rats can be divided into two parts: (1) at doses≤40 mg/kg when the nanoparticles provided protection against the LPS-induced toxicity and (2) at doses >60 mg/kg when nanoparticles augmented the LPS-induced toxicity. At doses ≤40 mg/kg, PU-CU-AuNP was more potent (plot 4) than PU-AuNP (plot 3), but, at higher doses, both nanoparticles were comparably toxic. A key observation of this study was that peak therapeutic effects of PU-AuNP, CU-AuNP, or PU-CU-AuNP occurred at 20 mg/kg dose; thus, this dose was selected for the time-course studies.
Time-Course Studies: Enumeration of AnV−PI− neurons in the brain of G1t+LPS and G2t+LPS rats exhibited almost 20% decrease in 24 h and about 30% decrease in 96 h post LPS injection. Enumeration of AnV−PI− neurons in the brain of G4t+LPS (Fig. 10A, plot 3), G5t+LPS (plot 4), and G6t+LPS (plot 5) rats either did not change or decreased slightly (<10% decrease). AnV−PI− neuronal density in G6t+LPS rats (plot 5) was significantly higher than that in G4t+LPS rats (plot 3) or G5t+LPS rats (plot 4). Enumerations of AnV+PI−, AnV−PI+, and AnV+PI+ neurons increased gradually in brain samples from all four “+LPS” subgroups showing the following pattern (Fig. 10): G1d+LPS, G2d+LPS (plot 1), G3d+LPS (plot 2) >> G4d+LPS (plot 3), G5d+LPS (plot 4)>G6d+LPS (plot 5). This suggests that although CU-AuNP, PU-CU-AuNPs, and PU/AuNPs protected against the cytotoxic effects of LPS, PU-CU-AuNP was more effective than the mono-functional AuNPs. Free CU and PU were not effective in protecting against the LPS toxicity. The time-course study corroborated the dose-response results that a 20-mg/kg dose of PU-CU-AuNP effectively protected against LPS toxicity without causing unwanted adverse effects.

The time course of change in AnV−PI−
The time course of changes in IL-1β, IL-10, and MMP-9 concentrations (Fig. 11):

Time course of change in concentrations of IL-1β, IL-10 and matrix-metalloprotein (MMP)-9 in the serum
Serum: IL-1β and MMP-9 concentrations increased gradually and peaked at 10 h after LPS injection (Fig. 11A). The peak concentrations showed the following pattern: IL-1β: G2t+LPS > G3t+LPS > G4t+LPS, G5t+LPS>> G6t+LPS. MMP-9: G2t+LPS, G3t+LPS > G4t+LPS, G5t+LPS>> G6t+LPS
Concentrations of IL-10 remained unchanged for ∼10 h and then increased gradually with peak values occurring at 24 h after LPS injection. The peak IL-10 values showed the following pattern: G6t+LPS>G5+LPS, G5t+LPS>G2t+LPS, G3t+LPS, and G1t+LPS. At 96 h after LPS injection, IL-10 values in all groups listed earlier remained elevated at about 120% of control.
Brain: The time course of change in concentrations of IL-1β and MMP-9 in serum and the brain samples were comparable (Fig. 11). However, the time course of change in IL-10 concentrations in serum and the brain exhibited differences. At 96 h after LPS injection, IL-10 values in G2t+LPS and G3t+LPS rats had returned to the basal level, but the values in G4t+LPS to G6t+LPS remained elevated (140% of control). These observations further confirm that a 20-mg/kg dose of functionalized AuNPs may effectively suppress the LPS-induced inflammation and cytotoxicity in rats.
Discussion
Bioavailability and bio-distribution
PU and CU, although they possess important medicinal properties, have not succeeded in clinical trials because of their poor bioavailability and inability to cross the blood–brain barrier. 16,39,40 The unique hydrophobic-hydrophilic character of cell membranes may prevent the uptake of highly lipophilic compounds such as CU and highly hydrophilic compounds such as PU and contribute to their low bioavailability. 32,41 Consistent with the earlier observations, 16,17 the present study also showed that bulk CU and PU were rapidly eliminated from blood and poorly crossed the blood–brain barrier. However, the nanoformulations of PU (PU-AuNP, group G4), CU (CU-AuNP, group G5), or a combination of CU and PU (PU-CU-AuNP, group G6) significantly enhanced the brain CU and PU concentrations that were comparable to the corresponding Au concentrations. Approximately 30%–50% of AuNP, CU, and PU were transferred from the blood into the brain in the G4d−LPS (received PU-AuNP, but not LPS), G5d−LPS (received CU-AuNP, but not LPS), and G6d−LPS (Received PU-CU-AuNP, but not LPS) rats. The time-course studies showed that, in the G3t−LPS rats which received bulk CU and PU, the AUC for PU and/or CU plots in the blood (peaked at 1 h after injection) or the liver (peaked at 12 h) samples were several-fold higher than the AUC for the brain samples (peaked at 48 h). However, in G4t−LPS to G6t−LPS rats, the AUC for liver and brain PU and/or CU plots were comparable and were significantly higher than the AUC for blood samples. This may be because the t 1/2 values for PU or CU in blood samples from G3t−LPS rats were significantly lower than the t 1/2 values for G4t−LPS to G6t−LPS rats. Taken together, these observations showed that nanoformulation significantly improved the bioavailability of CU and PU. Similar to the present study, earlier studies have also shown that the drugs coupled to AuNP via an acid-liable linker accumulated in lysosomes and that the highly acidic environment of lysosomes hydrolyzed the acid-liable link and released CU into the cytoplasm. 43,44 As a result, the AuNP-bound CU and PU are released directly into the cytoplasm (Fig. 12), which may improve their residence time and therapeutic potency.
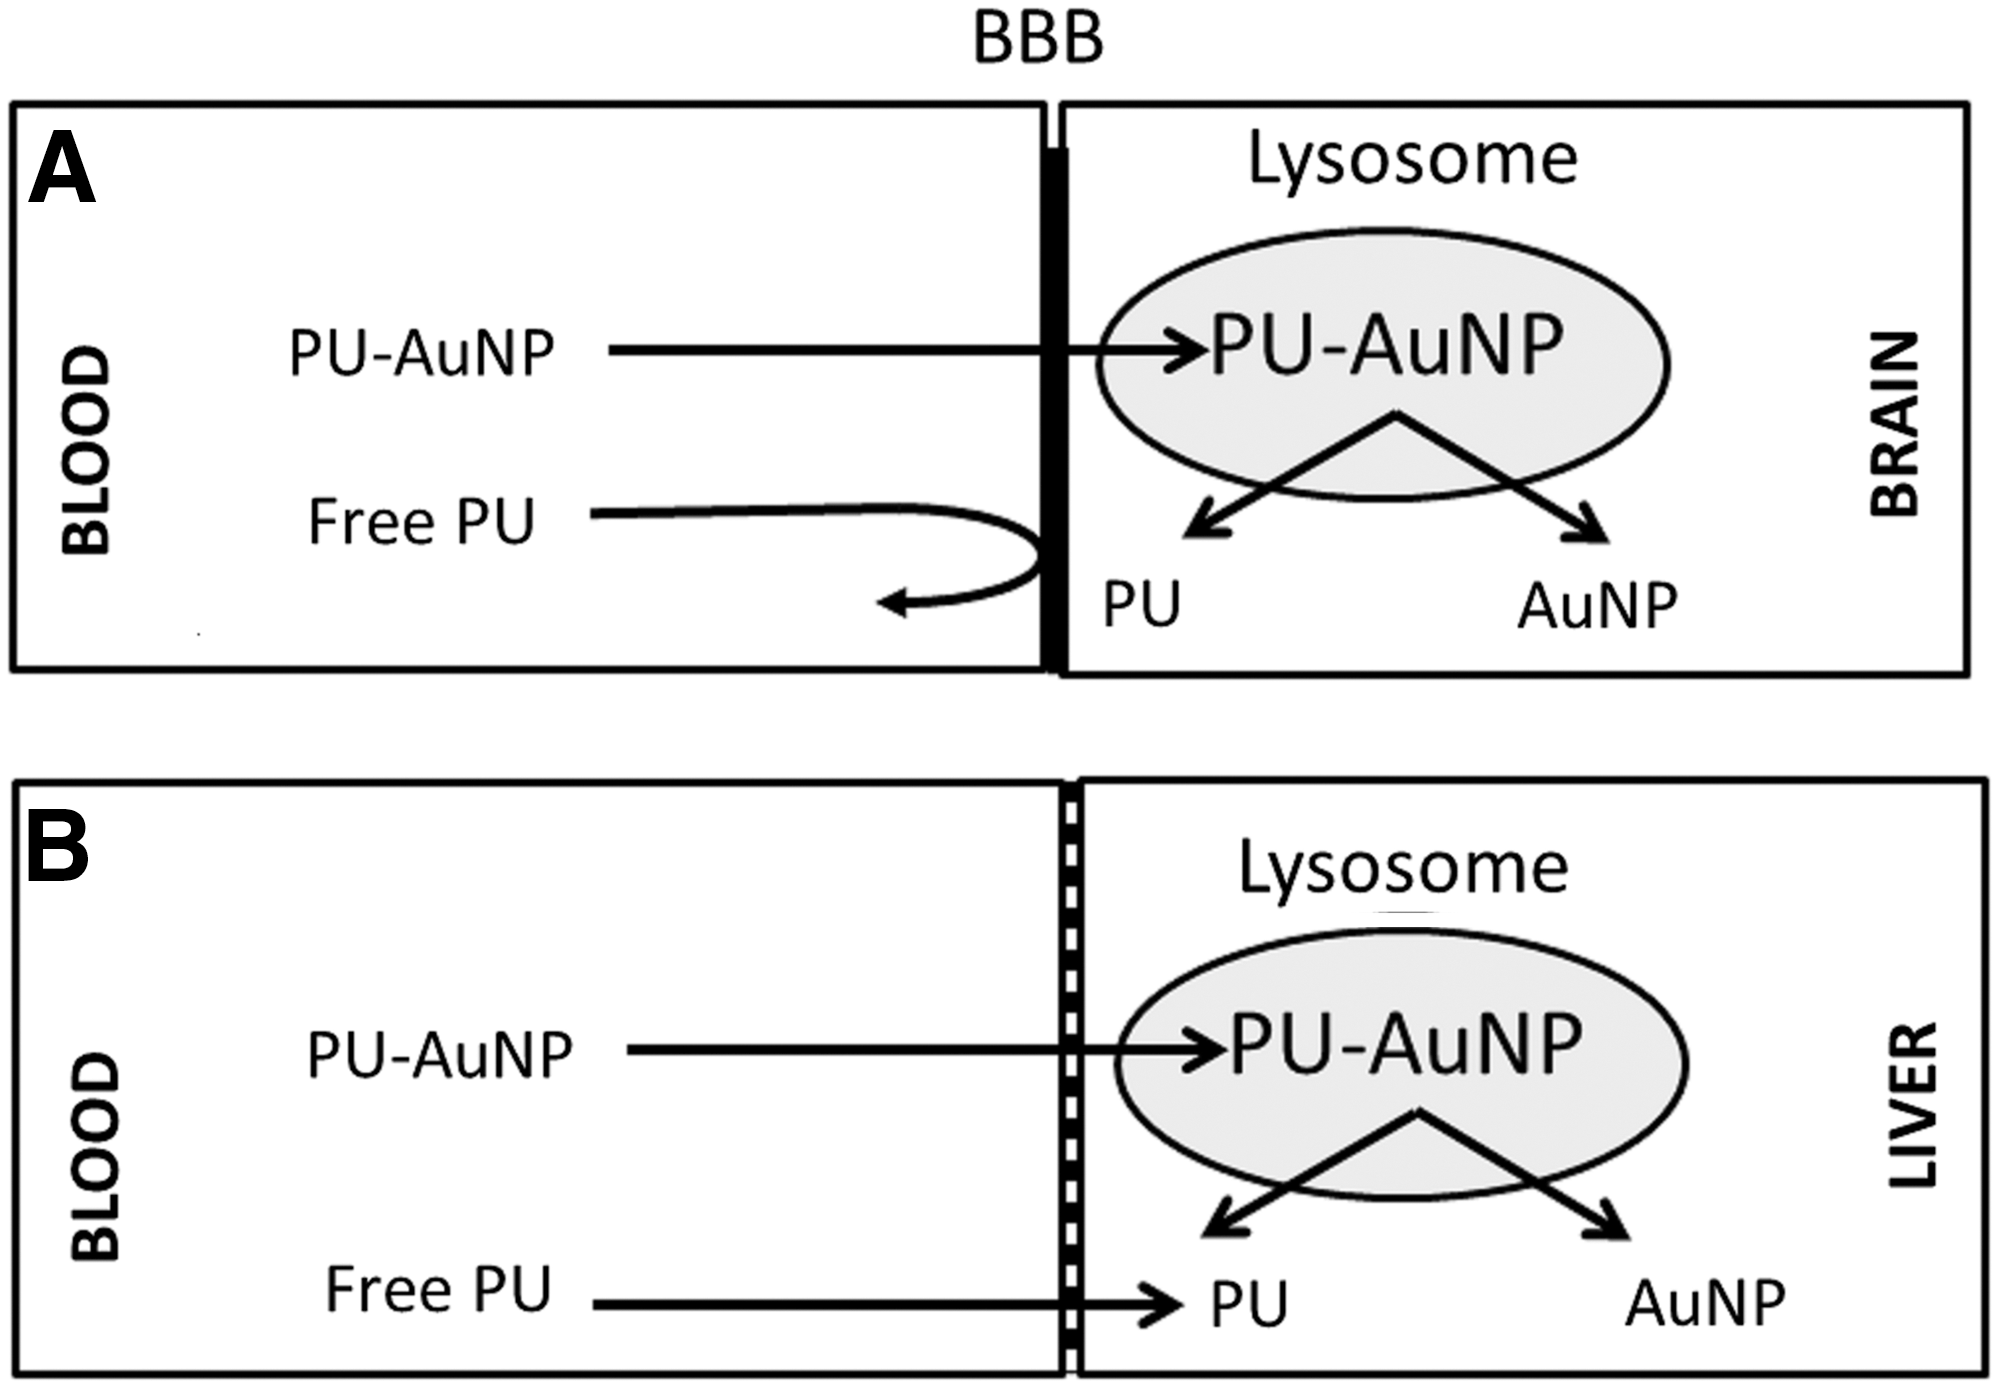
Proposed mechanisms underlying the transport of blood to the brain and blood to the liver.
The present study also showed that, in G3t−LPS rats, the time course of changes in Au concentrations in the blood, liver, or brain samples was significantly different than the changes in corresponding PU or CU concentrations in tissue samples. However, in G4t−LPS to G6t−LPS rats, the time course of changes in blood, liver, or brain Au and PU or CU concentrations was comparable. The t 1/2 values for blood PU or CU concentrations were significantly lower than the t 1/2 values for blood Au concentrations in G3t rats. In G4t to G6t rats, however, the t 1/2 values were comparable. Although the possible cause for the discrepancy described earlier between the AuNP and the herb concentrations in G3t−LPS rats is not known, we propose that AuNPs, but not CU or PU, may accumulate and remain sequestered into the RBC, while CU or PU are handled by the excretory pathways of the kidney and liver. The drug efflux transporters present in the liver and the blood–brain barrier may allow rapid exit of CU and PU from the liver and brain. 45,46 In addition, we also observed differences in the distribution of AuNPs, CU, and PU in different tissue samples from G3 to G6 rats. CU and/or PU concentrations in the blood and liver samples from G3t to G6t rats were comparable, while the brain CU and PU concentrations in G4t and G5t rats were significantly higher than those in G3t rats. These observations concur with the earlier observation that the nanoformulated PU and CU exhibited greater bioavailability and transport across the blood–brain barrier than their free counterparts administered intravenously in rats. 47,48 Although possible mechanisms behind the improved uptake of AuNPs into the brain are not fully understood, we attribute this to the unique physicochemical property of AuNPs as shown in Supplementary Figure 3. The PEG-coupled CU and PU have unique hydrophilic-hydrophobic properties (a negatively charged herb molecule, a positively charged acid-labile group, and a distinct hydrophobic region) that facilitate their incorporation into the brain cells. These observations suggest that bi-functionalized PU-CU-AuNP increased bioavailability of CU and PU may be associated with their greater therapeutic potencies.
AuNP safety
As discussed earlier, the unique electronic properties of AuNPs that makes them excellent drug carriers have also been attributed in the development of their toxicity. Nanoparticles, depending on their size, shape, and functionalization, have been shown to cause cytotoxicity, inflammation, genotoxicity, stress, and so on. 49 –52 However, a review of literature yielded conflicting information regarding the toxic effects of NPs: No effect, high toxicity, and low/moderated toxicity have been reported. 53 –57 This may be because different studies have used different size (<10 to 100 nm), dose (<1 μg to >100 mg/kg), and exposure regimes (single to multiple exposures) of AuNPs in vivo in rats and mouse and in vitro in cell cultures. The present study showed that concentrations of lactate, IL-1β, and IL-10 in blood and the brain samples, kidney function, and neuronal density in G1−LPS rats (Fig. 1) did not differ significantly from corresponding values in G2−LPS to G6−LPS rats receiving ≤40 mg/kg dose of AuNP. The AuNP doses ≥60 mg/kg significantly increased blood or brain lactate concentrations, caused kidney abnormalities, and induced neuronal apoptosis/necrosis that was characterized by a dose-dependent decrease in AnV−PI− neurons, but an increase in early apoptotic (AnV+PI−), late apoptotic (AnV+PI+), and necrotic (AnV−PI+) neurons. These observations suggest that an intravenous injection of ≤40 mg/kg dose of 7–10 nm AuNPs may not cause any of the adverse effects listed earlier. The LPS injection augmented the AuNP toxicity in G2 and G3 rats, while PU-AuNP and PU-CU-AuNP, even at higher doses, attenuated LPS toxicity. These observations showed that AuNP doses <40 mg/kg may not cause toxicity; thus, it can be safely used in rats. However, these results may not be broadly applicable, because, as discussed earlier, nanoparticles' medicinal activity and toxicity, in addition to the dose, may also depend on their size, functionalization, and reactivity to intracellular components. 25 –29 It may be necessary to characterize the adverse effects of different nanoparticle preparations for their intended application.
Protection against LPS-induced toxicity
Inflammation
It is well known that systemic LPS injection induced inflammation by increasing pro-inflammatory cytokines [IL-1β, tumor necrosis factor alpha (TNFα), and MMP-9] in serum and brain samples. 58 –60 Pro-inflammatory cytokines evolve inflammation either directly or indirectly by activating nuclear factor kappa B (NFκB) signaling. 60 The increase in pro-inflammatory cytokines is followed by an increase in the anti-inflammatory cytokines such as IL-10 that resolves inflammation by reversing the LPS-induced increase in pro-inflammatory cytokines. 61 –64 The present study showed that (1) the maximum protective effects of PU-CU-AuNP, PU-AuNP, and CU-AuNP against the LPS-induced toxicity occurred at 20 mg/kg nanoparticle dose, and (2) PU-CU-AuNP was more potent than PU-AuNP or CU-AuNP in inducing IL-10 and resolving inflammation. In rats belonging to the G1t+LPS, G2t+LPS, and G3t+LPS groups, the LPS injection increased IL-1β and MMP-9 concentrations that peaked to ∼300% of control at 10 h after the LPS injection, followed by a gradual decline in the values. The decline in pro-inflammatory cytokines correlated with an increase in IL-10 concentrations that peaked to about 200% of control at 24 h after the LPS injection. Thus, LPS was more effective in increasing the pro-inflammatory cytokines than the anti-inflammatory cytokines, resulting in inflammation dysregulation. In G4t, G5t, and G6t rats, LPS's pro-inflammatory effects were significantly attenuated (G4t, G5t<G6t), while its anti-inflammatory effects were augmented (G6t << G4t, G5t), resulting in suppression of the LPS-induced inflammation in rats.
Apoptosis
Consistent with earlier studies, 30 this study also showed that the LPS injection, in addition to inducing inflammation, also decreased the density of neurons in the brain possibly by inducing apoptosis and necrosis. In G2t and G3t rats, the LPS injection caused (1) about 5% to 15% decrease in AnV−PI− neurons and (2) a comparable increase in AnV−PI+ (necrotic), AnV+PI− (early apoptotic), and AnV+PI+ (late apoptotic) neurons. A positive correlation was observed between neuronal apoptosis and an increase in pro-inflammatory cytokines. Immediately after the LPS injection, induction of the inflammatory activity correlated with an increase in neuronal apoptosis, with both indices showing the following pattern: G2t, G3t>G4t, G5t>G6t. This suggests that rats receiving PU-CU-AuNP exhibited lowest enumeration of apoptotic neurons. Similar to the present study, earlier studies have also demonstrated induction of neuronal apoptosis in response to pro-inflammatory cytokines and/or MMP-9, either directly or via activating TNFα/NFκB. 64,65 An up-regulation of IL-10 in the brain correlated with a decrease in neuronal apoptosis. The time course of change in apoptotic activity also correlated with the time course of change in the brain, but not serum IL-10 concentrations. Based on these observations, we propose that PU-CU-AuNP effectively augmented the IL-10 concentrations, resulting in attenuation of the LPS-induced neuronal apoptosis.
In conclusion, PU-CU-AuNP was more potent than PU-AuNPs or CU-AuNP, while PU-CU-AuNP, PU-AuNP, and CU-AuNP were more potent (∼5-fold) than nonformulated CU and PU in suppressing the LPS-induced inflammation and apoptosis in the brain. The PU-CU-AuNP dose of 20 mg/kg provided maximum protection without adversely affecting the animals' health. AuNP-formulated CU and PU, therefore, may circumvent the bioavailability problem associated with the nonformulated herbs (Fig. 12) and, in turn, increase its acceptance as an alternative treatment of diseases such as cancer, stroke, and inflammation disorders. A caveat associated with the use of nanoparticles is that the efficacy and adverse effects of AuNPs are determined by their (1) size, shape, and functionalization; (2) interactions with intracellular components; and (3) intracellular aggregation/agglomeration. Since nanoparticles interact activity with biomolecules that alter their properties, 66 the possibility exists that the properties of nanoparticles and ensuing toxicity in vivo may be different than their properties in vitro. Therefore, the results reported in this study may not be applicable to (1) AuNPs of different size, properties, and functionalization and (2) different species. This study, however, may provide a protocol to study the beneficial and adverse effects of nanoparticles.
Footnotes
Author Disclosure Statement
No competing financial interests exist.
References
Supplementary Material
Please find the following supplemental material available below.
For Open Access articles published under a Creative Commons License, all supplemental material carries the same license as the article it is associated with.
For non-Open Access articles published, all supplemental material carries a non-exclusive license, and permission requests for re-use of supplemental material or any part of supplemental material shall be sent directly to the copyright owner as specified in the copyright notice associated with the article.