
Abstract
Green tea has been shown to have thermogenic and antiobesity properties. Therefore, it is important to investigate its effect on weight loss in humans, especially in women. We investigated the effects of green tea consumption combined with resistance training on the body composition and the resting metabolic rate (RMR) in women who were overweight or obese (grade I). After 4 weeks on an adaptive diet, 36 women were divided into four groups (group 1 green tea; group 2 placebo; group 3 green tea plus resistance training; group 4 placebo plus resistance training). The study was double-blinded and placebo-controlled. The RMR and body composition were ascertained for each volunteer, blood tests were performed, and subjects in groups 3 and 4 were tested for their one repetition maximum. Each subject followed the protocol and continued the diet for eight additional weeks, and periodic evaluations were administered. The mean RMR of group 1 decreased significantly and was accompanied by weight loss, maintenance of lean body mass, and decreases in both waist circumference and body mass index. Group 2 showed no variations in anthropometric or blood variables and significantly decreased their mean RMR. Group 3 showed significant increases in RMR, lean body mass, and muscle strength, and significant decreases in body fat, triglycerides, and waist circumference as compared to group 4. Green tea combined with resistance training its potential is increased with decreasing body fat, waist circumference, and triacylglyceride levels and by increasing lean body mass and muscle strength.
Introduction
O
Green tea affects the sympathetic nervous system (SNS). The catechins found in tea can inhibit the enzyme catechol O-methyltransferase, which contributes to the degradation of the neurotransmitter norepinephrine. When this neurotransmitter is not degraded, fat oxidation and thermogenesis increase. 1 The catechins in green tea may also cause apoptosis in 3T3-L1 preadipocytes. 14 –17
Exercise and a healthy diet that includes functional foods is important to maintain a good quality of life because both exercise and a healthy diet help to increase metabolism. 18 Some studies have shown that the thermogenic effects of green tea are enhanced if combined with exercise; this association further increases energy expenditure, which increases metabolism and promotes weight loss. 18,19
Due to the previously mentioned studies and as a result of increasing obesity rates, it is important to study the effects of green tea in overweight or obese (grade I) women and to evaluate the effects of green tea when coupled with resistance training. This study aimed to compare the resting metabolic rate (RMR) and body composition of the specified group before and after green tea consumption.
Subjects, Materials, and Methods
Subjects
This study included 36 women who were recruited through brochures, newspaper announcements, and local television advertisements. All of the women in this study were informed about the research objectives and signed an informed consent document for voluntary participation in the study.
The selected women were sedentary, aged 20 to 40 years, and overweight or obese (body mass index [BMI] 25–35 kg/m2). The study excluded women with thyroid problems, smokers, alcoholics, pregnant women, nursing mothers, athletes, and those taking diet or weight loss drugs or phytochemicals. To exclude women with these conditions, we performed a health assessment that included a clinical history. The project was approved by the Ethics Committee on Human Research of the Luiz de Queiroz College of Agriculture (ESALQ) of the University of São Paulo (USP; Piracicaba, SP, Brazil), and it was assigned protocol number 48.
Experimental design
For a period of 4 weeks, the volunteers ate 1200 kcal/day based on individual dietary habits; there was no other source of polyphenols in the diet except the green tea. This period was necessary for the metabolic adaptation of the volunteers, since it is during this time that weight loss occurs followed by its stabilization. Therefore, the weight loss that would occur after this period would be due to green tea consumption. This was necessary to ensure that the metabolic diversity of the subjects did not interfere with the results. After this period, the subjects were divided into four groups: 1 (green tea), 2 (placebo), 3 (green tea plus resistance training), and 4 (placebo plus resistance training).
The following assessments were performed before beginning the protocol: biochemical analyses (glucose, total cholesterol, low-density lipoprotein [LDL], very low–density lipoprotein [VLDL], high-density lipoprotein [HDL], triacylglycerides, creatinine, insulin, and C-reactive protein [CRP]), assessment of body composition (weight, height, BMI, waist circumference, and bioelectrical impedance [lean body mass, body fat mass, and body fat percentage]), RMR, and for groups 3 and 4, a one repetition maximum (1RM). The protocols were followed for 8 weeks, and the base diet was continued. All these variables were measured again at the end of this period.
The subjects maintained a food diary throughout the study. All assessments were conducted by a physical education teacher and a doctor who specializes in sports medicine and nutrition.
Food studied
During the 8-week period, all volunteers consumed 20 g of either green tea or placebo per day (10 g at 10:00 a.m. and 10 g at 4:00 p.m., diluted in 200 mL of ice water). The times were standardized to avoid possible interference with the results.
Both the green tea and the placebo were weighed, sealed, and packaged at the pilot plant of the Department of Agroindustry, Food, and Nutrition, ESALQ. The volunteers were given the correct dosage (10 g) by the researchers. The packages were delivered every 10 days for better monitoring and control, and each volunteer received six packages of the product by the end of the 8-week period. Each package was labeled with a code specified by an officer of the Group of Functional Foods (GEAF), ESALQ, and the contents were revealed to the researchers only after the end of data collection to ensure a double-blind study.
It was offered to four groups of volunteers either green tea or placebo. The volunteers who received green tea had no access to the placebo and the volunteers who received placebo had no access to green tea. They did not know about the placebo, they were informed about the existence of placebo only after the research.
The green tea and the placebo were donated by Sanavita Industry (Piracicaba). The product was a powder, soluble in water-based maltodextrin, of powdered green tea, orange pulp, vitamin C, zinc, selenium, lemon flavor, chlorophyll dye, and sucralose. The nutrition information was as follows: energy value (30 kcal=126 kJ); carbohydrates (7.5 g); sodium (15 mg); zinc (2.1 mg); vitamin C (13.5 mg); selenium (10.2 mg); and total polyphenols (160 mg). The placebo had the same nutritional composition and the same ingredients, with the exception of the powdered green tea; therefore, it did not contain polyphenols. So the green tea and the placebo had similar color, odor, texture, and taste. The placebo had organoleptic properties indistinguishable from the green tea itself. The green tea enriched with vitamin C, selenium, and zinc used in the study is already marketed. To avoid any interference in the results, the placebo also experienced the same type of enrichment, but without the powdered green tea.
A 10-g portion of green tea had 20 mg of caffeine, and was being ingested at a rate of 40 mg of caffeine per day (20 g of green tea). Theobromide was detected in levels relatively low, just traces of it when compared with the caffeine. Found in those rates, neither caffeine nor theobromide presented any effect on the appraised parameters, just the catechins presented some effect in this case. 1 The placebo showed no caffeine or theobromide in its composition.
Determination of body composition and RMR
The measurement of body mass was performed using a scale (Welmy 110 CH; Welmy Ltd.), and height was measured with a stadiometer (Alturexata; Alturexata Ltd.). BMI was obtained by dividing the weight (kg) by the height squared (kg/m2). Waist circumference was obtained using a measuring tape.
Before the measurements were taken, the volunteers fasted from both food and water for 12 h; went to the bathroom before testing; did not exercise or use diuretics for 24 h; did not perform the tests during a menstrual period; did not wear metallic accessories; and wore only light clothing. All these precautions were taken to avoid interference with the results.
Evaluations were performed at the Laboratories of Anthropometric Assessment and Physical Effort of the Methodist University of Piracicaba (UNIMEP; Piracicaba).
Bioelectrical impedance
Bioelectrical impedance values were obtained for the determination of body composition. Volunteers remained supine on a stretcher; electrodes were placed on the middle finger and on the articulation of the dorsal side of the right hand and right foot, and then they were connected to the device (BF 900; Maltron International Ltd.), which passed an electrical current through the body to determine resistance. Body composition was determined by the equation of Gray et al. 20 : Body fat mass=0.00151×stature 2 −0.0344×resistance+0.14×body mass−0.158×age+20.387. Total fat was calculated by multiplying the mass by the body fat percentage. Lean mass was calculated by subtracting the body fat mass from the total body mass.
Resting metabolic rate
Indirect calorimetry was used to ascertain the RMR in a suitable environment (low light, no noise, and a temperature of 24°C). The women were laid supine on a gurney for 30 min before the measurements were taken. After this period, the subjects breathed through a pneumotachograph connected to a gas analyzer (Aerosport VO2000; Medical Graphics Corporation) for the measurement of oxygen consumption (VO2) and carbon dioxide production (VCO2) in L/min every 20 sec for 35 min. The first 5 min were discarded for the calculation of RMR in 24 h kcal/min. The measurements over the subsequent 30 min were multiplied by 1440 and input into the equation of Weir: 21 Total kcal = 3.9×VO2+1.1×VCO2. The RMR was expressed in both absolute values (kcal/day) and relative to body mass (kcal/[kg·h].
One repetition maximum test
The subjects of groups 3 and 4 were tested to determine their 1RM before and after the study period to determine a training load of 70%. 22 The apparatus used for this determination were: bench press, back pull down, and leg press (45°). When each exercise was performed correctly, the weight was increased. When the exercise was not performed correctly or completely, another attempt was made at a weight previously executed correctly to determine the 1RM. Subjects were allowed to make up to five attempts, with up to 3 min of rest between the repetitions.
Resistance training program
The subjects of groups 3 and 4 were subjected to a resistance training program in which we employed the following exercises: bench press, back pull down, leg press (45°), side lateral raises, triceps pushdown, bicep curls with the bar, leg curls, gluteus kickback, bent-knee calf raises, and sit-ups. Three sets of 10 repetitions of each exercise were performed, with 60 sec of rest between the reps and the sets, three times a week in the afternoon. The volunteers were instructed to ingest the product (green tea or placebo) 10 min before each training session. The loads used for each exercise were established in the first three sessions individually. 23 For the bench press, back pull down, and leg press (45°), 70% of the 1RM was used. 24 The resistance was increased voluntarily over time.
Blood variables
Biochemical analyses were performed before and after the study in a specialized laboratory. The biochemical tests included measurements of the following: glucose, insulin, total cholesterol, LDL, VLDL, HDL, TAG, creatinine, and CRP. The volunteers fasted from both food and water for 12 h and abstained from alcohol for 24 h.
Statistical analysis
The results are expressed as means with standard deviations, and they were analyzed using an analysis of variance for class level information. To compare the variables, we used the Tukey test with a significance level of P<.05, using Statistical Analysis System software (SAS) version 9.0.
Results
Anthropometric measurements
Table 1 shows the body composition of the subjects. In group 1, there was a decrease in body mass, BMI, waist circumference, and body fat mass and percentage, while the lean mass increased slightly. Group 2 did not improve in any anthropometric parameters. Group 3 showed no change in body weight or BMI. However, there was a significant decrease in waist circumference and body fat mass and percentage, and a significant increase in lean body mass in group 3. This group improved more in these parameters (except for body mass and BMI) than the other groups (P<.05). Group 4 also showed no changes in body weight or BMI; they improved in the other variables, but not significantly. Figure 1 indicates the percentage change for the main variables of the body composition (lean body, body fat, and fat percentage).

Changes of body composition (%) between baseline and week 8. abcBars for the same variable marked with different lowercase letters are significantly different (P<.05).
Data are means±standard deviation. Group 1: green tea; group 2: placebo; group 3: green tea + resistance training; group 4: placebo + resistance training.
Within a row, means marked with different lowercase letters are significantly different (P<.05).
Within a column, means for the same variable marked with different uppercase letters are significantly different (P<.05).
Energy expenditure
The RMR measurements are shown in Figure 2. The RMR decreased significantly in groups 1 and 2, but increased significantly in groups 3 and 4 (P<.05) (Fig. 2A). In group 1, the RMR for body mass showed no change, while in group 2, there was a measurable, but not significant decline. In groups 3 and 4, the RMR for body mass increased significantly, and it was highest in group 3 (Fig. 2B).
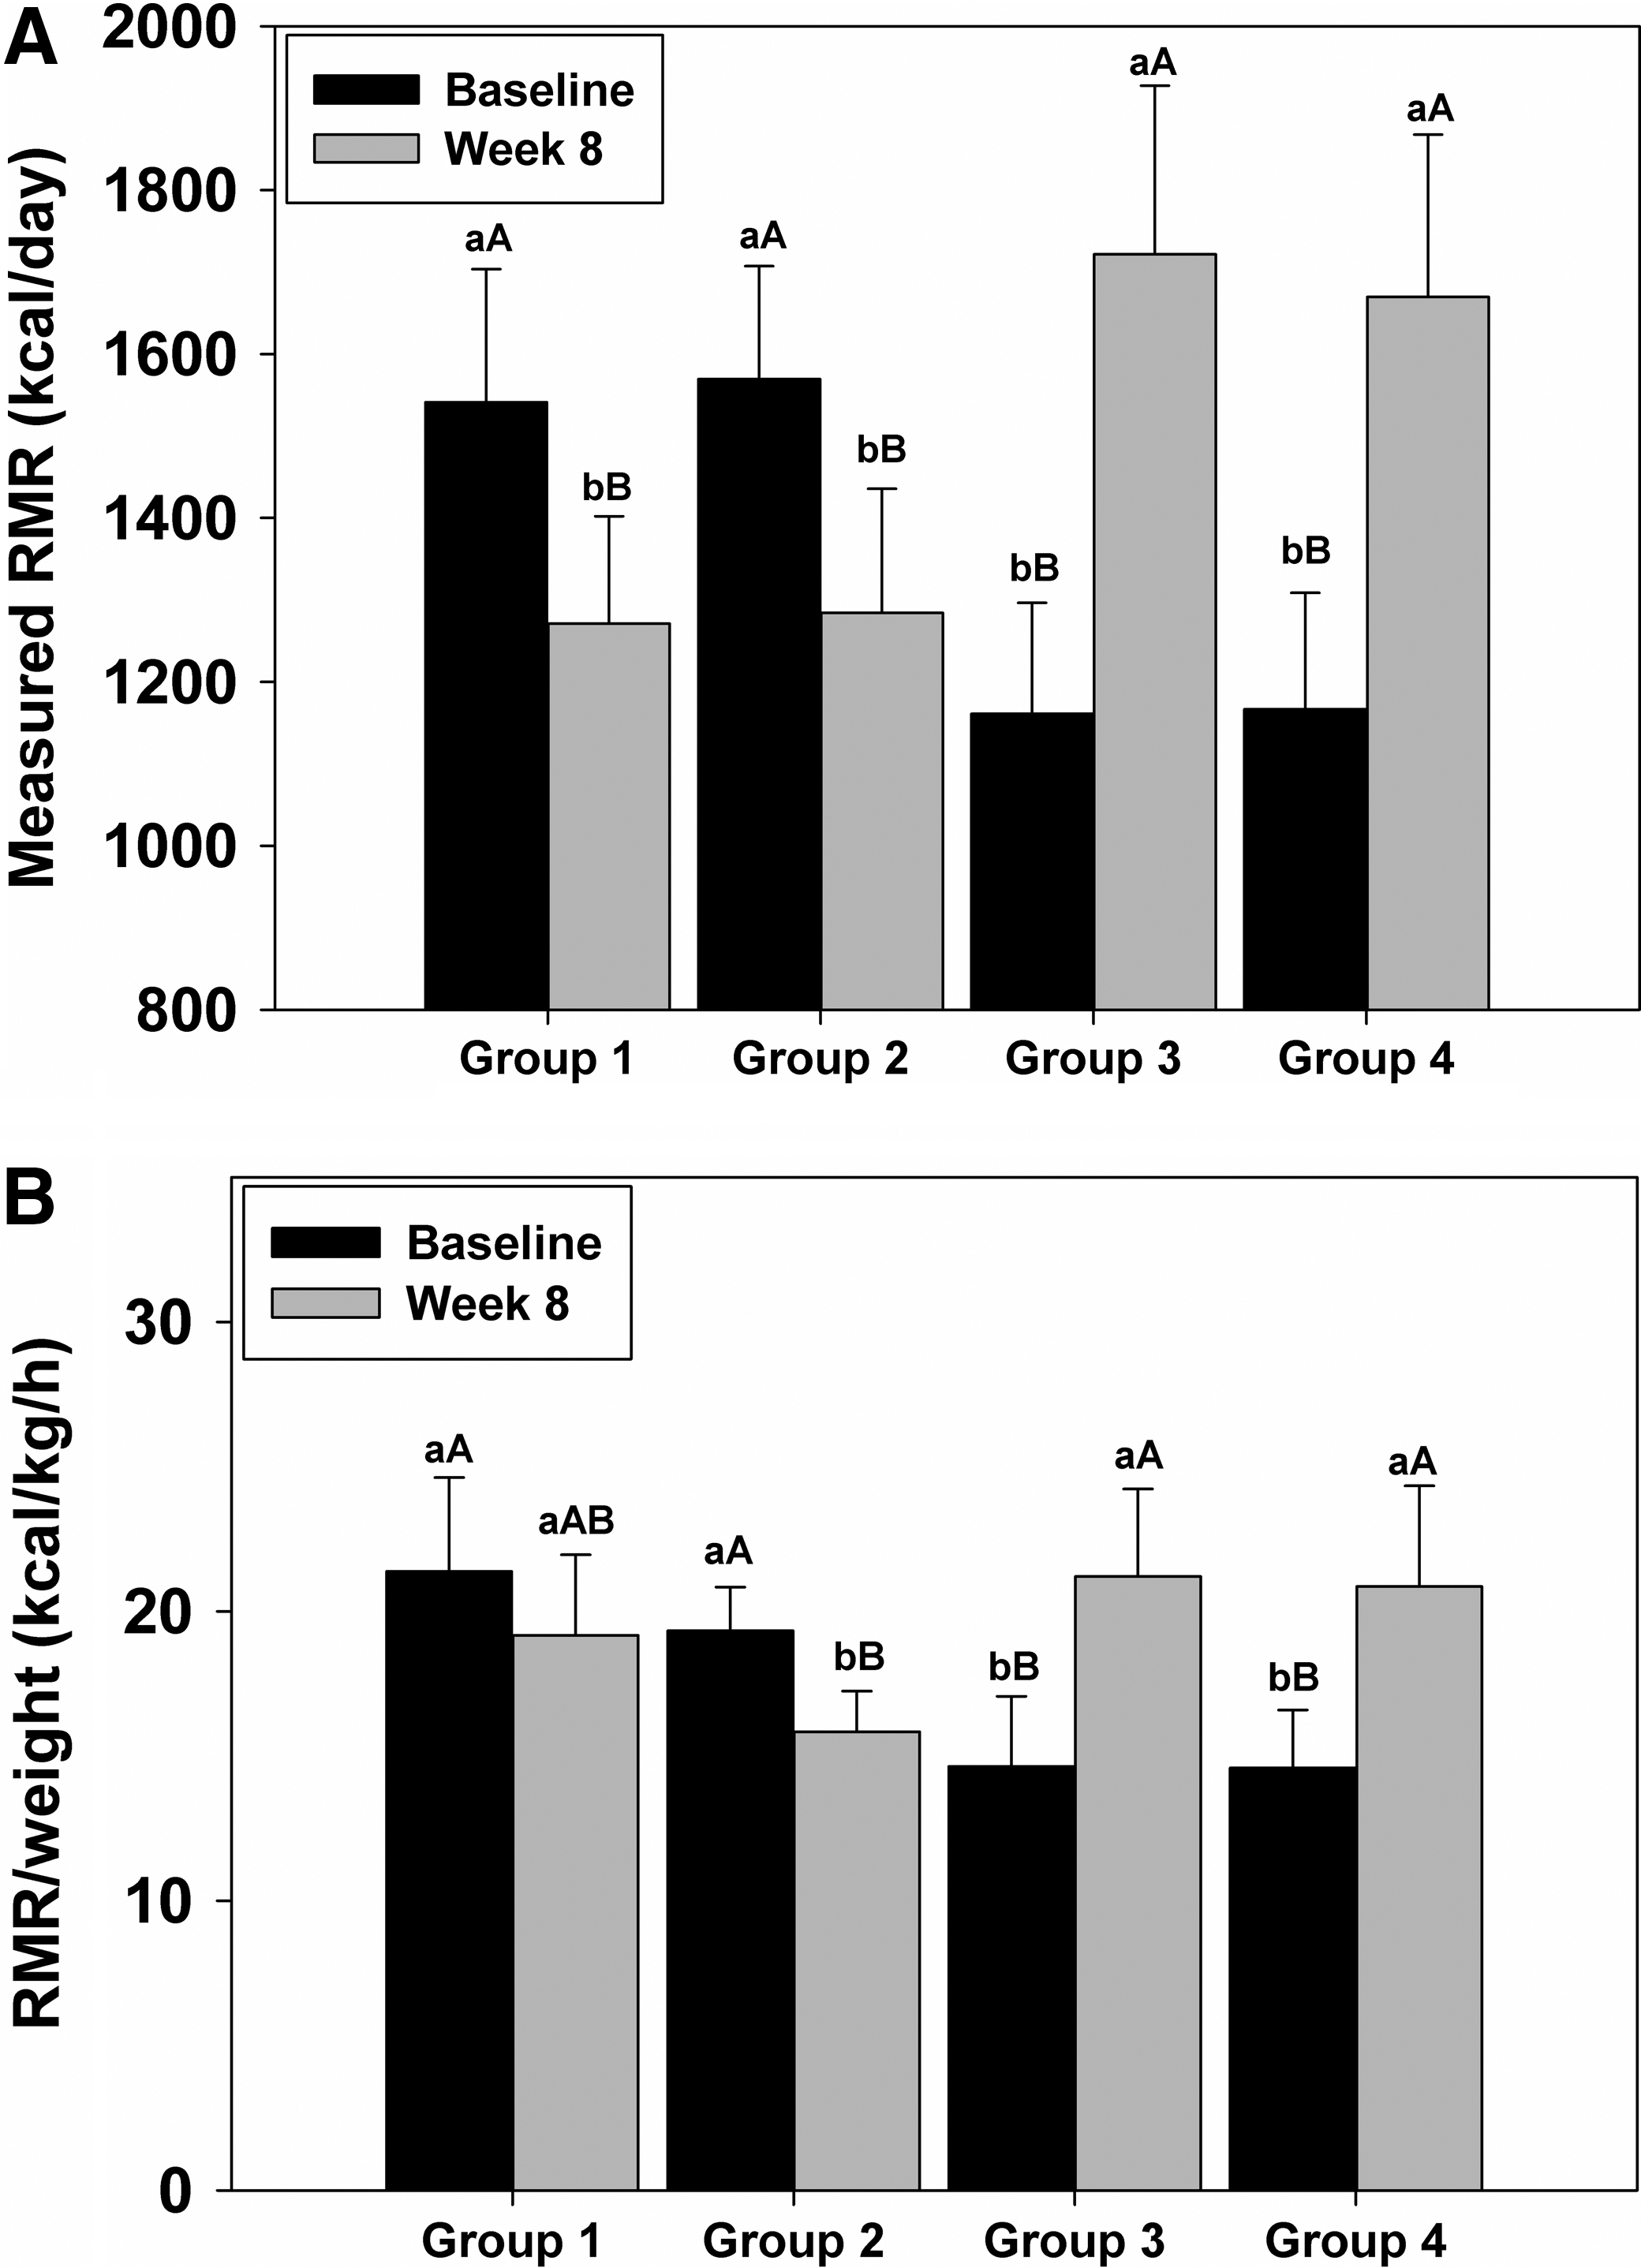
Resting metabolic rate (RMR)
Blood variables
The only groups that showed changes in the biochemical variables were groups 3 and 4. TAG decreased in both groups, but the decrease was only significant (P<.05) in group 3 (−37.6 mg/dL). The TAG levels in group 3 decreased 8.7% more than in group 4 (−19 mg/dL).
Muscle strength
Women who underwent the resistance training program (groups 3 and 4) showed increased muscle strength, which was observed during the weeks of training and verified by the 1RM tests performed both before and after the study period (Fig. 3). Both groups showed significant improvements (P<.05), and group 3 showed the greatest improvement. In group 3, the increase for the leg press (45°) was 83.3 kg (33.5%), while group 4 showed an increase of 60 kg (26.3%), which is a difference of 7.2% between the groups. For the bench press, group 3 increased by 7.9 kg (19.3%), and group 4 increased by 5.5 kg (14.5%), which is a difference of 4.8%. For the back pull down, group 3 increased by 12.6 kg (24.1%), and group 4 increased by 9 kg (18.6%), which is a difference of 5.5%.
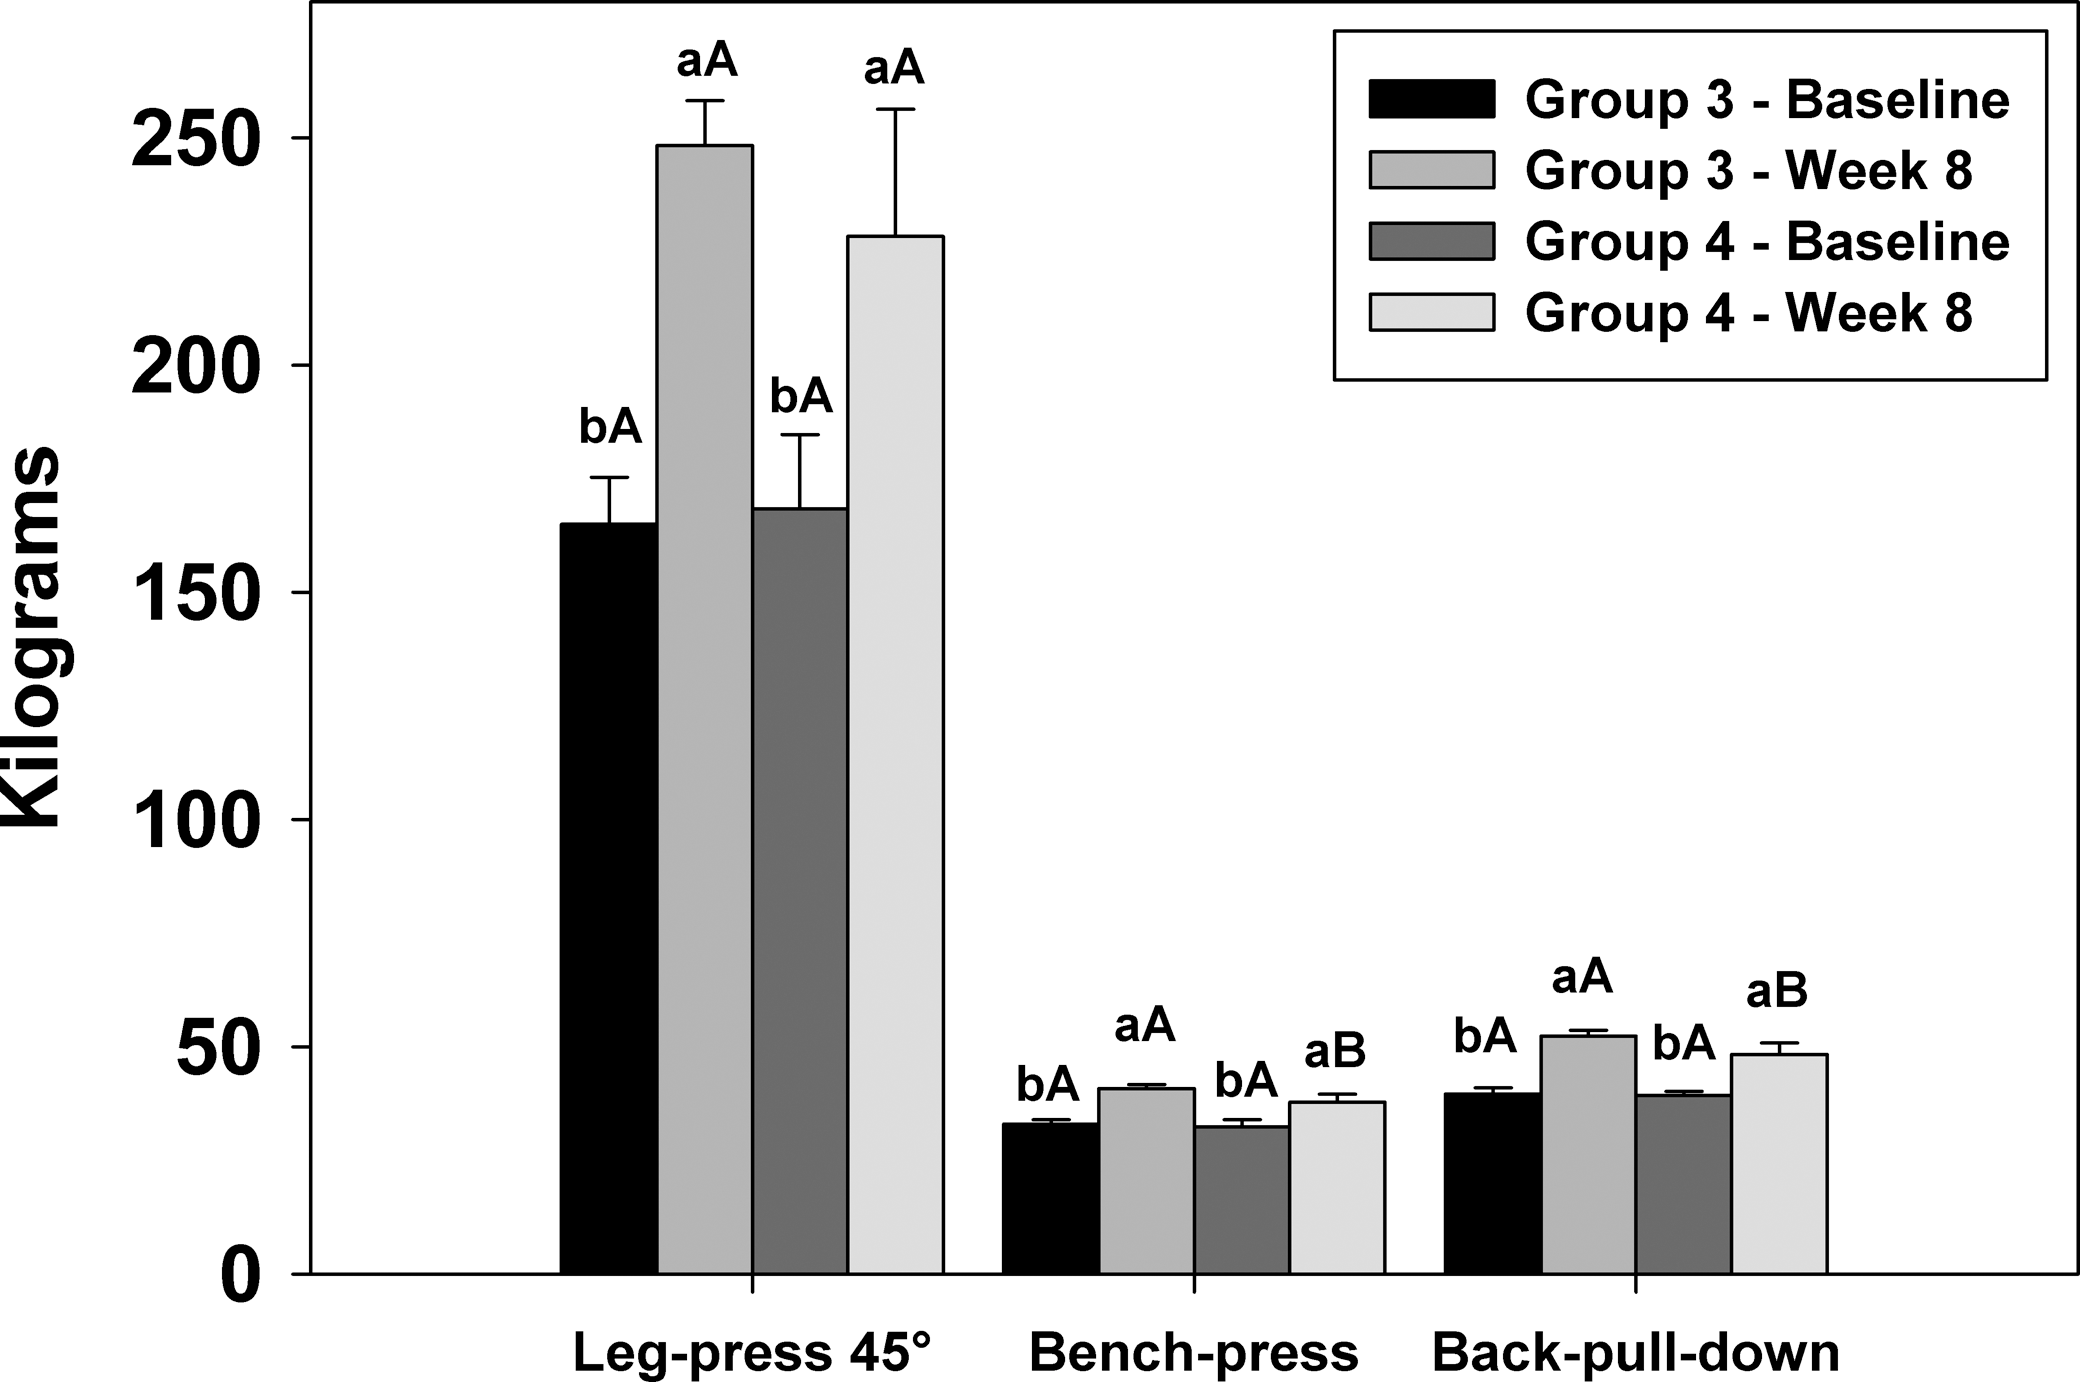
Maximum load of one repetition maximum test between baseline and week 8. abBars in each variable for the same treatment marked with different lowercase letters are significantly different (P<.05). ABBars in each variable for the same time marked with different uppercase letters are significantly different (P<.05).
Discussion
Anthropometric measurements
The only group that showed a change in body mass was group 1 (green tea). Subjects in group 1 lost an average of 5.7 kg (7.8%), which is probably related to the thermogenic effects of green tea. 25 Although this was not a significant decrease, we consider this to be a major change from a biological point of view. A loss of body mass has also been reported by Wang et al., 11 who, over a period of 90 days, found a significant loss of 1.2 kg (1.7% of the total weight of their volunteers), which was a much smaller weight loss than what we found in our research. As a result of weight loss, BMI and waist circumference also decreased, but not significantly. Other studies showed significantly decreased values for these parameters, including body fat mass and percentage, but at levels lower than those measured in our study. 7,11,26 With green tea consumption, we observed a maintenance of lean body mass and a loss of body fat mass, which reduced the body fat percentage (−4.7%). This finding can be attributed to increased mobilization of body fat as a source of energy, which preserves lean body mass. This is consistent with the study by Dulloo et al., 1 who found that both fat oxidation and energy expenditure increase due to the bioactive compounds in green tea.
In group 2, which only consumed the placebo, body composition did not change. There was no change in body mass, BMI, or waist circumference. Lean body mass decreased slightly (−2.3 kg). With caloric restriction, muscle mass is broken down for use as energy, 27 which occurred in group 2, but not group 1, possibly because of the consumption of green tea. Body fat also increased slightly (2 kg). With the small decrease in lean body mass and the small increase in body fat, body fat percentage increased in the group that took the placebo (2.1%). No positive change in body composition was observed in the sedentary individuals.
In group 3 (green tea plus resistance training), the subjects did not lose body mass despite green tea consumption due to the significant increase in lean body mass (P<.05) and significant decrease in body fat (P<.05). Once the muscle mass reaches a threshold, the fat mass begin to decrease more significantly, but with continued resistance training, this may be accompanied by weight loss. 27 Because there was no change in body mass, there was no change in BMI. Waist circumference decreased significantly (P<.05). The increase in lean body mass was significant in all the volunteers. This response was due to adaptation to resistive exercise. 28 Due to the increase in lean body mass and decreased body fat, there was a significant decrease in body fat percentage (10.3% in group 3). During exercise, fat oxidation is induced by carnitine palmitoyl transferase 1 (CPT1), which assists in the introduction of fatty acids into the mitochondria for use as an energy source. 29 –31 Catechins in green tea increase the expression of lipolytic substances, one of which is CPT1, 16 which may explain why there was a greater reduction in body fat percentage in group 3 than in group 4.
Group 4 (placebo plus resistance training) experienced no change in body mass, but lean body mass increased and body fat decreased. BMI remained unchanged, and there was only a slight decrease in waist circumference due to the change in body composition. Lipid utilization predominantly occurs in obese individuals after a training period, but there is no accompanying change in body mass, although there is a decrease in abdominal subcutaneous fat. 32 The decrease in body fat in group 4 was not significant, which is similar to the findings of Rodríguez-Bies et al. 33 In that study, physical exercise every other day helped to increase performance via cellular metabolic changes that increased β-oxidation in the mitochondria, which changed the shape and location of the mitochondria in the muscle fibers and increased the utilization of fat in the skeletal muscle. One of the factors that increases the fat-burning effects of exercise is repetition, which increases the density of mitochondria and assists in the expression of transporters of fatty acids to be oxidized by CPT1 and CPT2. 30 There was no significant increase in lean body mass, so although there was a decrease in body fat, there was no significant change in the body fat percentage of group 4, despite the apparent decrease (−4.4%).
Energy expenditure
The subjects in group 1 showed a decrease in RMR (270.4 kcal/day) due to decreased body mass, which lowers the calorie expenditure necessary for body mass maintenance. 34 This is in agreement with Cesar et al., 35 who found that the reduction of daily energy expenditure was proportional to the weight loss of their volunteers.
Group 2, who only consumed the placebo, showed a significant decrease in RMR (312 kcal/day, P<.05) due to the plateau effect on the decrease in caloric intake caused by the study diet. The decrease in RMR was not related to a loss of body mass, as this did not occur in this group.
Women who consumed green tea and engaged in resistance training exercises (group 3) had a significant increase in RMR (560.8 kcal/day, P<.05). This was due to the significant increase in lean body mass, which led to a subsequent increase in RMR relative to mass (6.6 kcal/[kg·h]). Because lean mass is more metabolically active, the body expends more energy to maintain it. 27
The group that ingested the placebo combined with resistance training (group 4) also showed an increase in RMR due to increased lean body mass (502.8 kcal/day). Similarly, the RMR for body mass increased without a change in overall mass (6.3 kcal/[kg·h]). A calorie-restricted diet can reduce daily energy expenditure per kilogram of weight lost, but this process can be mitigated by exercise due to increased muscle mass. 36
Blood variables
Biochemical analyses of the subjects in group 1 (green tea) showed no significant changes. This may be due to the short study period (2 months) or possibly due to the amount of total polyphenol intake during the day. These results are similar to those of other studies, which also reported no significant changes in biochemistry. 26,37
Group 2 (placebo) also showed no variation in the biochemical analysis; however, this group did not consume the bioactive compound contained in green tea.
Biochemical analyses of group 3 showed no significant differences in the variables presented, except for a reduction in TAG. This reduction can be explained by the significant loss of body fat, which was influenced by resistance training and green tea consumption, because this was the only group whose TAG levels declined significantly. This may be related to increased expression of the hormone-sensitive lipase (HSL) in the presence of epigallocatechin gallate (EGCG), which hydrolyzes TAG into free fatty acids. 16 In this way, fatty acids can be mobilized as an energy source instead of being reabsorbed by the body, which would happen with a sedentary person. This may explain why TAG levels were unchanged in group 1 (green tea), but declined in groups 3 and 4.
The reduction of abdominal fat also helps to reduce the levels of TAG, as observed in this study. The green tea catechins modulate the effects of the SNS on the oxidation of lipid deposits in a superior way if compared physical exercise by itself. 38 This explains the greater decrease in TAG levels in group 3 than in group 4. EGCG is a noncompetitive inhibitor of NADPH, which acts as a substrate for fatty acid synthesis. The catechins in green tea regulate the enzyme glycerol-3-phosphate dehydrogenase, which is connected to the synthesis of TAG by catalyzing the β-nicotinamide adenine nucleotide to reduce dihydroxy-acetone phosphate to produce glycerol-3-phosphate (direct precursor of TAG). 39
Group 4 (placebo plus resistance training) also showed decreased levels of TAG, but this reduction was not significant. This decrease may be associated with resistance training, which reduces body fat by metabolizing it during physical exercise; this effect may be better observed over a longer period of time. 40,41
Muscle strength
Increases in muscle strength were observed in the groups that did resistance training, with significant variations in both group 3 and group 4 (P<.05). The increases were greater in group 3 due to the consumption of green tea.
There were significant improvements in 1RM. According to Hakkinen et al., 42 significant increases in load tests are due to increased neuromuscular coordination and muscle hypertrophy related to increased lean body mass.
The neuromuscular system adapts to resistance training, 43 and physiological changes occur to muscles at the structural level. Programs of resistance training that last at least 2 months 44 will show measurable increases in strength and when done regularly and with sufficient intensity, stimulates skeletal muscle to synthesize new proteins, which leads to hypertrophy. Due to hypertrophy, muscle mass and muscle strength both improve. 45 This increased force can be seen in the increased load on an 1RM test. The 1RMs in group 3 were significantly higher than those in group 4 due to the consumption of green tea.
Conclusion
Green tea promoted changes in body composition, weight loss, the maintenance of lean body mass, loss of body fat, decreased waist circumference, and lowered body fat percentage. When coupled with resistance training exercises, there were greater decreases in waist circumference, body fat mass and percentage, and TAG levels, and green tea plus resistance training produced the largest gains in lean body mass and strength, as compared with exercise alone (placebo plus resistance training).
Footnotes
Acknowledgments
We sincerely thank the Coordination of Improvement of Personnel of Superior Level (CAPES) and the Luiz de Queiroz Foundation of Agrarian Studies (FEALQ) for financial aid and the Sanavita Industry for donation of the green tea and placebo.
Author Disclosure Statement
No competing financial interests exist