
Abstract
Emulin™ is a patented blend of chlorogenic acid, myricetin, and quercetin that has shown efficacy in reducing midday and post–oral glucose tolerance test (OGTT) area under the curve (AUC) glucose in streptozotocin-treated rats. The purpose of this study was to determine if similar effects would be evident in type 2 diabetic humans. Forty human subjects with confirmed type 2 diabetes (10 each in 4 groups: placebo/no medication, Emulin/no medication, placebo/metformin and Emulin/metformin) were evaluated. At the end of 1 week, fasting blood glucose, 2 h postprandial, actual peak glucose, and AUC (post–50 g OGTT) were determined. The placebo-only group had a large (5%–13%) increase in all parameters. The Emulin group and those on metformin performed similarly with reductions between 1% and 5%, with Emulin slightly outperforming the medication-alone group. The most significant reduction occurred in the Emulin/metformin group, with decreases in the parameters by up to 20%. These results suggest that Emulin, if consumed regularly, could not only have the acute effect of lowering the glycemic impact of foods, but chronically lower background blood glucose levels of type 2 diabetics.
Introduction
T
• Inhibit conversion of complex carbohydrates to simpler sugars • Inhibit the absorption of glucose from the gut into the bloodstream • Enhance the absorption of glucose from the bloodstream and its utilization by muscle cell mitochondria • Inhibit new fat formation • Inhibit gluconeogenesis • Increase insulin sensitivity and production
Traditional treatment for diabetes has included alterations in diet to avoid refined carbohydrates and prescribing of drugs to inhibit hyperglycemia and increase insulin release. Common drugs for the treatment of diabetes or its symptoms are listed in Table 1. All are synthetic, target at most two metabolic pathways, and have moderate or severe side effects. Natural compounds with excellent safety profiles have been shown to ameliorate the symptoms of diabetes by affecting various pathways and have been studied for decades. 8
GLP, glucagon-like peptide.
Inhibition of glucosidase
Tarling et al. 9 screened 30,000 crude biological extracts of terrestrial and marine origin for competitive inhibition of amylase, the most potent of which were found to have a myricetin core. Additionally, significant alpha glucosidase activity is inhibited by chlorogenic acid in humans, 10,11 by myricetin and quercetin in swine, 11,12 and in rat in vitro by quercetin. 13 This may be the underlying metabolic effect where chlorogenic acid-enriched coffee with glucose causes weight loss in humans. 14 Similarly, 0.5% Gross Coffee Bean Extract, of which chlorogenic acid is a major constituent, has been shown to reduce visceral fat content and body weight in mice. 15
Effects on glucose transport
Robust noncompetitive inhibition of glucose and fructose transport by glucose transporter 2 (GLUT2) is produced by the flavonols myricetin and quercetin. 16 Intravenous administration (1 mg/kg) of myricetin causes a decrease in the plasma glucose concentration and insulin resistance of obese Zucker rats by increasing the expression of glucose transporter 4 (GLUT4) and increasing the protein levels and phosphorylation of insulin receptor substrate-1 in soleus muscle of these obese rats. 17,18 At the same time, myricetin has been shown to inhibit the same transporter GLUT4 in vitro in normal rat adipocytes. 19 This different activity in different tissues, or tissues of the same type in different organs, may be due to a difference in membrane fluidity. 20
Inhibition of adipocyte growth and development
Myricetin coupled with quercetin together work to inhibit net glucose from entering fat cells 19 and release glucose from fat tissue in rat adipocytes. 21 –24 Preadipocyte growth or development into adipocytes is inhibited in vitro by quercetin 25 and chlorogenic acid. 26
Inhibition of gluconeogenesis
Quercetin inhibits gluconeogenesis in rat liver slices, 21,27 which appears to be by inhibition of glucokinase and glucose 6-phosphatase. 20
In a study of streptozotocin-treated rats, equal amounts of myricetin, chlorogenic acid, and quercetin (total 15 mg/kg) were administered three times per day via gavage; at the end of 1 week, midday background blood glucose and postprandial area under the curve (AUC) blood glucose dropped by 18% and 27%, respectively (Koetzner L: Personal communication. Eurofins Product Safety Laboratories, Dayton, NJ, USA).
A main reason for noncompliance (patients not taking their medication) associated with diabetic pharmaceuticals is gastro-intestinal issues. 28,29 Capsules containing 500 mg of guava leaf extract normalized for quercetin content administered every 8 h during 3 days is effective in reducing abdominal pain associated with acute diarrhea in humans. 30 Oral treatment with quercitrin, which appears to be converted to quercetin in the small intestine, 31 reduces myeloperoxidase and alkaline phosphatase levels, preserves normal fluid absorption, counteracts glutathione depletion, and ameliorates colonic damage. 32 Quercetin-treated rats have less diarrheal output and do not show mucosal hyperplasia. 33
It would appear from these previous studies that a formulation of flavonoids containing myricetin, chlorogenic acid, and quercetin would work in combination on several pathways to ameliorate the symptoms of diabetes and address much of DeFronzo's concerns, while at the same time alleviate gastrointestinal distress. The purpose of this study is to evaluate whether Emulin™ (Anderson Global Group LLC, Irvine, CA, USA), a recently available proprietary patented formulation of myricetin, quercetin, and chlorogenic acid, the combination and ratio of which do not themselves occur in nature, is able to reduce fasting and postprandial plasma blood glucose in human type 2 diabetics, while avoiding gastrointestinal upset.
Materials and Methods
This was a randomized, double-blind, placebo controlled, parallel group study. Test article identity was unknown to principle investigator, clinic staff, or subjects. This research was fully reviewed by Quorum Review IRB (Seattle, WA, USA) and procedures followed were in accordance with the ethical standards of the responsible committee on human experimentation and with the Helsinki Declaration of 1975, as revised in 2008. Forty subjects were selected based upon the following criteria:
Inclusion criteria:
• Male or female age 18 or older • Females of childbearing potential must agree to use a medically approved method of birth control and have a negative urine pregnancy test result • Diagnosed with type 2 diabetes (having a blood sugar level between 126–249 mg/dL) • body mass index (BMI)≥30 kg/m2
Exclusion criteria:
• Women who are pregnant, breastfeeding, or planning to become pregnant during the course of the trial • Unstable medical conditions as determined by the Principle Investigator • Use of insulin • Participation in a clinical research trial within 30 days before randomization • Subjects with type I diabetes
Subjects were screened to meet the inclusion and exclusion criteria. An insulin C-peptide blood test was performed to show that individuals did not have type 1 diabetes. At screening (visit 1, week 0), a urine pregnancy test was conducted on all females of childbearing potential. Medical history and concomitant therapies were reviewed; height, weight, heart rate, and blood pressure were measured and BMI calculated. Fasting blood samples were collected for determination of glucose from eligible subjects. Subjects were divided into two groups: those on metformin, and those on no drug regime. As subjects of both groups were enrolled they were assigned into group A or group B without prejudice. This resulted in four groups: (1) Placebo only, (2) Emulin only, (3) Placebo and on metformin, and (4) Emulin and on metformin.
Subjects were administered one 250 mg capsule (placebo or Emulin, according to group assignment) 15 min before undergoing oral glucose tolerance test (OGTT) with blood sampling for glucose at 0, 30, 60, 120, 180, and 240 min after ingesting a 50 g glucose tolerance beverage (Ensure) within 5 min. Bottles (containing placebo or Emulin capsules, marked “A” or “B”) and a treatment diary were dispensed and subjects instructed on use. Subject self-administered one 250 mg capsule 15 min before breakfast, lunch, and dinner every day except on day of next OGTT, where the dose at breakfast was skipped. Subjects were instructed to record food intake, remain on their typical diet, and to fast 12 h before returning to the clinic for the next OGTT.
Subjects returned to the clinic for visit 2 on day 7 (week 1). Weight, heart rate, and blood pressure were measured and OGTT performed as on visit 1. Diaries were collected; compliance, concomitant therapies, and adverse events were assessed and addressed.
Blood glucose for each individual in Group A and Group B were determined for points at 0, 30, 60, 120, 180, and 240 min for each visit (two visits). The time zero for the OGTT served as the fasting blood glucose data point. AUCs were determined for each individual for each visit using the trapezoid method. Percent changes in fasting, peak postprandial, 2 h postprandial, and AUC glucose were determined for each individual within each treatment group. P-values were determined with a Mann–Whitney U-test for all combinations of pairs.
Results and Discussion
Fasting blood glucose levels >125 mg/dL and 2 h postprandial glucose post-OGTT >199 mg/dL are indicative of diabetes. The body's carbohydrate metabolism fails to adequately control blood sugar. Reducing these two major indicators could ameliorate the effects of diabetes. Table 2 shows the average percent changes in fasting, 2 h postprandial, actual peak, and AUC blood glucose at 1 week for all treatment groups.
Groups are as follows: placebo, taking a placebo and not on any drug regime; Emulin, taking Emulin and not on any drug regime;metformin, on metformin and taking a placebo; E+M, taking Emulin and on metformin.
Percent change is the average percent change in the parameters between day 0 and day 7 for all individuals in the group.
Values followed by the same letter are not significantly different at the indicated alpha level.
Fasting blood glucose
There was a large increase in the placebo group (12.75%), while there was a decrease in the Emulin and metformin groups at α=0.01 and 0.10, respectively. Emulin outperformed the metformin group, which remained unchanged, but the difference between the groups was not statistically significant. Those persons on metformin receiving Emulin showed over 30-fold increase in efficacy, significant at α=0.10, the effect more than additive, indicating the test article is impacting other pathways associated with fasting blood glucose than those affected by metformin alone. It appears the body has reset its fasting blood glucose at a lower level in response to Emulin or the combination of Emulin and metformin. Such a dramatic increase in the placebo group can be explained by the patients taking the liberty to change their diets to include more glucose-rich foods.
Two hour postprandial and peak glucose
As with the fasting blood glucose, for the 2 h postprandial blood glucose there was an increase in the placebo group; however, smaller at 4.9%. There was no significant difference between the placebo, Emulin, and metformin only groups at α=0.10. However, the combination Emulin and metformin group (E+M) decreased 13% and was significantly different contrasted to the placebo group at α=0.05. The actual peak glucose showed a very similar pattern except the increase in the placebo group and the decrease in the E+M group was about double and one third that of the 2 h postprandial changes, respectively.
Area under the curve
Fasting blood glucose and AUC showed a remarkably similar pattern and levels of significance. Although fasting blood glucose and peak glucose levels are indicators for diabetes, AUC is most often used to determine the effectiveness of treatments for the disease. With no treatment, the placebo group had an increase in this parameter of 11.5% by the end of the week, while the Emulin alone group experienced a 5% decrease. Metformin alone was slightly less effective at reducing AUC (3%) than Emulin alone. When taken with Emulin, the reduction was >16%. While the effects appear to be more than additive, there was no significant difference between the Emulin and metformin groups. The data presented in Table 2 is visually represented in Figures 1 and 2. The acute effect of Emulin (the effect which occurs immediately or within hours of administration) is shown in Figure 1. Peak glucose and AUC were reduced compared to control (placebo) in the Emulin groups with or without metformin, which results in a lower glycemic impact, with the E+M group having the lowest peak and AUC. Figure 2 shows a chronic effect (the effect which occurs over days following or during administration) evident at 1 week. What is immediately apparent is the separation between groups with respect to all parameters at 1 week contrasted with week 0. The Emulin, metformin, and E+M groups all had lower fasting, peak, and AUC blood glucose levels as compared with the placebo group. The metformin groups' peak glucose was delayed 1 h compared to the placebo and Emulin-only groups. However, the AUC for both Emulin and E+M groups had significantly lower AUC than either the placebo or metformin-only groups.
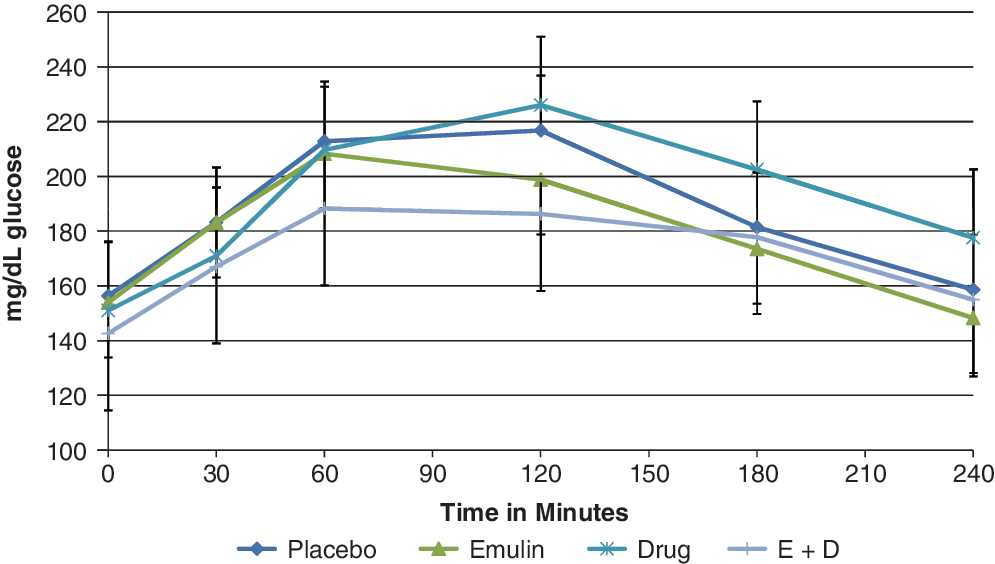
Effect of Emulin, metformin, and Emulin plus metformin on oral glucose tolerance test (OGTT) following administration of 250 mg Emulin at day 0. Data points are group means with standard errors, n=10. Color images available online at
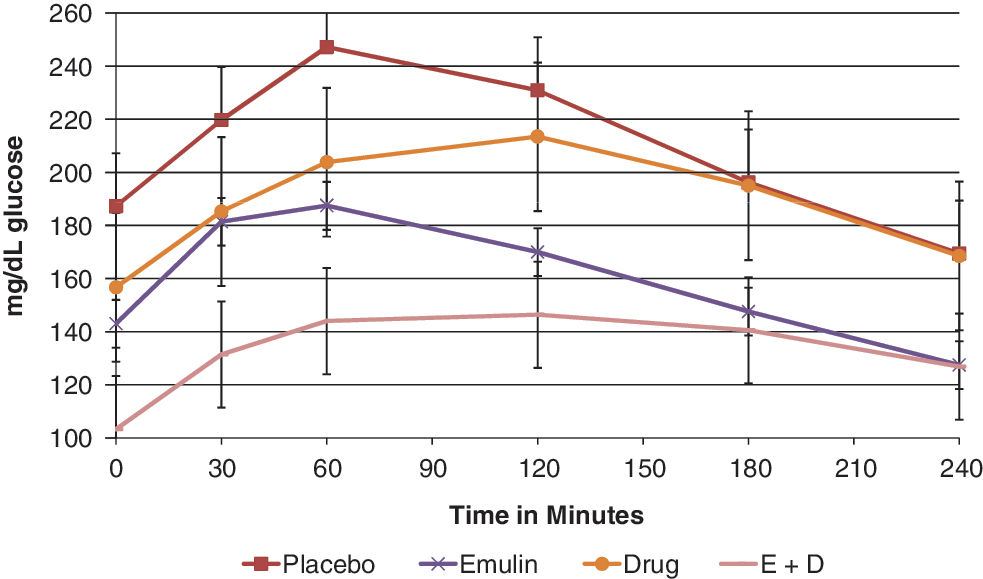
Effect of Emulin, metformin, and Emulin plus metformin on OGTT after 1 week administration of 250 mg Emulin 3×daily. Data points are group means with standard errors, n=10. Color images available online at
In this study, there were no significant distribution patterns of weight, BMI, race, sex, or age between groups and no observed significant differences between diets and food consumption patterns between groups. Although quercetin and myricetin have been shown to competitively inhibit the uptake of methylglucose in isolated rat adipocytes 18 and preadipocyte growth or development into adipocytes is inhibited in vitro by chlorogenic acid 22 and quercetin, 23 in this trial, there was no significant differences in weight loss between groups, probably due to the brevity of the study period. One subject each in the metformin and E+M groups reported gastrointestinal issues. These data suggest that Emulin can impact blood glucose levels in type 2 diabetics by lowering fasting blood glucose levels, and AUC following OGTT by 1 week. Individuals already receiving metformin as a treatment may see improvements over metformin alone by the addition of Emulin. These results support the hypothesis that Emulin, if consumed regularly, could not only have the acute effect of lowering the glycemic impact of foods, but chronically lower background blood glucose levels of type 2 diabetics. Further research is warranted.
Footnotes
Acknowledgments
The authors wish to express appreciation to Mark Kipnes, Associate Director, Diabetes & Glandular Disease Clinic, San Antonio, TX, USA, for valuable insight and assistance in coordinating and planning this investigation.
Author Disclosure Statement
J.A. and D.T. are employees of ATM Metabolics LLC, Winter Haven, FL, USA. This study was conducted under contract by the Diabetes & Glandular Disease Clinic and financed by ATM Metabolics LLC.