




Abstract
The aim of this study was to evaluate the metabolic effects of 12-week honey consumption on patients suffering from type 1 diabetes mellitus (DM). This was a randomized crossover clinical trial done in the National Institute for Diabetes and Endocrinology, Cairo, Egypt. Twenty patients of both sexes aged 4–18 years with type 1 DM and HbA1C<10% participated in the study. They were randomized into two equal groups (intervention to control and control to intervention). The dietary intervention was 12-week honey consumption in a dose of 0.5 mL/kg body weight per day. The main outcome measures were serum glucose, lipids, and C-peptide, and anthropometric measurements. None of participants were lost in follow-up. The intervention resulted in significant decreases in subscapular skin fold thickness (SSFT; P=.002), fasting serum glucose (FSG; P=.001), total cholesterol (P=.0001), serum triglycerides (TG; P=.0001), and low-density lipoprotein (P=.0009), and significant increases in fasting C-peptide (FCP; P=.0004) and 2-h postprandial C-peptide (PCP; P=.002). As possible long-term effects of honey after its withdrawal, statistically significant reductions in midarm circumference (P=.000), triceps skin fold thickness (P=.006), SSFT (P=.003), FSG (P=.005), 2-h postprandial serum glucose (P=.000), TG (P=.003), and HbA1C (P=.043), and significant increases in FCP (P=.002) and PCP (P=.003) were observed. This small clinical trial suggests that long-term consumption of honey might have positive effects on the metabolic derangements of type 1 DM.
Introduction
T
Honey is a natural substance produced by honey bees. It has many benefits for nutrition and health. 3 Glucose and fructose, the main carbohydrates in honey, constitute ∼70% of the honey solids. Other carbohydrates constitute ∼10% of the honey solids. The noncarbohydrate part of honey consists of water (17%) and other elements (3%) such as acids, proteins, and minerals. 3,4 Several studies have shown that honey produced an attenuated postprandial glycemic response when compared with sucrose in both patients with diabetes and normal subjects. 5 –10 To our knowledge, no studies have been done to evaluate the effects of long-term ingestion of honey in type 1 DM. However, in patients with type 2 DM, Bahrami et al. 11 found that consuming honey for 8 weeks resulted in significant decreases of body weight, total cholesterol (TC), low-density lipoprotein (LDL), and triglycerides (TG), and a significant increase of high-density lipoprotein (HDL), but the levels of HbA1C also increased significantly. Also Oizumi et al. 12 reported that consumption of a palatinose-based balanced formula for 12 weeks resulted in improvement of metabolic syndrome-related parameters in subjects with impaired glucose tolerance. Palatinose is a disaccharide present in honey, which has the characteristics of delayed digestion and absorption. 13,14
The present study aimed at evaluation of the effects of 12-week honey consumption on patients suffering from type 1 DM.
Methods
This was a crossover randomized study that took place at the National Institute for Diabetes and Endocrinology, Cairo, Egypt, from January 2010 to October 2011. All patients >2 years of age with type 1 DM and with HbA1C<10% were candidates for this study. The patient was considered suffering from type 1 DM if the fasting or random C-peptide level was below 1.26 or 1.5 ng/mL, respectively.
15
Exclusion criteria included any of the following: (1) coexisting renal or hepatic impairment, (2) coexisting diseases, for example, malignancy or other endocrine disorders; or (3) patients on steroid therapy or other drugs that may affect the body weight or serum lipids. The study was approved by the local Ethics Committee of the National Institute for Diabetes and Endocrinology. The total number of eligible patients was 47. However, 27 patients were excluded, because the parents of 11 patients refused to participate, as they were afraid of hyperglycemia possibly induced by honey, and in 16 patients, the facilities for contact and follow-up were not feasible. The study thus included 20 patients (Supplementary Fig. S1; Supplementary Data are available online at
A crossover design (two 12-week intervention periods) was used to measure honey effects. The subjects were randomized into two groups (intervention to control [I/C] and control to intervention [C/I] groups; groups 1 and 2, respectively). Each study group had 10 subjects. A computer-generated list of random numbers was used to allocate participants equally in each group. Since there was no previous similar study, a prespecified sample size was not determined. The subjects in the I/C group consumed 0.5 mL honey/kg body weight daily in the first 12-week period (period 1), while the subjects in the C/I group did not receive honey as a control in period 1. The caloric value of honey consumed per day (each 1 g honey gives 3 kcal) was subtracted from the daily total caloric intake of each subject during the intervention period. Apart from this, the parents were advised how to follow the usual diets for their children to maintain their usual total energy intake in a day, and to maintain the usual life style of their children throughout the study periods. To our knowledge, there is no laboratory test that could measure the levels of honey in blood or tissues. Therefore, the compliance to honey intake throughout the study was evaluated only through telephone contact and daily self-documentation. The honey used in this study was nonheated and nonirradiated Egyptian clover honey supplied by a beekeeper. This honey had a pH of 3.7, a moisture content of 18.8%, and a carbohydrate content of 78.4 g/100 g. The physicochemical characteristics of the honey used in the study are detailed in Supplementary Table S1. 16
After period 1, the subjects of each group exchanged their protocol for the following 12-week period (period 2).
The primary outcome measures were serum lipids and C-peptide; the secondary outcome measures were the anthropometric measurements. All measures were analyzed in participants at the baseline (0 week) and the end (12 [crossover] and 24 weeks [end point]) of the each study period: 1. Anthropometric measures: body weight %, height %, body–mass index (BMI), midarm circumference (MAC) %, tricep skin fold thickness (TSFT) %, and subscapular skin fold thickness (SSFT) %. MAC, TSFT, and SSFT were measured as was described by Gharib and Rasheed.
17
2. Fasting and 2-h postprandial serum glucose level were measured by quantitative enzymatic colorimetric assay using Stanbio Glucose kit (Cat. no. 1075). 3. Glycosylated hemoglobin (HbA1C) was measured by quantitative colorimetric method using Stanbio Glycohemoglobin kit (Cat. no. 350). 4. Serum lipid profile was measured using Cholesterol, Triglycerides and HDL Diamond Diagnostics Kits. LDL cholesterol was then calculated (LDL=total cholesterol − TG/5 − HDL cholesterol). 5. Fasting and postprandial serum C-peptide levels were assayed by quantitative immunoenzymatic colorimetric method using Novatec Immundiagnostica GMBH (Cat. no. DNOV112).
Statistical analysis
The collected data were revised, coded, tabulated, and introduced to a PC using Statistical Package for Social Sciences (SPSS 15.0.1 for Windows; SPSS, Inc., 2001). All numeric variables were expressed as mean±SD. The statistical significance of differences in the baseline characteristics between the groups was evaluated by student's t-test. Chi-square (χ2) test was used to compare frequency of qualitative variables among the different groups. Student's paired t-test was used to assess the differences in the characteristic values in each study period in each group, the differences in the percent changes in the characteristic values from the baseline to crossover (namely, in period 1) between the two groups, and the differences in the percent changes of the characteristic values from the beginning to the end of each study period between periods 1 and 2. A value of P<.05 was considered significant.
Results
The mean±SD) duration of diabetes was 4.4±4.98 (range: 1–16.5) and 5.0±3.9 (range: 1–13) years in groups 1 and 2, respectively, with no statistically significant difference (P=.77). None of the baseline characteristics showed significant difference between groups, except fasting serum glucose (FSG), HbA1C, and serum TG, which were significantly higher in group 1 than in group 2 (Table 1).
Values are means±SD. The significance of the difference between the values was examined by Student's t-test.
P<.05; ** P<.01.
DM, diabetes mellitus; BMI, body mass index; MAC, mid arm circumference; TSFT, triceps skin fold thickness; SSFT, subscapular skin fold thickness; FSG, fasting serum glucose; PSG, 2-h postprandial serum glucose; FCP, fasting C-peptide; PCP, 2-h postprandial C-peptide; LDL, low density lipoprotein cholesterol; HDL, high density lipoprotein cholesterol; I/C, intervention to control; C/I, control to intervention; SD, standard deviation.
None of the subjects were lost in follow-up. However, during the intervention period, two patients in the I/C group and one patient in the C/I group developed diabetic ketoacidosis and were admitted to the hospital for 2, 2, and 4 days, respectively, during which they stopped taking honey (P=.54). After discharge, honey was resumed for the three patients. There was an interval of at least one week between the time of hospital discharge and the time of analysis (i.e., 12 and 24 weeks in the I/C and C/I groups, respectively).
Table 2 shows the changes in the characteristic values of the study group in periods 1 and 2. Comparing the changes in period 1 (baseline vs. crossover) in the I/C group 1, statistically significant decreases were found in the SSFT%, FSG, 2-h postprandial serum glucose (PSG), TC, TG, and LDL at the end of intervention (12 week) compared to baseline. Also, there were statistically significant increases in the fasting C-peptide (FCP) and 2-h postprandial C-peptide (PCP). There were no significant differences in the other parameters. Comparing the changes in period 1 (baseline vs. crossover) in the C/I group 2, no statistically significant differences were observed in any of the characteristics. Comparing the changes in period 2 (crossover vs. study end point) in the I/C group 1, statistically significant reductions were observed in the MAC% and TSFT%. Also, a significant decrease of FCP and increases of TC and LDL were observed. No statistically significant differences were observed in the other parameters. Comparing the changes in period 2 (crossover vs. study end point) in the C/I group 2, statistically significant decreases were observed in the BMI, SSFT%, FSG, HbA1C, TC, TG, and LDL. Also, there were statistically significant increases in the FCP, PCP, and HDL.
Values are means±SD. The significance of the change in the values in each study period (period 1, baseline vs. crossover [12 weeks]; period 2, crossover vs. study end point [24 weeks]) in each study group were examined by Student's paired t-test.
P<.05; ** P<.01.
Regarding the percent changes in the characteristic values in period 1 (Table 3, Supplementary Fig. S2), significant differences were observed in MAC%, SSFT%, FSG, PSG, FCP, PCP, TC, TG, and LDL. On the other hand, no significant changes were observed for the TSFT, HbA1C, and HDL.
Values are means±SD. The significance of the difference between the values was examined by Student's paired t-test.
P<.05; ** P<.01.
In the I/C group, crossover comparison of periods 1 and 2 (Fig. 1; Supplementary Table S2) showed significant differences in the mean percent change of FSG (intervention vs. control: −21.94%±10.84% vs. 9.42%±21.31%, P=.010), FCP (49.2%±31.62% vs. −11.23%±16.74%, P=.002), PCP (27.77%±21.94% vs. −0.74%±13.54%, P=.011), TC (−14.72%±9.64% vs. 15.55%±18.44%, P=.004), TG (−23.91%±14.40% vs. 10.02%±18.73%, P=.007), and LDL (−19.32%±14.46% vs. 27.59%±38.88%, P=.014).
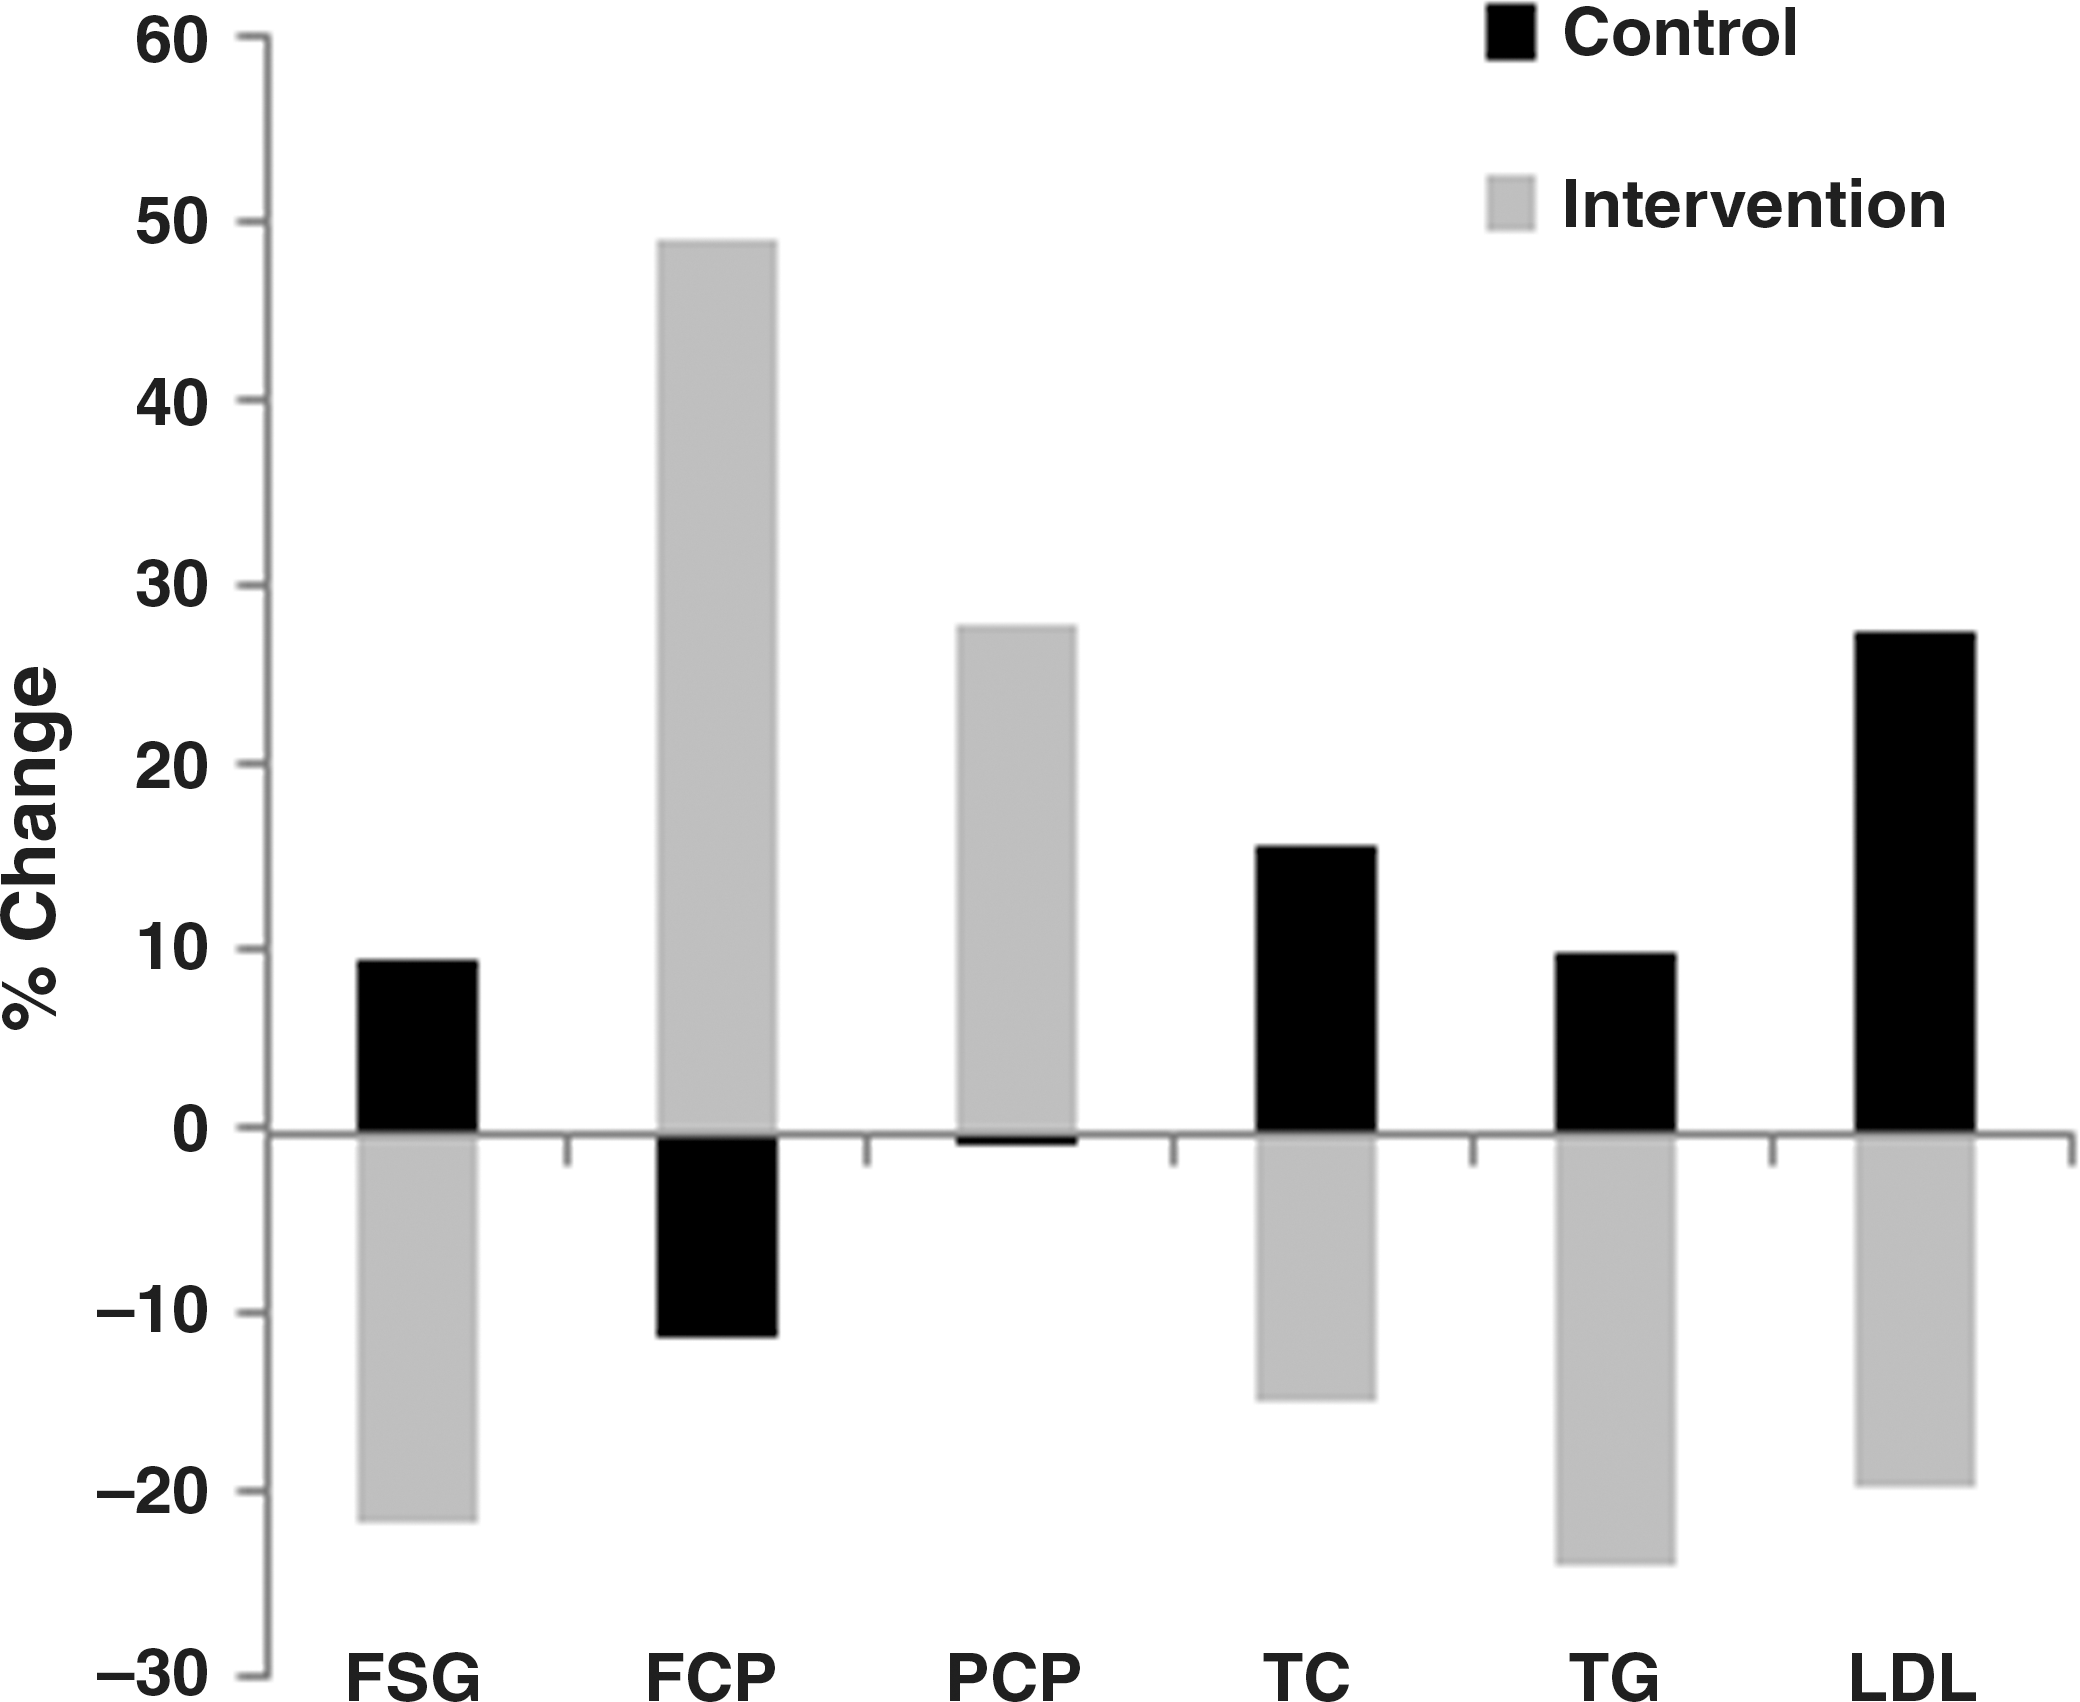
Characteristic values showing significant percent changes (P<.05) between periods 1 and 2 (intervention vs. control) in group 1 (I/C group). FSG, fasting serum glucose; FCP, fasting C-peptide; PCP, 2-h postprandial C-peptide; TC, total cholesterol; TG, triglycerides; LDL, low density lipoprotein cholesterol; I/C, intervention to control.
In the C/I group, crossover comparison of periods 1 and 2 (Fig. 2; Supplementary Table S3) showed significant differences in the mean percent change of FSG (intervention vs. control: −15.22%±7.52% vs. −0.09%±5.14%, P=.000), PCP (31.18%±11.45% vs. 1.91%±6.75%, P=.000), TC (−9.02%±4.97% vs. −0.15%±4.75%, P=.003), TG (−13.86%±12.63% vs. 1.08%±6.70%, P=.032), and LDL (−17.75%±8.55% vs. −0.25%±5.44%, P=.000). Moreover, in this group, significant differences were also observed in the mean percent change of SSFT (intervention vs. control: −5.50%±0.00% vs. 0.46%±1.44%, P=.000), Hb A1C (−13.72%±8.73% vs. 2.94%±8.83%, P=.008), and HDL (20.63%±17.17% vs. 0.25%±9.64%, P=.009).
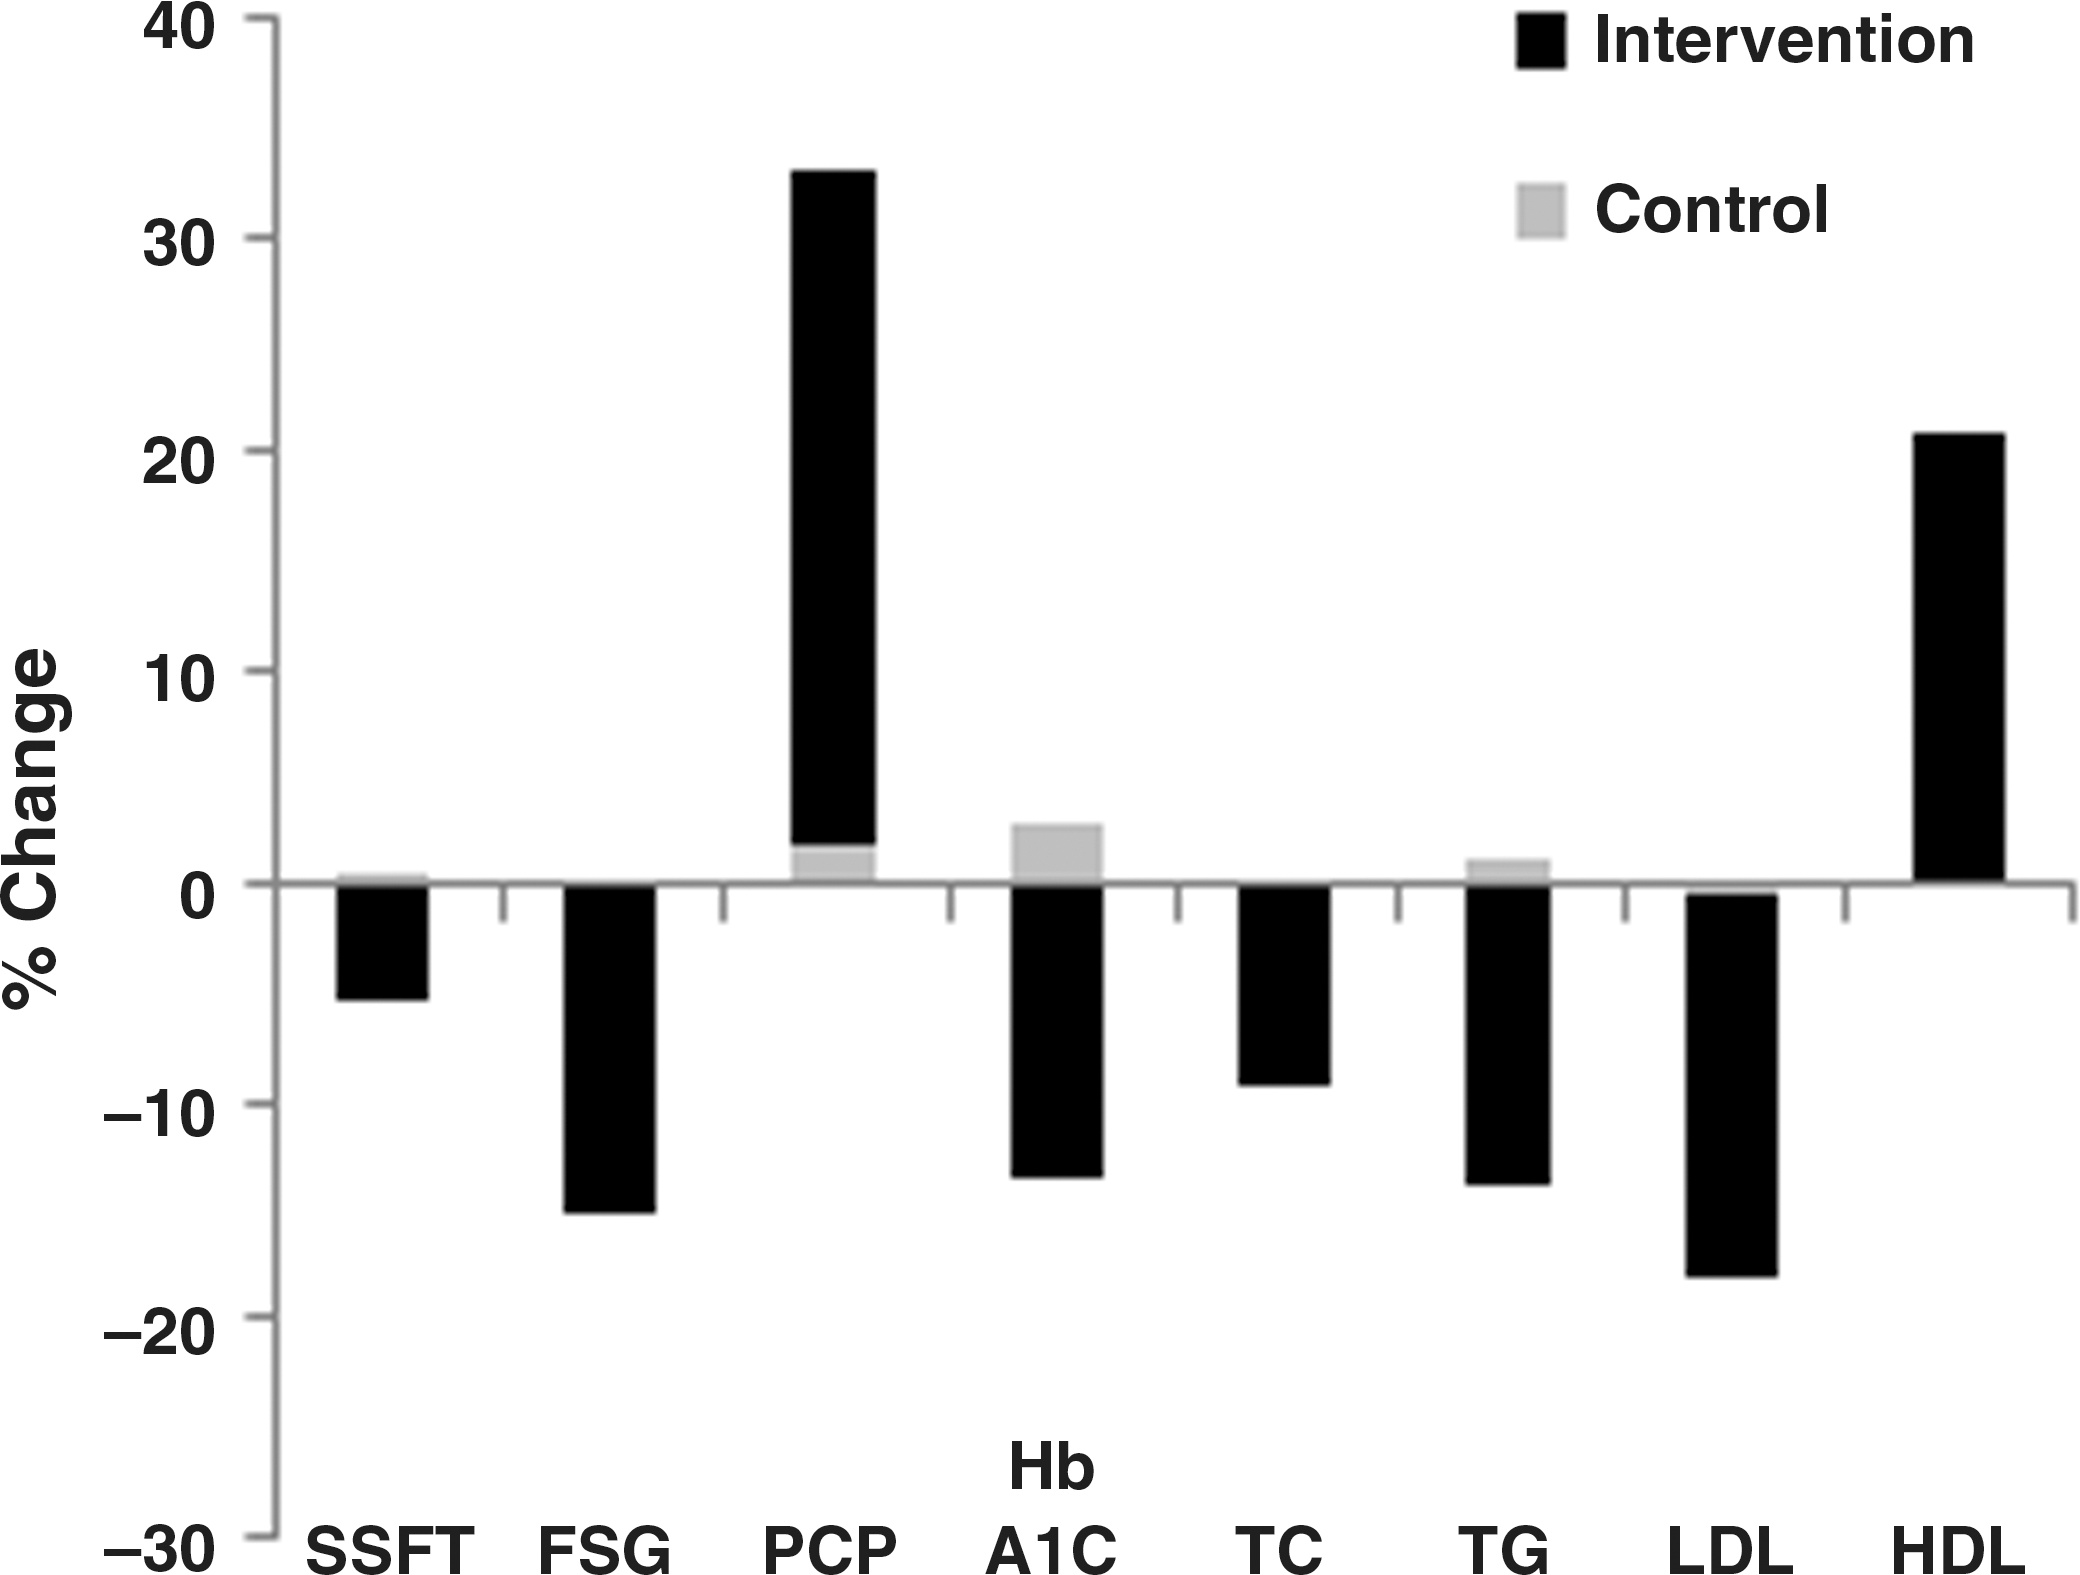
Characteristic values showing percent significant changes (P<.05) between periods 1 and 2 (intervention vs. control) in group 2 (C/I group). SSFT, subscapular skin fold thickness; HDL, high density lipoprotein cholesterol; C/I, control to intervention.
To summarize, in both groups, crossover comparison between the intervention and the control groups showed significant decreases in the FSG, TC, TG, and LDL, and significant increase in the PCP.
To test whether honey could have a long-term effect after its withdrawal, the characteristic values at baseline (0) and end point of the study (24 week) in the I/C group, where the control period followed the intervention one, were compared (Fig. 3; Supplementary Table S4). Statistically significant reductions in the MAC% (end point vs. baseline: 91.5%±8.2% vs. 98.0%±10.3%, P=.000), TSFT% (95.0%±18.0% vs. 101.5%±20.4%, P=.006), SSFT% (99.3%±14.1% vs. 106.3%±15.8%, P=.003), FSG (142.7%±26.6% vs. 169.5%±19.6%, P=.005), PSG (167.2%±24.0% vs. 210.1%±12.6%, P=.000), and TG (117.2%±20.1% vs. 144.9%±30.6%, P=.003), and significant increases in the FCP (0.4%±0.1% vs. 0.3%±0.1%, P=.002) and PCP (0.8%±0.1% vs. 0.6%±0.1%, P=.003) were observed. There was also slightly significant decrease in HbA1C (6.7%±0.9% vs. 7.6%±0.6%, P=.043).
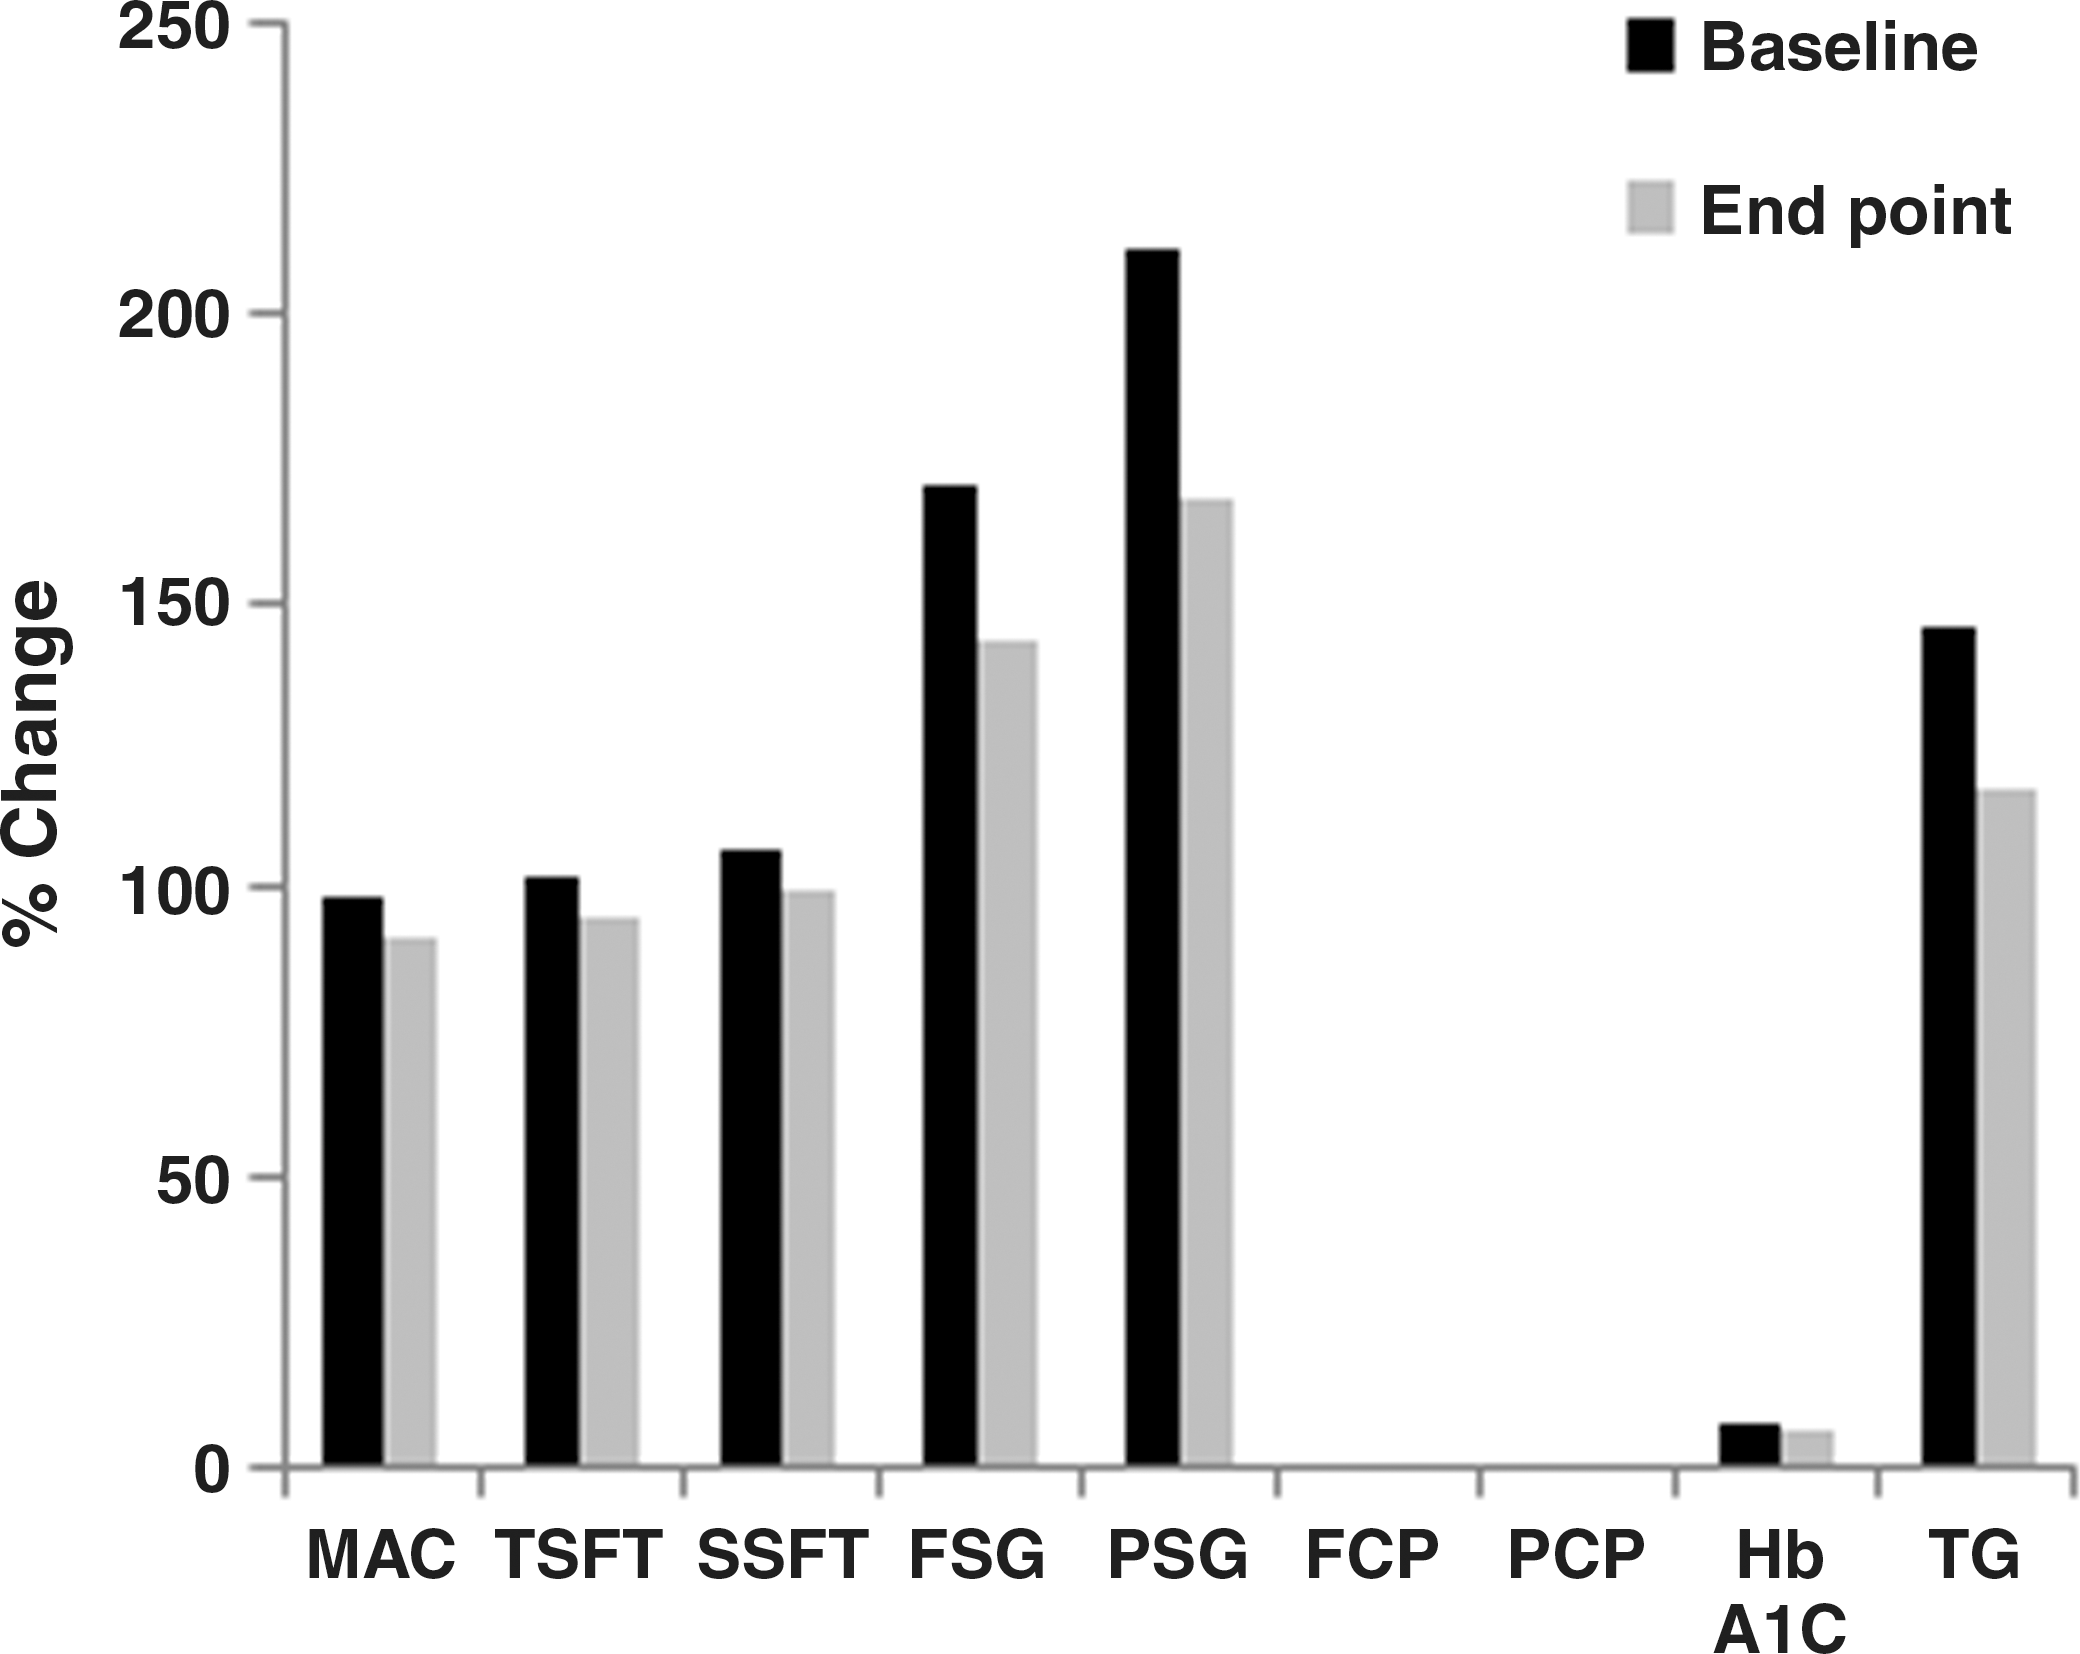
Characteristic values showing significant changes (P<.05) between baseline (0) and study end point (24 weeks) in the I/C group 1. MAC, mid arm circumference; TSFT, triceps skin fold thickness; PSG, 2-h postprandial serum glucose.
Discussion
Although this study was randomized, the baseline values of FSG, HbA1C, and serum TG were significantly higher in group 1. This may be due to the small sample size. However the crossover design of this study allowed the treatment effects to be measured not only between the different subjects in the same study period, or period 1, but also in the same subjects in a crossover comparison of periods 1 and 2. Evaluation of the changes in the characteristic values from the baseline in the intervention period (period 1) in the I/C group as the effects of intervention, found significant decrease in the SSFT%, FSG, PSG, TC, TG and LDL, and significant increase in FCP and PCP. Therefore, these changes could be explained as beneficial effects of honey intake, but since the patient's diet record and life style characteristics during the study periods have not been monitored, these changes might have occurred due to changes in diet and life style. It is also possible that these changes might be related to other factors like seasonal changes. In consideration of these possibilities, further evaluation of the differences in the change in the characteristic values between the I/C and C/I groups in period 1 (namely, intervention vs. control in different subjects) as well as between periods 1 and 2 between the I/C and C/I groups (namely, intervention vs. control in the same subjects) were done. In the I/C group, the effect and withdrawal effect of honey can be examined in each study period; therefore, comparing the changes in the characteristic values in period 1 with those in period 2 in the I/C group showed that the decreases in FSG, TC, TG and LDL, and the increases in FCP and PCP were again significant in the above analyses, indicating that, at least, these are effects of honey. Being a low glycemic index diet 5 –10,18 it may be hypothesized that the effects of long-term consumption of honey may accumulate and become more prolonged than one time consumption. A similar hypothesis was also reported for the palatinose-based formula. 12
Comparing the changes in the characteristic values in period 1 with those in period 2 in the C/I group also showed significant decreases in the SSFT, FSG, TC, TG and LDL, and significant increase of PCP. Moreover, significant decrease of HbA1C and increase of HDL occurred. It should be noted that at baseline, patients of group 2 were slightly better controlled than those in group1 (HbA1C=6.7% vs. 7.6%, respectively; P=0.043). The question: Would the beneficial effects of honey on HbA1C and HDL have appeared in patients with better-controlled diabetes? To answer this question further studies are recommended because the sample size in this study was small.
Type-1 DM may be associated with massive reduction in mass of adipose tissue. 19 Jacob et al. 20 found that subcutaneous fat area correlated negatively with HDL. Low HDL is a known cardiovascular risk factor. 21 The presence of coronary artery calcification, which is a subclinical marker of coronary vascular disease 22 and has been shown to be predictive of future clinical cardiac events, 23 was found to be positively associated with subcutaneous adiposity. 24 These findings may indicate that reduction of subcutaneous fat might be a protective or compensatory reaction in patients with type 1 DM. Since SSFT reflects the state of subcutaneous fat, 25 the reduction of SSFT observed with honey may be considered a beneficial rather than undesirable effect.
The mechanism by which honey improved lipid profile and glycemia in diabetes may be related to its unique composition. Fructose, the predominant constituent of honey, activates glucokinase, which catalyzes the conversion of glucose to glucose-6-phosphate, thereby decreasing blood glucose. 26 It was also reported that fructose stimulates insulin secretion from an isolated pancreas. 27 On the other hand, fructose, by-passing the phosphofructokinase regulatory step in glycolysis, may lead to triglyceridemia. 28 However, in rats, the hypertriglyceridemic effect of fructose was not observed when fructose was provided by honey. 29 Therefore, based on these findings and the findings of the present study, it may be hypothesized that other honey constituents may act in synergism with the fructose constituent to improve glycemia and other metabolic parameters in type 1 DM.
Among other honey constituents are flavonoids, and, as was recently reported by Najafian et al., 30 the effect of trans-chalcone on diabetes was tested in a streptozotocin-induced rat model of diabetes type 1, and the results showed significant reduction of blood glucose levels and beneficial effect on dyslipidemia. Trans-chalcone is the core structure of naringenin chalcone, located midway in the biosynthesis pathway of flavonoids. Flavonoids, as mammalian alpha-amylase inhibitors, could be useful in the management of postprandial hyperglycemia in diabetes and related disorders. 31 –33 Furthermore, flavonoid-rich fractions of plants have been reported to be effective as antihyperglycemic and antihyperlipidemic agents in animal models of diabetes. 34 –36 The flavonoid content of honey ranges from 0.015 to 3.4 mg/kg honey. 37 Another honey constituent is chromium, which was found to have significant beneficial effects on HbA1C, glucose, insulin, and cholesterol variables in subjects with type 2 DM. 38
This study also showed significant increase of C-peptide levels after 12-week honey consumption in both groups. In addition of being a good marker of insulin secretion, 39 it has been observed that patients with diabetes who had a detectable, even low, level of C-peptide are less prone to develop microvascular complications. 40 –42
Among the possible environmental factors leading to type 1 DM in genetically susceptible individuals are oxidative stress, 43 viral-induced autoimmune inflammatory insulitis, 1 and viral-induced intestinal inflammation with subsequent increased intestinal permeability. 1 Based on these hypotheses and the findings of the present study that honey increased C-peptide levels, we hypothesize that honey might help healing or activation of the diseased beta cells through its antioxidant, 44,45 anti-inflammatory, 46 antiviral 47 and probiotic 48 effects. The probiotic effect may help by reducing intestinal inflammation and permeability.
In general, this study had the following limitations: (1) it involved small number of cases and (2) the patient's diet record and life style characteristics were not monitored during the study periods. Although the sample size of this clinical trial was small, the findings that honey consumption for 12 weeks in patients with type 1 DM reduced subcutaneous adiposity, improved glycemia and lipid profile, and increased C-peptide levels, may suggest a recommendation of using honey in future therapeutic trials targeting not only the metabolic derangements but also the beta cells of pancreas in patients with type 1 DM.
Footnotes
Author Contributions and Acknowledgments
M.M.A. developed the main idea and made substantial contributions to conception and design of the study and drafting the manuscript. M.H.E.-H. made substantial contributions to selection of patients and supervising the practical work. Both R.H.A. and R.H.S. were involved in drafting and revising the manuscript. R.M.M. did the laboratory work of this study. Under supervision of the previous authors, D.M.M. and W.S.M. were responsible for patient follow-up. All authors were involved in acquisition, analysis, and interpretation of data and gave final approval of the version to be published.
We thank very much all patients and their parents for their participation in this study and their cooperation throughout the study periods.
Trial registration:
Author Disclosure Statement
All authors declare no support from any organization for the submitted work, no financial relationships with any organizations that might have an interest in the submitted work, and no other relationships or activities that could appear to have influenced the submitted work.
References
Supplementary Material
Please find the following supplemental material available below.
For Open Access articles published under a Creative Commons License, all supplemental material carries the same license as the article it is associated with.
For non-Open Access articles published, all supplemental material carries a non-exclusive license, and permission requests for re-use of supplemental material or any part of supplemental material shall be sent directly to the copyright owner as specified in the copyright notice associated with the article.
