
Abstract
In this study, a most consumer-acceptable rye bread (RB) containing saffron (S) powder (RB+S) was designed to verify its anti-diabetic properties, and to compare these effects with those of RB and S separately, matched to a similar dose of bioactive components, used in the high-fat (HF) diet in streptozotocin (STZ)-induced Wistar rats. After baking, beneficial antioxidant and sensory properties for RB enriched with 0.12% S were achieved. Twenty-four severely diabetic rats (fasting blood glucose (FBG) ≥350 mg/dL) were randomized to incorporate either 0.08% of pure S, or RB enriched with 0.12% S (the diet provided 0.08% of S), or RB alone into their diet for 5 weeks. As controls, nontreated, HF-feeding STZ-induced rats (positive control-HF/STZ) and rats receiving normal laboratory diet (negative control-C) were used. A significant FBG-lowering effect was observed (47%, 53%, and 54% reduction vs. HF/STZ; P<.05) after S, RB, and RB+S treatment. Improvements in the rats' glycemia were achieved by β-cell regeneration and increases in insulin secretion. Only in the S and RB+S group of rats, a significant (P<.05) increase in relative pancreas (vs. HF/STZ) was noted. A significant (P<.05) reduction in the concentration of thiobarbituric acid-reactive substances (TBARS) was achieved, whereas the ferric-reducing ability of plasma (FRAP) was not changed after S, RB and RB+S treatment (vs. HF/STZ). Triglyceride (TG) concentrations after S, RB, and RB+S treatment were significantly decreased (P<.05) versus HF/STZ. Both S and RB can be used in diabetic therapy, but no additional metabolic effect was achieved after consumption of RB+S.
Introduction
D
Today's modern foods, besides their major functions of providing necessary nutrients for humans, may also prevent nutrition-related diseases and improve the physical and mental well-being of consumers. 11,12 Such food products are referred to as “functional foods.” 12 Bakery products are consumed all over the world, and so, these products are an ideal vehicle through which functionality can be delivered to the consumer in an acceptable food. 13 It would, thus, be beneficial to design a rye bread (RB) with S extract, which might play a protective or therapeutic role against hyperglycemia and diabetes mellitus. It is, however, important to develop a functional bakery product with both physiological effectiveness and consumer acceptance of its appearance, taste, and texture. 13
Therefore, in this study, a consumer-acceptable RB+S was designed, in order to verify its anti-diabetic properties, and to compare these effects with those of SB and S alone, matched for a similar dose of bioactive components, used in high-fat (HF) diets in STZ-induced rats.
Materials and Methods
S extract
For the experimental treatment, dry S powder (Saffr'Activ®) extracted from S stigma (Crocus sativus) was purchased from Green Plants Extracts (GPE; Asnières-sur-Seine, Paris, France). The extract contained 2% safranal, as specified by the supplier.
RB preparation
Bread samples were prepared using a two-phase method, according to the method described by Bajerska et al. 14 Test RB samples were prepared with 0 (control), 0.08, 0.12, and 0.16 g S powder per 100 g flour, and in this way, the following samples of bread were produced: control RB (C), 0.08%, 0.12%, and 0.16% RB, respectively. After 1 day of storage in a haversack at ambient temperature, the bread was subjected to instrumental measurements and sensory tests. The samples of RB were mechanically cut into slices of 10 mm thickness with a bread slicer (Zelmer, Rzeszow, Poland). The central part of the slices was lyophilized (Heto, Thermo Fisher Scientific, Waltham, MA, USA), ground, and stored at −20°C for polyphenol and antioxidant activity analyses.
Extraction of S polyphenols from bread crumbs
Phenolic compounds were extracted from bread crumbs using a method described by Wang and Zhou, 15 with slight modifications. 14
Total polyphenol contents in breads
The level of total polyphenols (TP) in each bread was determined, and the results were expressed as catechin equivalents (CE) in mg/g of RB, according to the method of Singleton and Rossi. 16
Total antioxidant activities in breads
The antiradical efficiency was evaluated according to the method described by Benzie and Strain. 17 The results were expressed as ferrous joins [FeII equivalents (FeII)] in mM FeII per g of dry starting material.
Color assessment
Using a CR-10 colorimeter (Konica Minolta, Japan), color intensity was measured and expressed as L*a*b* values, where L* represents the lightness of the color, a* represents red (positive value) and green color (negative value), while b* defines the proportion of yellow (positive value) or blue color (negative value). The analysis cited earlier was carried out in twenty replicates.
Sensory evaluation
Sensory analysis was performed by the sensory panel consisting of ten well-trained people according to the method described earlier. 18 Eight attributes—volume, texture, color of crumb, taste, overall acceptance, typical aroma of freshly baked breads flavor, sharp flavor, and phenolic flavor—were selected according to a list of standardized lexicon of terms for bread evaluation. 19
Experimental animals
Thirty 8-week-old male Wistar rats with initial body masses ranging from 210 to 283 g were obtained from the Department of Toxicology at the Medical University of Poznan, Poland. The animals were kept in individual cages in a temperature-controlled room at 22±2°C, with 50±5% humidity and a 12-h dark/12-h light cycle. The rats were fed a chow diet (Labofeed B), purchased from Labofeed (Andrzej Morawski Feed Production Plant, Kcynia near Bydgoszcz, Poland), and with tap water ad libitum for 1 week before the experiment. All animals were humanely treated in accordance with the World Health Organization's guidelines for animal care, and the animal study design was approved by the Local Bioethical Committee on Animal Research at the Department Animal Physiology and Biochemistry, Poznan University of Life Sciences (no. 46, July 2007).
After a 7 day adaptation period, the animals were fed a HF diet (25% as fat) composed on the basis of the AIN-93G diet, where wheat starch was replaced by fat (lard 15% and sunflower oil 10%).
Induction of diabetes in rats
After 5 weeks of feeding on the HF diet, the rats (except the negative control rats, which to the end of the experiment were fed on the normal laboratory diet, AIN-93G; C, n=6) were intraperitoneally injected with STZ (40 mg/kg body weight [bw] in citric buffer, pH=4.5) in order to induce diabetes. After a period of 3 days, blood drops were taken from the tail vein and were placed on test strips to measure blood glucose concentration (Optium Medisense glucometer; Abbott Co., Almeda, CA, USA), to check for hyperglycemia. All STZ-treated animals (n=24) were classified as “severely diabetic” (fasting blood glucose [FBG] level ≥350 mg/dL).
Experimental plan
The diabetic animals were divided into four groups of six each. Group 1: STZ-induced rats were fed an HF diet as a positive control (HF/STZ; n=6). Group 2: STZ-induced rats were fed an HF diet enriched with pure S at a level of 0.08%; in addition, in this experimental diet, cellulose was added in a quantity of 7.0% (S; n=6). Group 3: STZ-induced rats were fed an HF diet enriched with RB (RB; n=6). Group 4: STZ-induced rats were fed an HF diet with RB fortified with 0.12% S (RB+S; n=6). It should be noted that the composed diets (S and RB+S) provided 0.08% of S; moreover, composed diets (S, RB and RB+S) provided ∼7.0% of dietary fiber (Table 1).
The individual ingredients of the diet are as follows: caseine (Lacpol, Gdynia, Poland); wheat starch (Hortimex Plus, Konin, Poland); L-cysteine (Sigma Chemical Co., St Louis, MO, USA); and sucrose, sunflower oil, lard, and cellulose were purchased from a local supermarket.
The mineral mix contained the following components (per gram mineral mix): sodium chloride, 259 mg; magnesium oxide, 41.9 mg; magnesium sulfate, 257.6 mg; chromium potassium sulfate, 1.925 mg; cupric carbonate, 1.05 mg; sodium fluoride, 0.2 mg; potassium iodate, 0.035 mg; ferric citrate, 21 mg; manganous carbonate, 12.25 mg; ammonium molybdate, 0.3 mg; sodium selenite, 0.035 mg; zinc carbonate, 5.6 mg (individual ingredients of the mineral mix were purchased from Sigma Chemical Co).
The vitamin mix contained the following components (per gram vitamin mix): retinyl acetate, 0.8 mg; cholecalciferol, 1.0 mg; DL-α-tocopheryl acetate, 10.0 mg; menadione sodium bisulfite, 0.05 mg; biotin, 0.02 mg; cyanocobalamin, 1 mg; folic acid, 0.2 mg; nicotinic acid 3 mg; calcium pantothenate, 1.6 mg; pyridoxine-HCl, 0.7 mg; riboflavin, 0.6 mg; thiamin HCl, 0.6 mg (individual ingredients of the mineral mix were purchased from Sigma Chemical Co).
Saffron powder standardized to 2% safranal was purchased from Green Plants Extracts (GPE, Asnières-sur-Seine, Paris, France)
C, control diet (AIN-93G);20 HF, high-fat diet; S, high-fat diet enriched with 0.08% pure saffron powder; RB, high-fat diet enriched with rye bread; RB+S high-fat diet enriched with rye bread fortified with 0.12% saffron powder.
The 0.12% level of S powder used to fortify the RB was chosen on the basis of sensory, color, and antioxidant evaluation. The breads used to prepare the animal diet were lyophilized and powdered. Each ingredient in the diet was weighed (within 0.5% of the amount needed) and mixed. The mixture was then formed into equally sized pellets and placed into a temperature and humidity controlled room, to remove the moisture from the pellets. The rats received water and pellets ad libitum. The food consumption of individual rats was checked every day, by measuring the differences between the amount of diet supplied each day and the amount of diet remaining. Body mass was measured every 7 days using an electronic balance. At the end of the study (day 35 of the experiment), and after 16 h of starvation, the animals were weighed and euthanized by an intraperitoneal injection of thiopental (40 mg/kg bw). They were dissected to collect blood from the hearts for future biochemical studies and to harvest and clean their internal organs (liver, pancreas, and visceral fat). Blood samples were collected into clean test tubes containing EDTA, centrifuged (3500 g for 10 min, 4°C), and stored at −20°C for determination of the total cholesterol (TC), TG, FBG, Fasting blood insulin (FBI) level, and leptin level.
Biochemical parameters estimation
TC and TG concentrations were determined by colorimetric methods 21,22 using an Olympus AU 560 analyzer (Olympus Japan, Tokyo, Japan). FBG concentrations were measured using the hexokinase method implemented on an Olympus AU 2700 clinical chemistry analyzer system. FBI levels were measured in the plasma samples by specific radioimmunoassay (RIA; RI-13K Rat Insulin RIA Kit, Millipore Corporation, St. Charles, MO, USA), according to the manufacturer's protocol. β-cell function was estimated using the homeostasis model assessment (HOMA), according to the following formula: HOMA-%β=(20×FBI)/(FBG×3.5), where FBI is fasting blood insulin concentration (mIU/dL) and FBG is fasting blood glucose (mM). 23
Determination of the oxidative status of plasma
The total antioxidant activity (TAA) of the plasma was measured by the FRAP assay of Benzie and Strain, 17 with slight modifications by Janaszewska and Bartosz. 24 FRAP values were expressed as μM.
Lipid peroxidation in plasma was determined by the formation of TBARS, as described by Buege and Aust. 25 TBARS values were presented as μM.
Dietary fiber and energy value determination
Total dietary fiber contents in the rat's diet was established by a method described by Asp et al. 26 The energy value of diet was assessed by bomb calorimetry (Calorymetr KL-11 Microprocessor System “Mikado”, Precyzja Company, Bydgoszcz, Poland).
Statistical analysis
Each datum was presented as a mean±SD. The difference between the group means was compared using 1-way analysis of variance (ANOVA). If a significant F ratio was obtained, Tukey's HSD (Honestly Significant Difference) was used to identify differences between means.
All data were analyzed using Statistica Software (version 8.0; Statsoft, Inc., Tulsa, Oklahoma, USA). Differences between groups were considered significant at P<.05.
Results
Figure 1 shows the results of L*, a*, and b* values evaluated on crumbs of the RB samples.
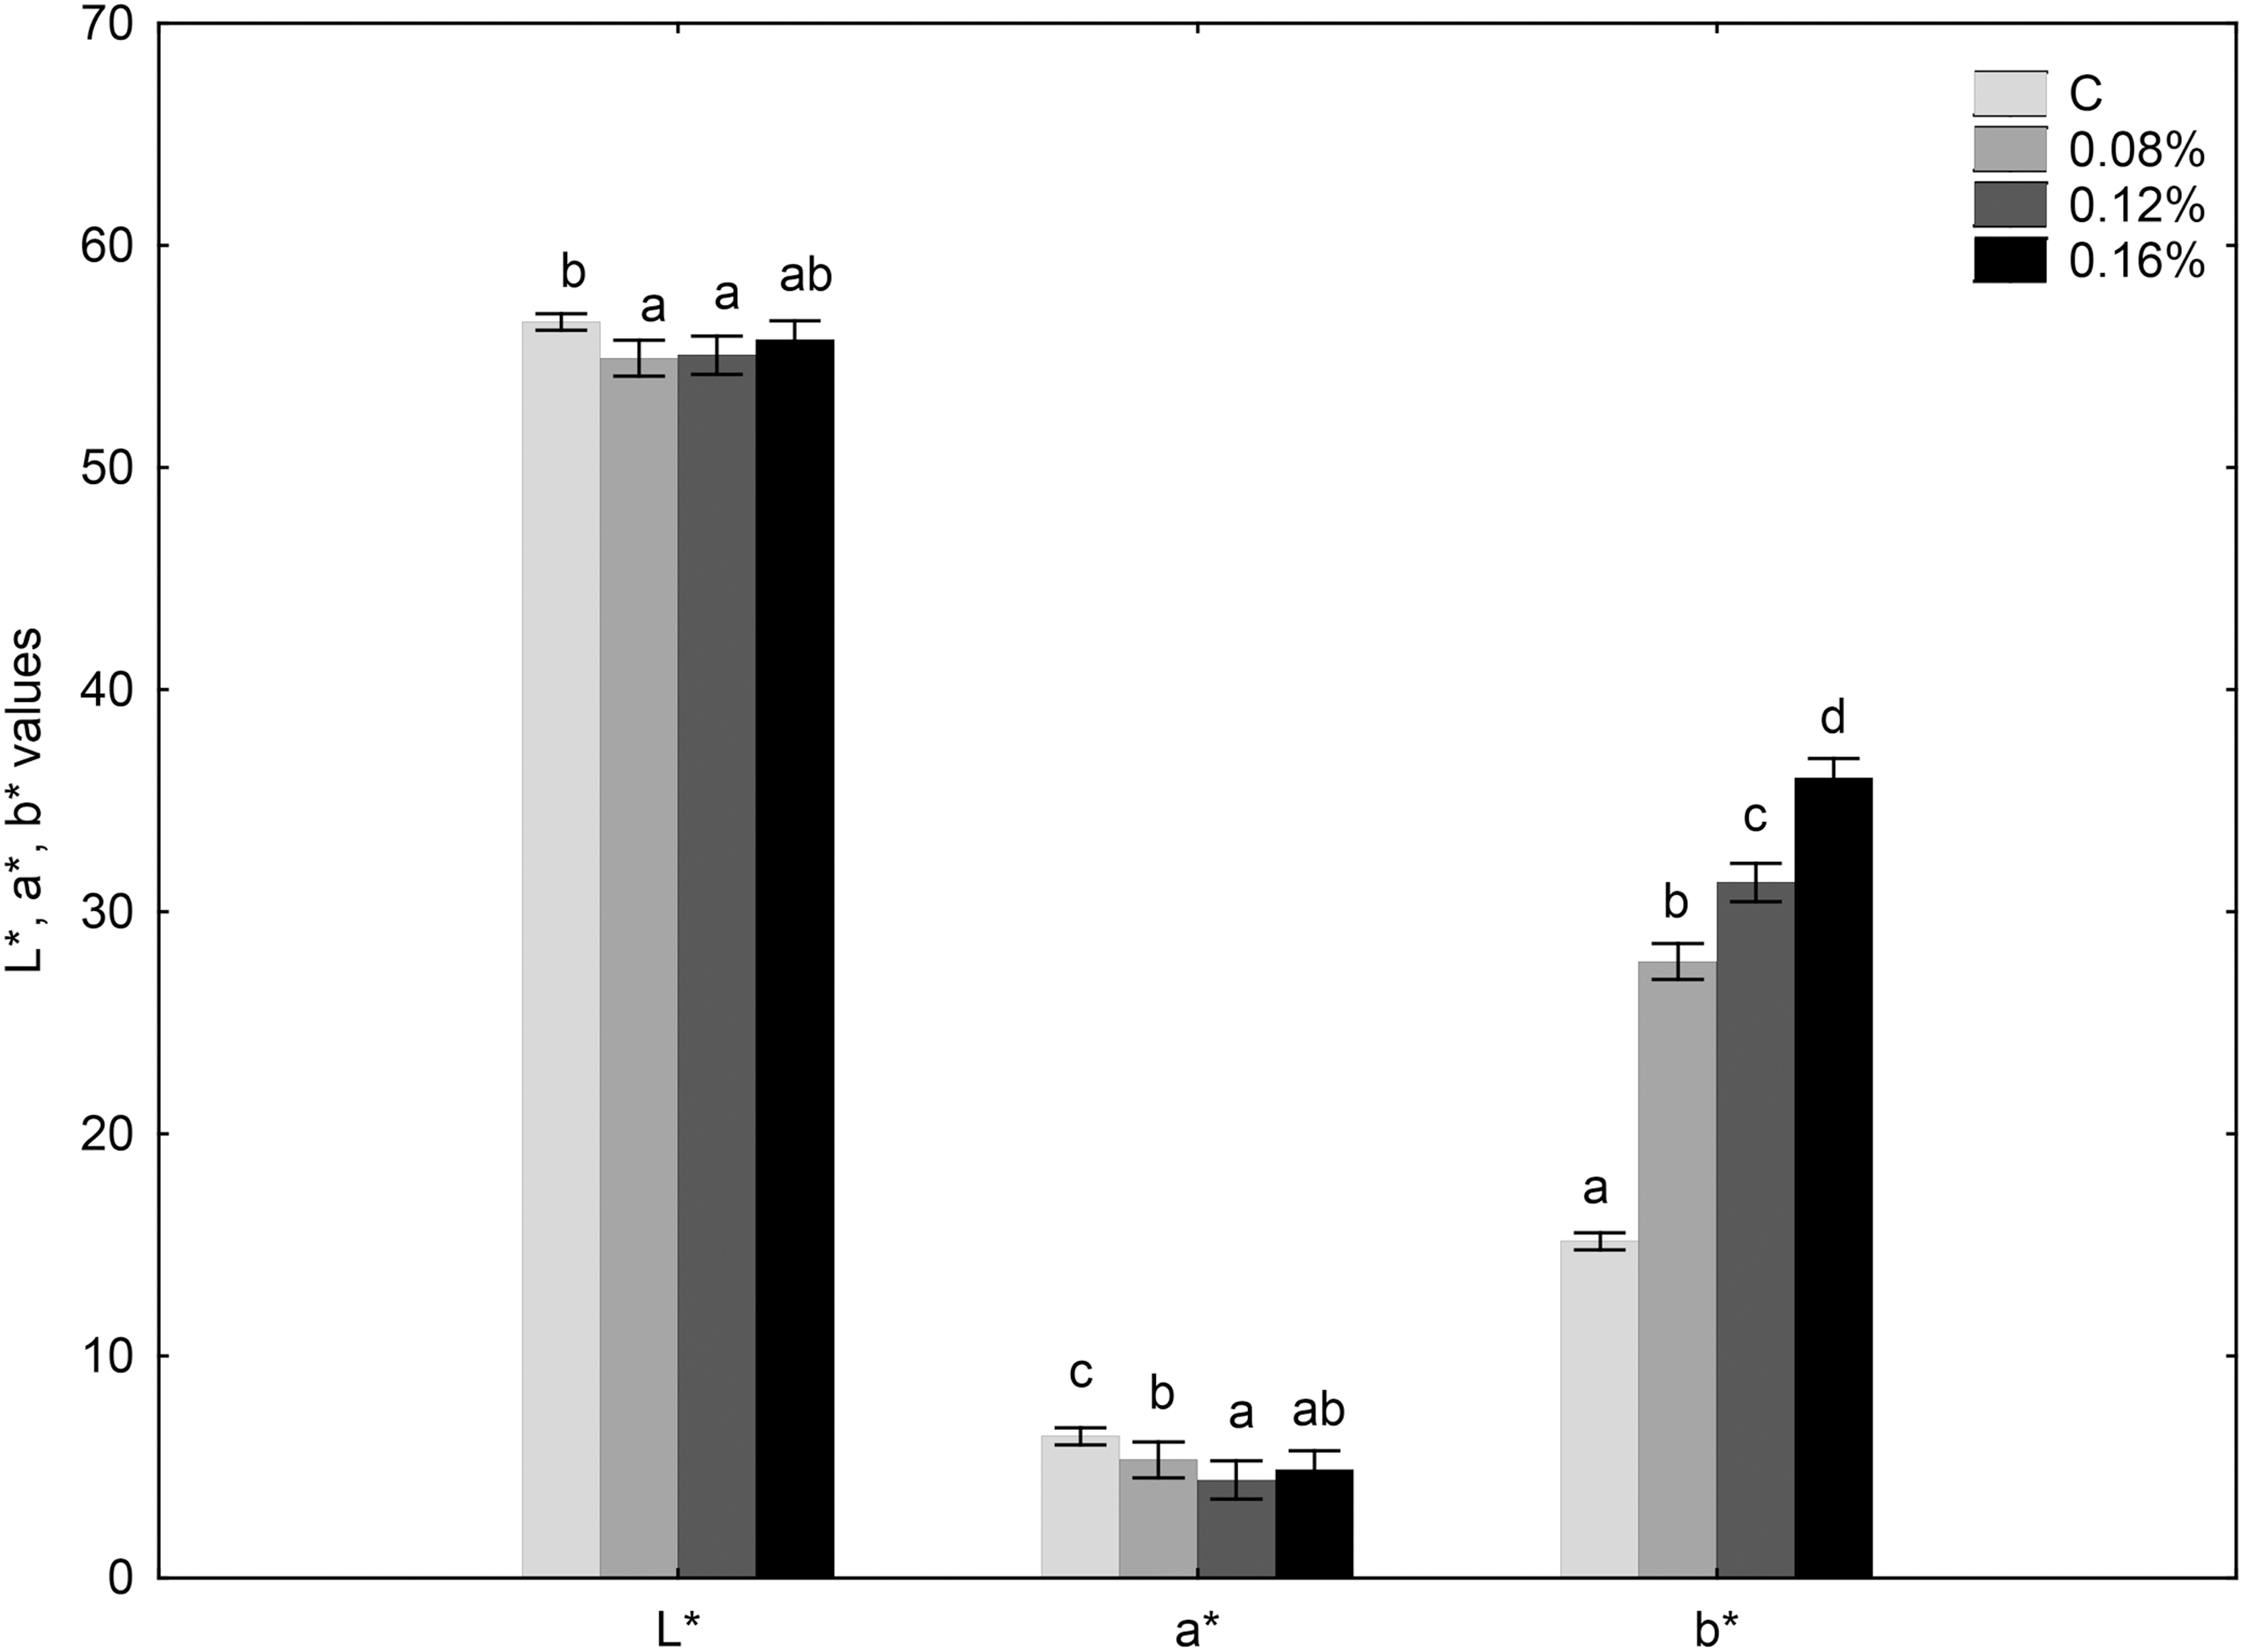
Influence of saffron powder quantity on crumb rye bread color parameters (L*, a*, b*). Values are means of twelve determinations±SD. abcdMeans with different letters differ significantly at P<.05.
In the color analysis, the obtained data indicate that yellowness in particular (b* value) varied significantly and proportionally with the amount of S powder added. In addition, the addition of 0.08% and 0.12% (but not 0.16%) of S powder to RB led to significant darkness in this bread. The redness (a* value) of the analyzed bread samples varied significantly and proportionally up to addition of 0.16% S powder, in comparison with the control.
The attractiveness of the control and enriched breads was investigated with regard to their sensory properties. Data from the sensory profiles of breads with different levels of S powder and from the control samples are shown on the histogram in Figure 2. The data displayed are the descriptors of volume, texture, crumb color, taste, and overall acceptance, as well as aroma descriptions (freshly baked bread, sharp, or phenolic aroma).
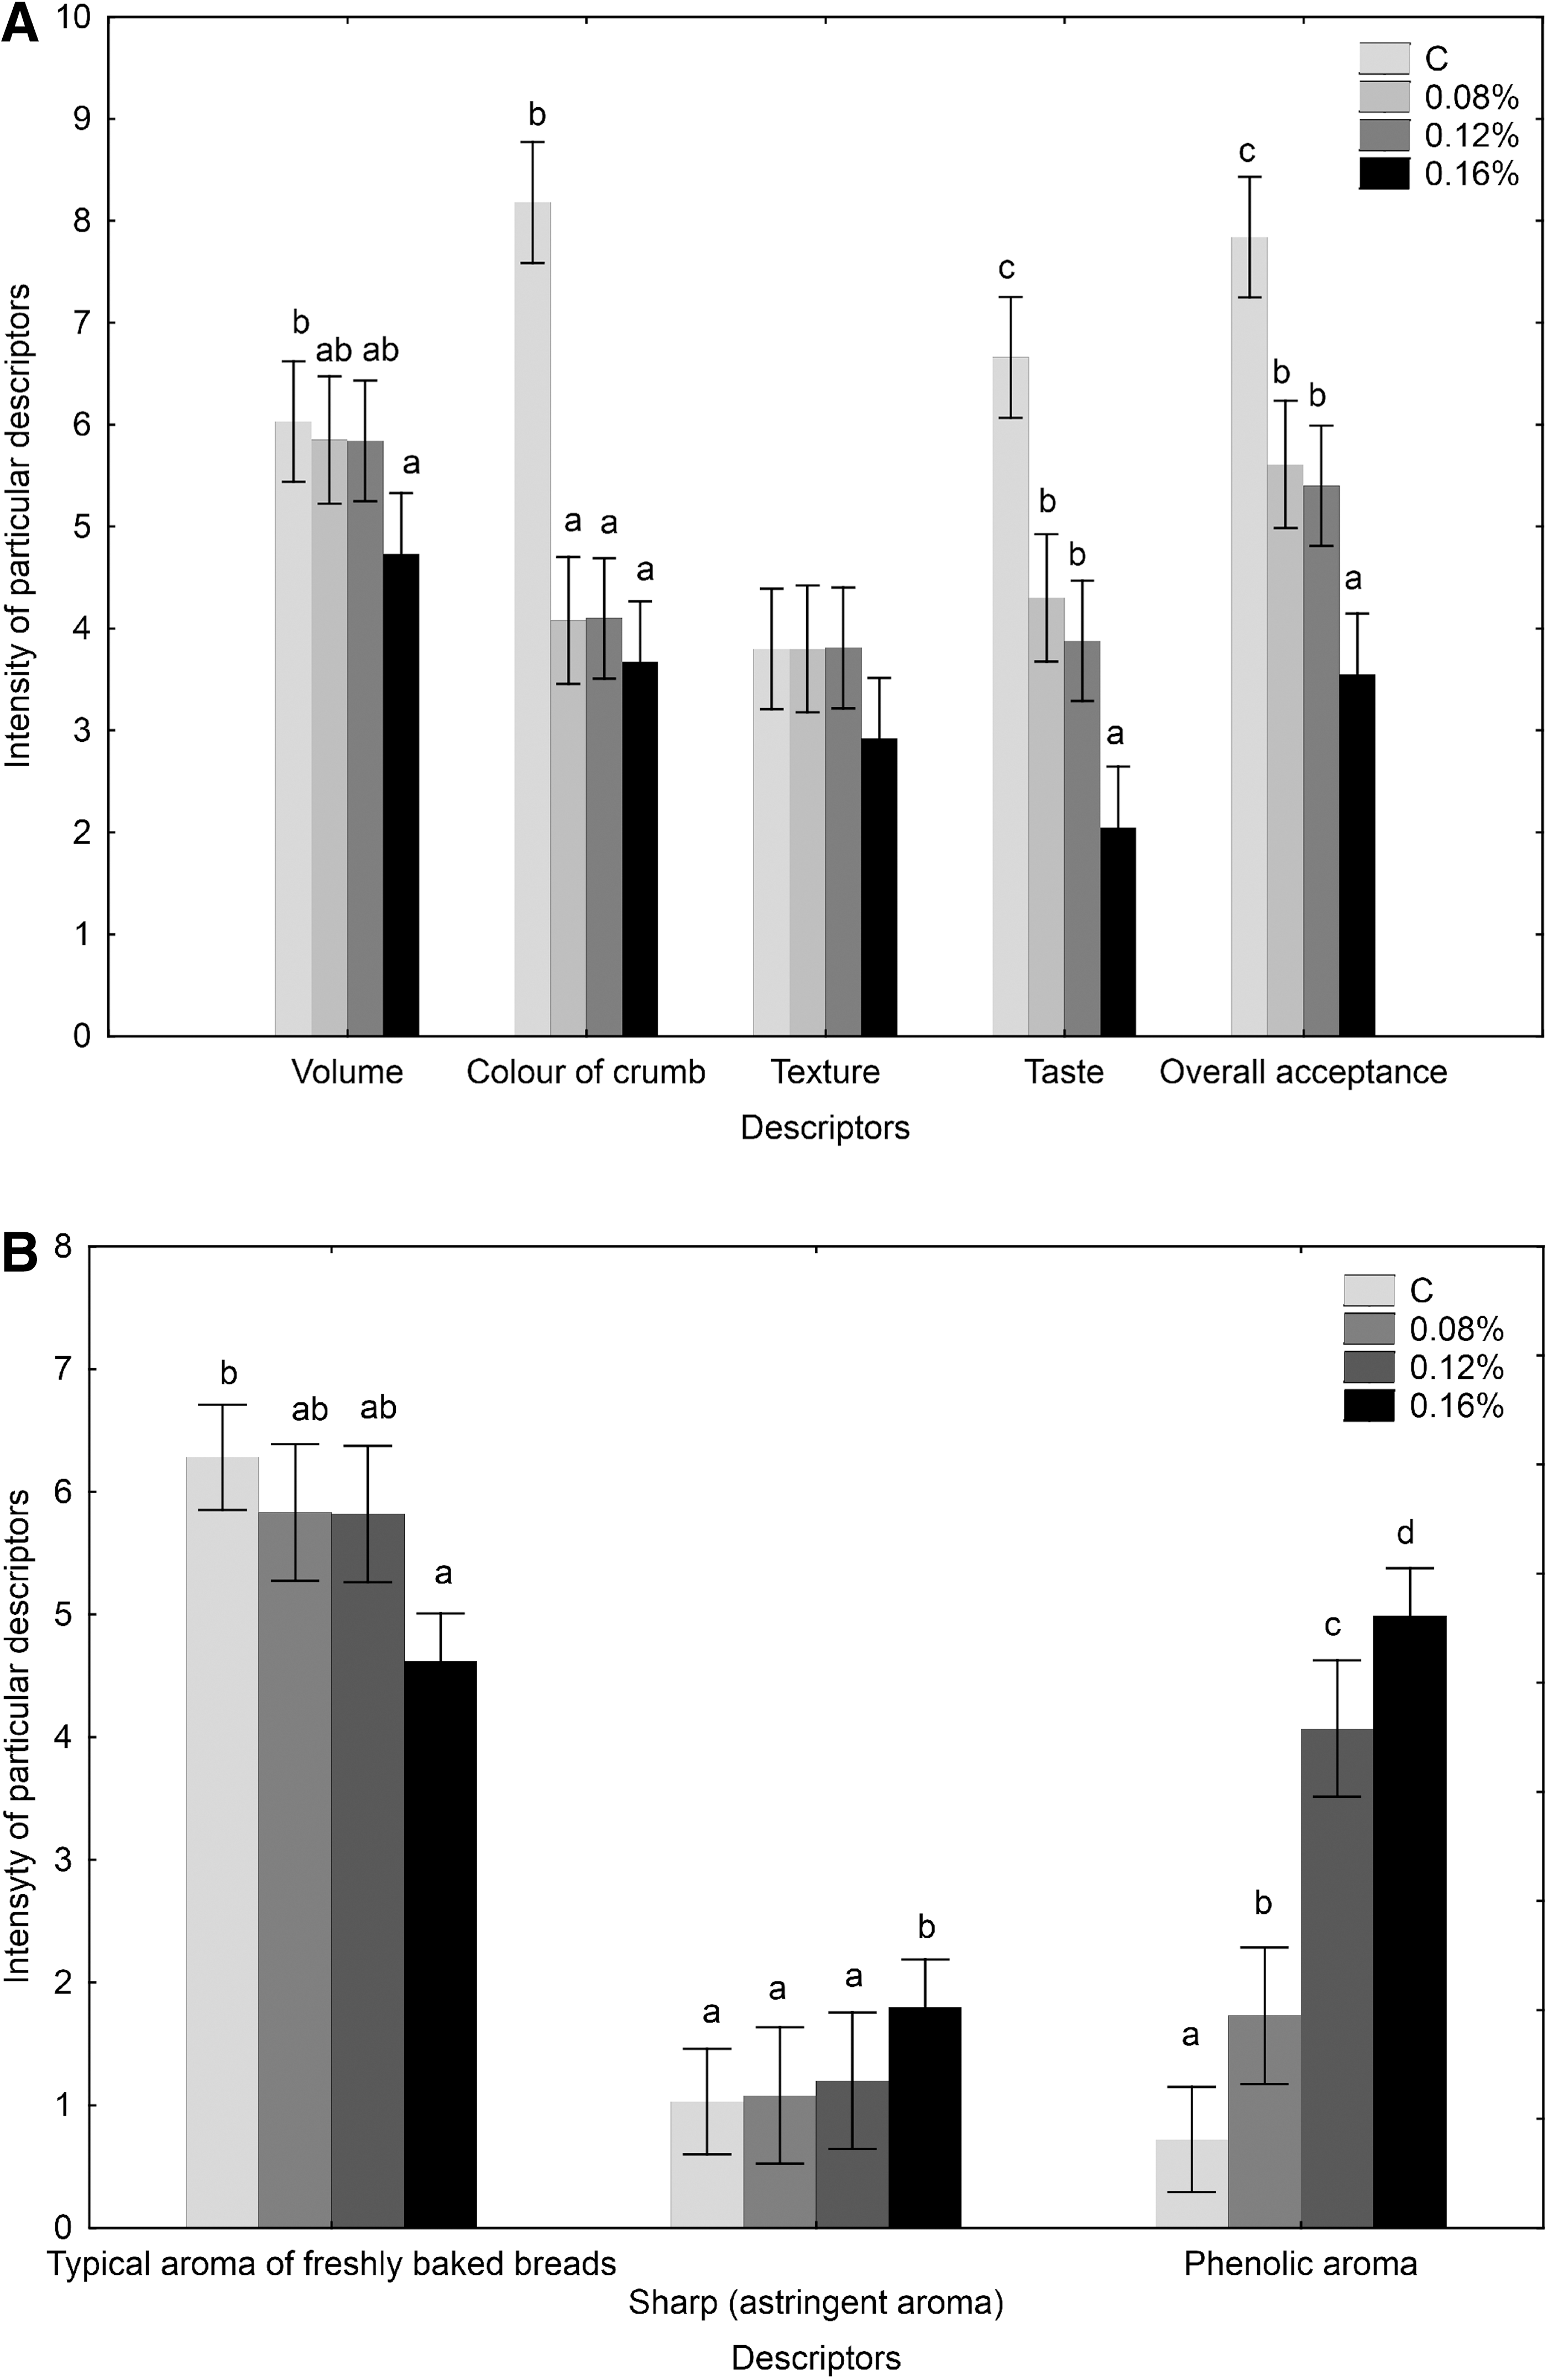
Statistically significant differences in the bread volumes were found only between the control bread and the bread with 0.16% addition of S powder (P<.05). Insignificant differences in texture were observed between all experimental breads. The best color of crumb bread was observed in case of the control bread (without S powder). The addition of S extract at the levels of 0.08%, 0.12%, and 0.16% worsened the color of all the breads. The addition of the highest amount of S powder (0.16%) to the bread formula did not interfere positively with the bread's acceptability, as compared with the 0.08% bread, the 0.12% bread, and the control bread. It is important to note that both 0.08% and 0.12% S powder bread samples were moderately acceptable (0.08%: 5.61±0.94; 0.12%: 5.40±0.96). The control bread had the best odor in terms of the typical aroma of freshly baked breads, and the addition of 0.16% S powder to the bread formula significantly decreased this aroma. A statistically significant difference (P<.05) in sharp (astringent) odor was found between the bread with 0.16% addition of S powder and control bread, as well as between the breads with the 0.08% or 0.12% addition of S powder and the bread with 0.16%. Phenolic odor increased proportionally with the S powder added to the experimental bread.
As shown in Table 2, both the TP and TAA of the experimental breads increased gradually and significantly with increasing S-powder level. TP in four types of bread ranged from 1.6±0.04 to 2.6±0.03 mg CE/g dry weight (dw) for the control and 0.16% RB+S, respectively; whereas TAA in bread samples ranged from 5.5±0.12 to 9.3±0.31 mg of Trolox/g dw for the control and RB+S, respectively.
Values of TP and TAA are means±SD (n=3).
Different lowercase letters within the same column indicate significant differences among the different percentages of saffron powder (P<.05).
TP, total polyphenols; TAA, total antioxidant activity.
The overall growth indices of the experimental animals are presented in Table 3. The average daily food intake was significantly higher (P<.05) in rats fed a normal laboratory diet, in comparison with the control of STZ-induced group of rats and rats treated with S, RB, or RB+S. Only the body mass/length ratio in nontreated diabetic rats was significantly lower, as compared with rats fed the normal laboratory diet. Visceral fat content in all experimental groups of rats was not different. Only a considerably lower (P<.05) relative liver mass was observed in untreated STZ-injected rats (2.7±0.3 g/100 g bw), in comparison with the other treated diabetic groups of rats. Treatment with either S powder or RB enriched with S powder led to increases in relative pancreas mass (S: 0.32±0.03 g/100 g bw; RB+S: 0.32±0.03 g/100 g bw) in comparison with nontreated diabetic rats (0.26±0.03 g/100 g bw).
Values are means±SD.
Values with different superscript letters are significantly different (P<.05).
C, control group of rats fed normal laboratory diet (n=6); HF/STZ, high-fat-fed/STZ-induced rats (n=6); S, high-fat-fed/STZ-induced rats supplemented with 0.08% saffron powder (n=10); RB, high-fat-fed STZ-induced rats fed with rye bread (n=6); RB+S, high-fat-fed STZ-induced rats consuming rye bread containing saffron powder (n=6).
The effect of S powder, RB, or S powder-enriched RB on the percentage of pancreas β cells, FBI and FBG, TC and TG, TBARS, FRAP, and leptin levels was determined by a comparison with rats fed the normal laboratory diet and untreated control STZ-induced rats, as shown in Table 4 and Figure 3.

FBG levels in STZ-induced diabetic rats treated with S, RB, or RB+S. FBG, fasting blood glucose: FBG levels were measured in the serum of control (C) rats fed a laboratory diet (averaged over the experimental period; –♦–); HF/STZ, high-fat-fed STZ-induced rats, n=6 (); S, high-fat-fed STZ-induced rats supplemented with 0.08% pure saffron powder, n=6 ( ); RB: high-fat-fed STZ-induced rats consuming rye bread, n=6 (
 ); RB+S, high-fat-fed STZ-induced rats consuming rye bread fortified with 0.12% saffron powder, n=6 (
 ). Analysis was carried out post-STZ injection and after 5 week of treatment. Values are expressed as means±SD represented by vertical bars. *Mean value was significantly increased compared with rats fed a normal laboratory diet (P<.05). ±Mean value was significantly decreased (P<.05) compared with nontreated diabetic rats after 5 weeks of experimental period.
Values are means±SD.
Values with different superscript letters are significantly different (P<.05).
HOMA-%β, homeostasis model assessing β-cell function; FBI, fasting blood insulin; TBARS, thiobarbituric acid reactive species; FRAP, ferric-reducing ability of plasma; TC, total cholesterol; TG, triglycerides; C, control group (n=6); HF/STZ, high-fat-fed STZ-induced rats (n=6); S, high-fat-fed STZ-induced rats supplemented with 0.08% saffron powder (n=6); RB, high-fat-fed STZ-induced rats consuming rye bread (n=6); RB+S, high-fat-fed STZ-induced rats consuming rye bread containing saffron powder (n=6).
Treatment with S powder, RB, or S powder-enriched RB led to improvements in β-cell function in the STZ-induced rats. The percentage of β-cells significantly increased (P<.05) from 2.9±1.2% in STZ-induced control rats to 8.2±2.0% in the group of diabetic rats treated with S powder 10.3±4.2%, and to 11.1±5.9% in both the RB and RB+S group of rats, respectively. Incorporation of S, RB, or RB+S into the HF diet led (by pancreas β-cells regeneration) to significantly (P<.05) increased blood–insulin levels in comparison to the control STZ-induced rats. However, FBI levels noted in three treated groups of rats were still significantly lower than those observed in rats fed a normal laboratory diet (Table 4).
It is clear that the STZ injection led to increases in the FBG levels of rats, compared with the negative control rats (Fig. 3). After 5 weeks of HF feeding, FBG in STZ-induced diabetic animals minimally increased (from 380.1±19.7 mg/dL to 397.0±47.5 mg/dL). In contrast, the S powder, RB, or S powder-enriched RB incorporated into the high fat diet led to significantly (P<.05) reduced FGB levels after 5 weeks of treatment (by 45%, 51.2%, and 53.1% respectively) when compared with the control STZ-induced diabetic rats. In addition, 5 weeks of treatment with RB or S powder-enriched RB led to normalization of FBG (as compared with rats fed a normal laboratory diet).
The TBARS concentration in plasma of the STZ-induced rats fed a HF diet enriched with S powder, RB, or RB enriched with S powder decreased significantly (S: 5.8±0.9 μM; RB: 5.0±0.1 μM; RB+S: 5.5±0.7 μM) compared with the corresponding nontreated diabetes rats (26.9±4.4 μM). Treatment with S, RB, or RB+S shows a tendency to increase antioxidant power (indicated by the FRAP value) in rats' serum in comparison with the control STZ-induced rats, but this difference is not significant. No differences in TC or leptin concentration were observed between experimental groups. Only a significant decrease in TG level in the three treated groups of rats was detected (S, RB, RB+S), in comparison with the nontreated diabetic STZ-induced rats.
Discussion
Functional plant-based foods that contain bioactive components may provide desirable health benefits beyond basic nutrition, and are useful in practice for the prevention of chronic diseases, such as obesity, diabetes, and cardiovascular diseases. 27 It seems that S, the most expensive spice in the world, used in a small amount as a spice, yellow food coloring, and a flavoring agent, may be a functional plant. In scientific literature, it has been reported that S possesses many biologically active properties, including antioxidant, anti-inflammation, anti-diabetic, and cardioprotective properties. 8 In the last decade, interest has grown in designing functional food products in which the vehicles used to deliver the bioactive constitutes are widely consumed food products, such as bread. 13 To our knowledge, information is scanty regarding the effects of S powder on RB's physical and antioxidant properties, the influence of this functional bread on consumer acceptability, and the anti-diabetic effect.
In this study, four RB samples with 0%, 0.08%, 0.12%, and 0.16% S powder were prepared.
After baking, the RB enriched with 0.16% S powder was characterized by crumb color of the highest yellowness and of moderate darkness, and by the lowest value of overall acceptability in sensory analysis. Both the TP and TAA of the experimental breads increased gradually and significantly with the increasing S powder level: TP from 2.2 to 2.6 mg CE/g dw and TAA from 5.5±0.12 to 9.3±0.31 mg of Trolox/g dw for the control and for RB enriched with 0.16% S powder, respectively. It, thus, seems that a dose of 0.12% S powder could be maximally included in the bread formula in order to avoid altering consumer acceptability when verifying its health-giving properties against diabetes in in vivo animal studies. On the other hand, our functional product may be still identified as polyphenol rich, because in comparison with the study conducted by Balestra et al., 28 in which wheat bread formula was enriched with 6% ginger powder, almost a four-fold lower polyphenol content in the crumb was achieved in comparison with amounts of polyphenol levels obtained in our study.
Streptozotocin (STZ) has been widely used to induce type 1 diabetes in animal models, especially rats and mice. 29 The present investigation shows that the action of STZ on β cells is accompanied by characteristic alterations in blood insulin and glucose concentrations. Previous studies suggest that treatment with S extract or its active constituents ameliorates the diabetogenicity of both alloxan and STZ in animals. 9,27,30 Moreover, in the last decade, consumer interest in foods that provide health and wellness benefits has increased. Therefore, in this study, the most consumer-acceptable RB +S was designed to verify its anti-diabetic properties, and to compare these effects with those of RB and S alone, matched to a similar dose of bioactive components, used in the HF diet in STZ-induced rats.
However, in our investigation, it was shown that treatment with S powder, RB containing S powder, or RB alone significantly promoted pancreas β-cell regeneration in the STZ-induced rats, in comparison with nontreated diabetic rats. In line with this phenomenon, a significant increase in the secretion of plasma insulin in these three treated group of rats was observed, as compared with nontreated diabetic rats. After treatment, the fasting blood–glucose levels in rats treated with S powder, RB, or RB enriched with S powder significantly decreased (47%, 53%, and 54% reduction, respectively) in comparison with nontreated rats. In addition, 5 weeks of treatment with RB or S powder-enriched RB led to normalization of serum fasting glucose levels compared with normal feeding rats. El Daly et al. 31 observed a greater decrease in the blood glucose of rats treated intraperitoneally with 50 mg/kg bw S extracts and cisplatin, in comparison with rats treated with cisplatin alone. Fernandez 32 suggested that this may be related to an increase in insulin levels mediated by pancreatic dysfunction. However, Mohajeri et al. indicated that a dose of 40 mg/kg was found to be more effective in the intraperitoneal route for decreasing blood glucose level in alloxan-diabetic rats, in comparison with the higher dose of 80 mg/kg ethanolic S extract. 9 The authors explained that the larger dose of S powder could not produce the expected higher hypoglycemic effect on account of the presence of some other substances in the ethanolic extract which interfere with the hypoglycemic effect. However, in our study, we decided to use the dose of S powder (0.08%) corresponding to the higher dose of S powder used in Mohajeri et al. study. 9 The decision to use 0.08% S extract and the corresponding similar dose of S powder added to RB formula was made, because we expected that part of the active contents of S might be degraded during the baking process. According to Asami et al., baking or drying at temperatures above 60°C is regarded as unfavorable, due to the possibility of inducing oxidative condensation or decomposition of thermolabile compounds, such as phenolics. 33
It should be also mentioned that consuming RB has beneficial effects on glucose and insulin metabolism. 34 Adam et al. reported that dietary fiber intake, especially from whole grain sources, reduces serum glucose levels and leads to reduced risk of coronary heart disease and diabetes. 35 The RB used in the current investigation contained ∼7.0% dietary fiber. In addition, Fardet indicated that also methionine, lignans, betaine, tocotrienols, Mg, and other bioactive rye components can be associated with a decreased risk of diabetes. 36 The beneficial effect of sourdough fermentation on glycemia was proposed by Liljeberg and Bjorck, 37 and Jenkins et al. 38 In fact, lactic acid, either produced during sourdough fermentation or added directly to the bread, has been reported to reduce the rate of in vitro starch hydrolysis, suggesting that lactic acid interferes with the digestive process. 39
It should be noted that the incorporation of S powder or RB enriched with S powder into the high fat formula helps in regeneration of the STZ-inducted rats' damaged pancreas. The relative pancreas mass in these two groups of rats was significantly higher compared with the pancreas mass observed in STZ-induced nontreated rats.
It is known that impaired glucose metabolism leads to oxidative stress, 40 protein glycation, and the formation of free radicals. 41 In our study, levels of TBARS in nontreated diabetic rats showed significant increases in comparison with the rats fed normal diets. We have found that the incorporation of S powder in the HF diet significantly reduces the extent of lipid peroxidation. The same effect toward the reduction of TBARS levels was observed in diabetic rats treated with either RB or bread fortified with S powder. In our study, TBARS attenuation was accompanied by a tendency to gain of FRAP value.
Results from other studies have shown that S improves the lipid profile in animal trials. 10,42,43 However, in the current study, only a significant decrease in the triglyceride level in diabetic rats consuming S powder, RB enriched with S powder, or RB alone was observed in comparison with nontreated diabetic STZ-induced rats. No beneficial effect on TC level was observed following the treatment diets. Lee et al. 42 have reported an inhibitory effect of both crocin and crocetin on increased serum triglyceride levels as a result of the HF diet in mice, and on triglycerides, total and low-density lipoprotein-cholesterol levels in TritonWR-1339-induced hyperlipidemic mice. Lee et al., 42 as well as Sheng et al. 10 indicated that crocin and crocetin inhibit pancreatic lipase, resulting in the malabsorption of fat and cholesterol. In contrast, Zheng et al., observed that crocetin could not change the plasma lipid levels of high-lipid feeding rabbits. 43
The results from our animal studies indicate that the control STZ-induced diabetic rats decreased their body mass/length ratio significantly in comparison with the normal rats at the end of the experimental period. Neither S powder, RB, nor S powder-fortified rye-bread treatment was associated with additional decreases in body mass/length ratio above that seen in the control STZ-induced diabetic rats. The results obtained in our study correspond to those observed in the study conducted by Thomson et al., where supplementation with S powder dissolved in water (3 mg/L) did not suppress body mass gain in hypercholesterolemic rats. 44 Xi et al. did also not see any differences in the body mass of rats fed a high-fructose diet supplemented with crocetin (a carotenoid derived from S). 30
In relation to the aim of the current study, it is important to note that incorporation of S powder in the RB did not additionally improve the regeneration of damaged pancreas β-cells or the secretion of insulin, nor did it decrease blood glucose levels above that seen in the case of S powder and RB alone. Moreover, it should be mentioned that the amounts of S powder added to the HF diet, and of S powder contained in RB added to the HF formula were matched to the similar dose of bioactive components. The explanation of this observation may be the thermal processing in bread making, which may lead to degradation of the majority of the S's bioactive components. Raina et al. indicated that in the processing of S, drying temperatures lower than 30°C or higher than 60°C produced greater carotenoid degradation. The optimum temperature for drying was 40±5°C. 45 Moreover, it should be postulated that the bioactive components of S powder may be less bio-accessible in the digestive tract when included in bread, probably due to the strong interaction of this compound with the processed food components (proteins and starch). Similarly, the low human bio-accessibility of free curcumin from breads was observed in a study conducted by Vitaglione et al. 46
Conclusion
It is concluded that, although RB enriched with S powder incorporated in HF diets leads to the regeneration of β-cell function, increases in insulin secretion, and decreases in glucose and triglyceride level, these effects were not significantly higher than those seen in cases of S powder or RB incorporated into the HF diet in diabetic rats separately. Therefore, in anti-diabetic treatment, S powder or RB alone may be used, but no additional metabolic effect can be seen after the consumption of RB enriched with S powder. Further studies are needed to determine the optimal method (for example, encapsulation) of improving the stability and bioavailability of S's active components from food matrices. Furthermore, it is important to note that the extrapolation of data obtained from rodents to humans should be carefully evaluated due to physiological differences; therefore, further human studies are needed to evaluate the effects of customarily consumed amounts of RB enriched with S on glycemic control.
Footnotes
Acknowledgments
The authors thank Malgorzata Tubacka for her assistance during the animal study. This research was supported by the Ministry of Science and Higher Education, Iuventus Plus program (IP2010 026870).
Author Disclosure Statement
No competing financial interests exist.