




Abstract
This study evaluates the effects of green tea polyphenols (GTPs) on bone microarchitecture in high-fat-diet (HFD)–induced obese female rats. Thirty-six 3-month-old female rats were fed either a control diet or a HFD for 4 months. Animals in the control group continued on the control diet for another 4 months. Animals in the HFD group were divided into two groups, with 0.5 g/100 mL GTP (the HFD+GTP group) or without GTP (the HFD group) in drinking water, in addition to the HFD for another 4 months. Compared to the control group, the HFD group increased bone formation and erosion rates at the tibia, decreased trabecular volume and thickness, but had no impact on bone mineral density (BMD), trabecular number (Tb.N), and separation. Compared to the control group, the HFD+GTP group demonstrates a greater Tb.N at the proximal tibia, and a greater trabecular thickness at the femur and the lumbar vertebrae, but a smaller trabecular separation (Tb.Sp) and mineralizing surface at the proximal tibia, and a reduced endocortical mineral apposition rate (MAR) at the tibia shaft. Relative to the HFD group, the HFD+GTP group demonstrates (1) a higher BMD at the femur, a greater trabecular volume, thickness, and number at the proximal tibia, a larger cortical area and thickness at the tibial shaft, and a greater trabecular volume and thickness at the femur and the lumbar vertebrae, (2) a smaller Tb.Sp, MAR, bone formation rate, and eroded surface at the tibia. We concluded that GTP supplementation in drinking water improves bone microarchitecture in the HFD-induced obese female rats, possibly through suppressing bone turnover, resulting in a larger net bone volume.
Introduction
O
Green tea is one of the most popular beverages in the world. The osteo-protective effects of green tea polyphenols (GTPs, a green tea extract [GTE]) on bone mass, microstructure, and strength have been demonstrated in our previous animal studies using various bone loss models simulating aging, aging plus sexual hormone deficiency, or chronic inflammation. 13 –17 Such osteoprotective impacts of green tea are probably due to its ability to suppress oxidative stress damage and chronic inflammation and/or increase antioxidant capacities. 13 –17
Our recent animal study shows that in obese female animals on an HFD (45% energy from fat), GTP supplementation in drinking water for 4 months benefited body composition (i.e., lower body weight, reduced fat mass percentage, and increased fat-free mass percentage), improved bone properties (i.e., higher bone strength), and suppressed adipokines, including serum insulin-like growth factor-I, leptin, and adiponectin, probably through enhancing antioxidant capacity or suppressing proinflammation production. 18 Furthermore, there is no difference in any aforementioned outcome parameters between animals on a low-fat diet (10% energy from fat) and animals on an HFD supplemented with GTP. 18 However, the effect of GTP supplementation on bone microarchitecture in HFD-induced obese female rats is still unclear. Further, it is of importance to know whether GTP supplementation would render bone microarchitecture in animals on an HFD close to that in those on a low-fat diet.
Therefore, the objectives of the present study are (1) to investigate the effect of GTP supplementation on bone microarchitecture in HFD-induced obese female rats, and (2) to compare the bone micorarchitecture parameters between the obese rats on an HFD with GTP supplementation and the rats on a low-fat diet. Based on the reported protective effect of antioxidant-rich GTP on bone microarchitecture in ovariectomized female rats, 14 we hypothesize that (1) GTP would benefit bone mircroarchitecture in the obese female rats, and (2) GTP supplementation would even render bone microarchitecture in rats on a HFD the same as that in rats on a low-fat diet. In addressing the study objectives and hypotheses, we assessed static and dynamic bone metabolic activities through histomorphometry, and bone microarchitecture through microcomputed tomography (μCT). In addition, bone mass was also evaluated by dual-energy X-ray absorptiometry (DXA). Such animal study would advance the understanding of possible benefits of GTP to skeletal health leading to prevention of pathological bone deterioration in obese women during bone remodeling.
Materials and Methods
Animals and GTP treatments
Thirty-six 3-month-old virgin Sprague-Dawley female rats (Harlan Laboratories, Indianapolis, IN, USA) were used in this study. Before the experiment, all animals were acclimated for 5 days on an AIN-93M diet and distilled water ad libitum, in an environmentally controlled animal care facility. After acclimation, rats were randomized by weight and assigned to a control diet (10% energy from fat, n=12) or a HFD (45% energy from fat, n=24) ad libitum for 4 months. Both diets were modified based on the AIN-93M diet with the same amount of vitamins and minerals to each animal after adjustment for energy intake (Research Diets, Inc., New Brunswick, NJ, USA). 18
After 4 months, rats in the control diet group continued on the same control diet for another 4 months, while those in the HFD group were further randomly divided into two subgroups, with GTP supplement in drinking water (the HFD+GTP group, n=12) or without GTP (the HFD group, n=12), in addition to the same HFD for another 4 months. All rats were examined daily and weighed twice a week, with food consumption documented daily. Rats were housed in individual stainless steel cages under a controlled temperature of 21°C±2°C with a 12-h light–12-h dark cycle. All procedures were approved by the Texas Tech University Health Sciences Center Institutional Animal Care and Use Committee.
Rats in the HFD+GTP group had free access to distilled water containing 0.5 g/100 mL GTP prepared fresh daily, and water consumption of each rat was recorded twice a week. GTP was purchased from Shili Natural Product Company, Inc. (Guangxi, China), with ≥98.5% purity and every 1000 mg GTP contained 464 mg (−)-epigallocatechin gallate (EGCG), 112 mg (−)-epicatechin gallate, 100 mg (−)-epicatechin, 78 mg (−)-epigallocatechin, 96 mg (−)-gallocatechin gallate, and 44 mg catechin according to the high-performance liquid chromatography electrochemical detector and high-performance liquid chromatography- ultraviolet analyses. 18
Sample preparation
Each animal was given an intraperitoneal injection of calcein green (10 mg/kg of body weight; Sigma Co., St. Louis, MO, USA) at 14 and 4 days before the end of the study. The final body weight was recorded. At the end of the experiment, after animals were anesthetized using isoflurane gas and euthanized using CO2 inhaler, the femora, tibiae, and lumbar vertebrae-4 (LV-4) were harvested and cleaned of adhering soft tissues. Left femur and LV-4 samples were kept in 70% ethanol at 4°C for later bone scans. The right tibia samples were kept in 100% ethanol, and then processed for histomorphometric analyses.
Histomorphometric analysis
Preparation and measurements of right tibiae for the static and dynamic bone histomorphometric analysis were reported previously. 14 A digitizing morphometric system was employed to measure bone histomorphometric parameters following the method of Shen et al. 14 This morphometric system consisted of an epifluorescence microscope (Nikon E-400), an Osteomeasure High Resolution Color Subsystem coupled with an IBM computer, and a morphometry program (OsteoMetrics, Atlanta, GA, USA). The measured parameters for cancellous bone included total tissue volume (TV), bone volume (BV), bone surface (BS), single- and double-labeled surfaces, interlabel width, and eroded surface (ES). These data were used to calculate standard morphometric parameters analyzed in bone studies, including percent trabecular BV (BV/TV), trabecular thickness (Tb.Th), trabecular number (Tb.N), trabecular separation (Tb.Sp), mineral apposition rate (MAR), mineralizing surface (MS/BS), bone formation rate (BFR/BS and BFR/BV), ES/BS, osteoblast surface (Ob.S/BS), and osteoclast surface (Oc.S/BS), according to the standard nomenclature recommended by the American Society for Bone and Mineral Research Nomenclature Committee. 19 The region of bone measured in all groups is 1–4 mm from the growth plate in the proximal tibia.
Measurements in cortical bone included the total bone area (T.Ar), periosteal perimeter, marrow area (Ct.Ma.Ar), cortical thickness (Ct.Th), endocortical perimeter, periosteal and endocortical single- and double-labeled perimeters, and endocortical ES. These measures were then used to calculate percent cortical bone area (Ct.Ar), percent periosteal mineralized surface/BS (Ps-MS/BS), periosteal MAR (Ps-MAR), periosteal BFR (Ps-BFR/BS), percent endocortical MS/BS (Ec-MS/BS), endocortical MAR (Ec-MAR), endocortical BFR (Ec-BFR/BS), and endocortical ES/BS (Ec-ES/BS). 19
Bone microarchitecture assessment by μ-CT
Bone microarchitecture in the femur and LV-4 was assessed using μ-CT (MicroCT40; SCANCO Medical AG, Bruttisellen, Switzerland). The bones were scanned at 12-μm isotropic voxel size with an X-ray source power of 55 kV and 145 μA and integration time of 300 msec. The distal femur was scanned cross-sectionally, and 120 slices starting from 0.5 mm proximal to the growth plate, constituting 1.44 cm in length, were chosen for analysis. For LV-4, the entire secondary spongiosa between the cranial and the causal area was scanned and analyzed. The scanned grayscale images were processed by a low-pass Gaussian filter (sigma=0.8, support=1) to remove noise, and a fixed threshold of 220 was set to extract the mineralized bone from soft tissue and marrow phase. Trabecular parameters in both the femur and LV-4 included percent of total BV (BV/TV), Tb.N (#/mm), Tb.Th (μm), and Tb.Sp (μm).
Assessment of femoral bone mass
The T.Ar, bone mineral content (BMC), and bone mineral density (BMD) of the whole left femur of each rat were measured by DXA (HOLOGIC QDR-2000 plus DXA, Waltham, MA, USA) and the coefficient of variation of these measurements was less than 1.0%. 20
Statistical analysis
Data are expressed as mean±standard error of the mean, unless stated otherwise. All data were analyzed with SigmaStat software, version 2.03 (Systat Software, Inc., San Jose, CA, USA). Data were analyzed by one-way analysis of variance followed by Fisher's least significant difference post hoc tests to evaluate the treatment effects. All statistical tests were based on a significance level of P<.05.
Results
Food intake and body weight
Throughout the study, the average feed consumption was similar among the three groups (13.9±1.6, 12.8±0.6, and 12.2±1.1 g/day for the control, HFD, and HFD+GTP groups, respectively). There was no difference in the initial body weight among all treatment groups (235.8±3.1, 234.8±2.7, and 233.9±1.4 g for the control, HFD, and HFD+GTP groups, respectively). At 4 months, the two HFD groups (276.9±4.1 g for the HFD group and 271.6±4.8 g for the HFD+GTP group) had a significantly greater body weight than the control group (247.0±3.3 g). At the end of the 8-month study, the average body weight data are the following: HFD group (292.9±6.7 g); HFD+GTP group (272.3±5.0 g); control group (263.6±2.4 g) (P=.002).
Static parameters for proximal tibia
Relative to the control group, the HFD group demonstrated lower values for BV/TV and Tb.Th, higher values for MAR, BFR/BS, BFR/BV, ES/BS, Ob.S/BS, and Oc.S/BS, but no difference in Tb.N, Tb.Sp, and MS/BS at the proximal tibia (Table 1). Compared to HFD without GTP, the HFD+GTP treatment significantly increased BV/TV, Tb.Th, and Tb.N, and significantly decreased Tb.Sp, MS/BS, MAR, BFR/BS, BFR/BV, ES/BS, Ob.s/BS, and Oc.S/BS in the HFD-induced obese rats (Table 1). Among all treatments, the HFD+GTP provided the highest Tb.N and the lowest Tb.Sp and MS/BS at the proximal tibia of rats. Except for Tb.N, Tb.Sp, and MS/BS, there was no significant difference in other parameters between the control group and the HFD+GTP group (Table 1).
Data are expressed as the mean±SEM, n=10–12.
Different letters within the same row indicate significant differences at P<.05 by one-way ANOVA followed by Fisher's LSD test.
GTP, green tea polyphenols; HFD, high-fat diet; BV/TV, percent trabecular bone volume; Tb.Th, trabecular thickness; Tb.N, trabecular number; Tb.Sp, trabecular separation; MS/BS, mineralizing surface/bone surface; MAR, mineral apposition rate; BFR/BS, trabecular bone formation rate/bone surface (tissue level); BFR/BV, bone formation rate/bone volume (volume level); ES/BS, trabecular eroded surface/bone surface; Ob.S/BS, osteoblast surface/bone surface; Oc.S/BS, osteoclast surface/bone surface; SEM, standard error of the mean; ANOVA, analysis of variance; LSD, least significant difference.
Dynamic parameters for cortical bone of tibial shaft
Compared to the control group, the HFD group demonstrated increased T.Ar, Ct.Ma.Ar, Ps-MS/BS, Ps-MAR, Ps-BFR/BS, Ec-MS/BS, Ec-MAR, Ec-BFR/BS, and Ec-ES/BS, decreased Ct.Ar and Ct.Th, and no difference in the cortical bone area (Ct.B.Ar) at the tibial shaft of rats (Table 2). GTP supplementation resulted in significant increases in Ct.Ar and Ct.Th, significant decreases in Ct.Ma.Ar, Ps-MS/BS, Ps-MAR, Ps-BFR/BS, Ec-MS/BS, Ec-MAR, Ec-BFR/BS, and Ec-ES/BS, and no difference in Ct.B.Ar at the cortical bone of the tibia shaft in obese rats (Table 2). Except for Ct.B.Ar and Ec-MAR parameters, there was no significant difference in other parameters between the control group and the HFD+GTP group.
Data are expressed as the means±SEM, n=10–12.
Different letters within the same row indicate significant differences at P<.05 by one-way ANOVA followed by Fisher's LSD test.
T.Ar, total area; Ct.Ma.Ar, cortical marrow area; Ct.B.Ar, cortical bone area; Ct.Ar, percent cortical bone area (cortical area/total area); Ct.Th, cortical thickness; Ps-MS/BS, percent periosteal mineralized surface/bone surface; Ps-MAR, periosteal mineral apposition rate; Ps-BFR/BS, periosteal bone formation rate; Ec-MS/BS, percent endocortical mineralized surface/bone surface; Ec-MAR, endocortical mineral apposition rate; Ec-BFR/BS, endocortical bone formation rate; Ec-ES/BS, endocortical eroded surface/bone surface.
Microarchitectural properties of femur and LV-4
Table 3 exhibits the effects of GTP supplementation on trabecular bone microarchitecture at the femur and LV-4 of obese rats. Relative to HFD, HFD+GTP treatment significantly increased BV/TV and Tb.Th, decreased Tb.Sp, and produced no effect on Tb.N.
Data are expressed as the means±SEM, n=10–12.
Different letters within the same row indicate significant differences at P<.05 by one-way ANOVA followed by Fisher's LSD test.
Bone mineral density
Among all treatment groups, there was no difference in T.Ar (data not shown). There was no difference in BMD between the control group and the HFD group (Fig. 1). The HFD+GTP group demonstrated a higher BMD value than those in the control and the HFD groups (Fig. 1) (P<.001).
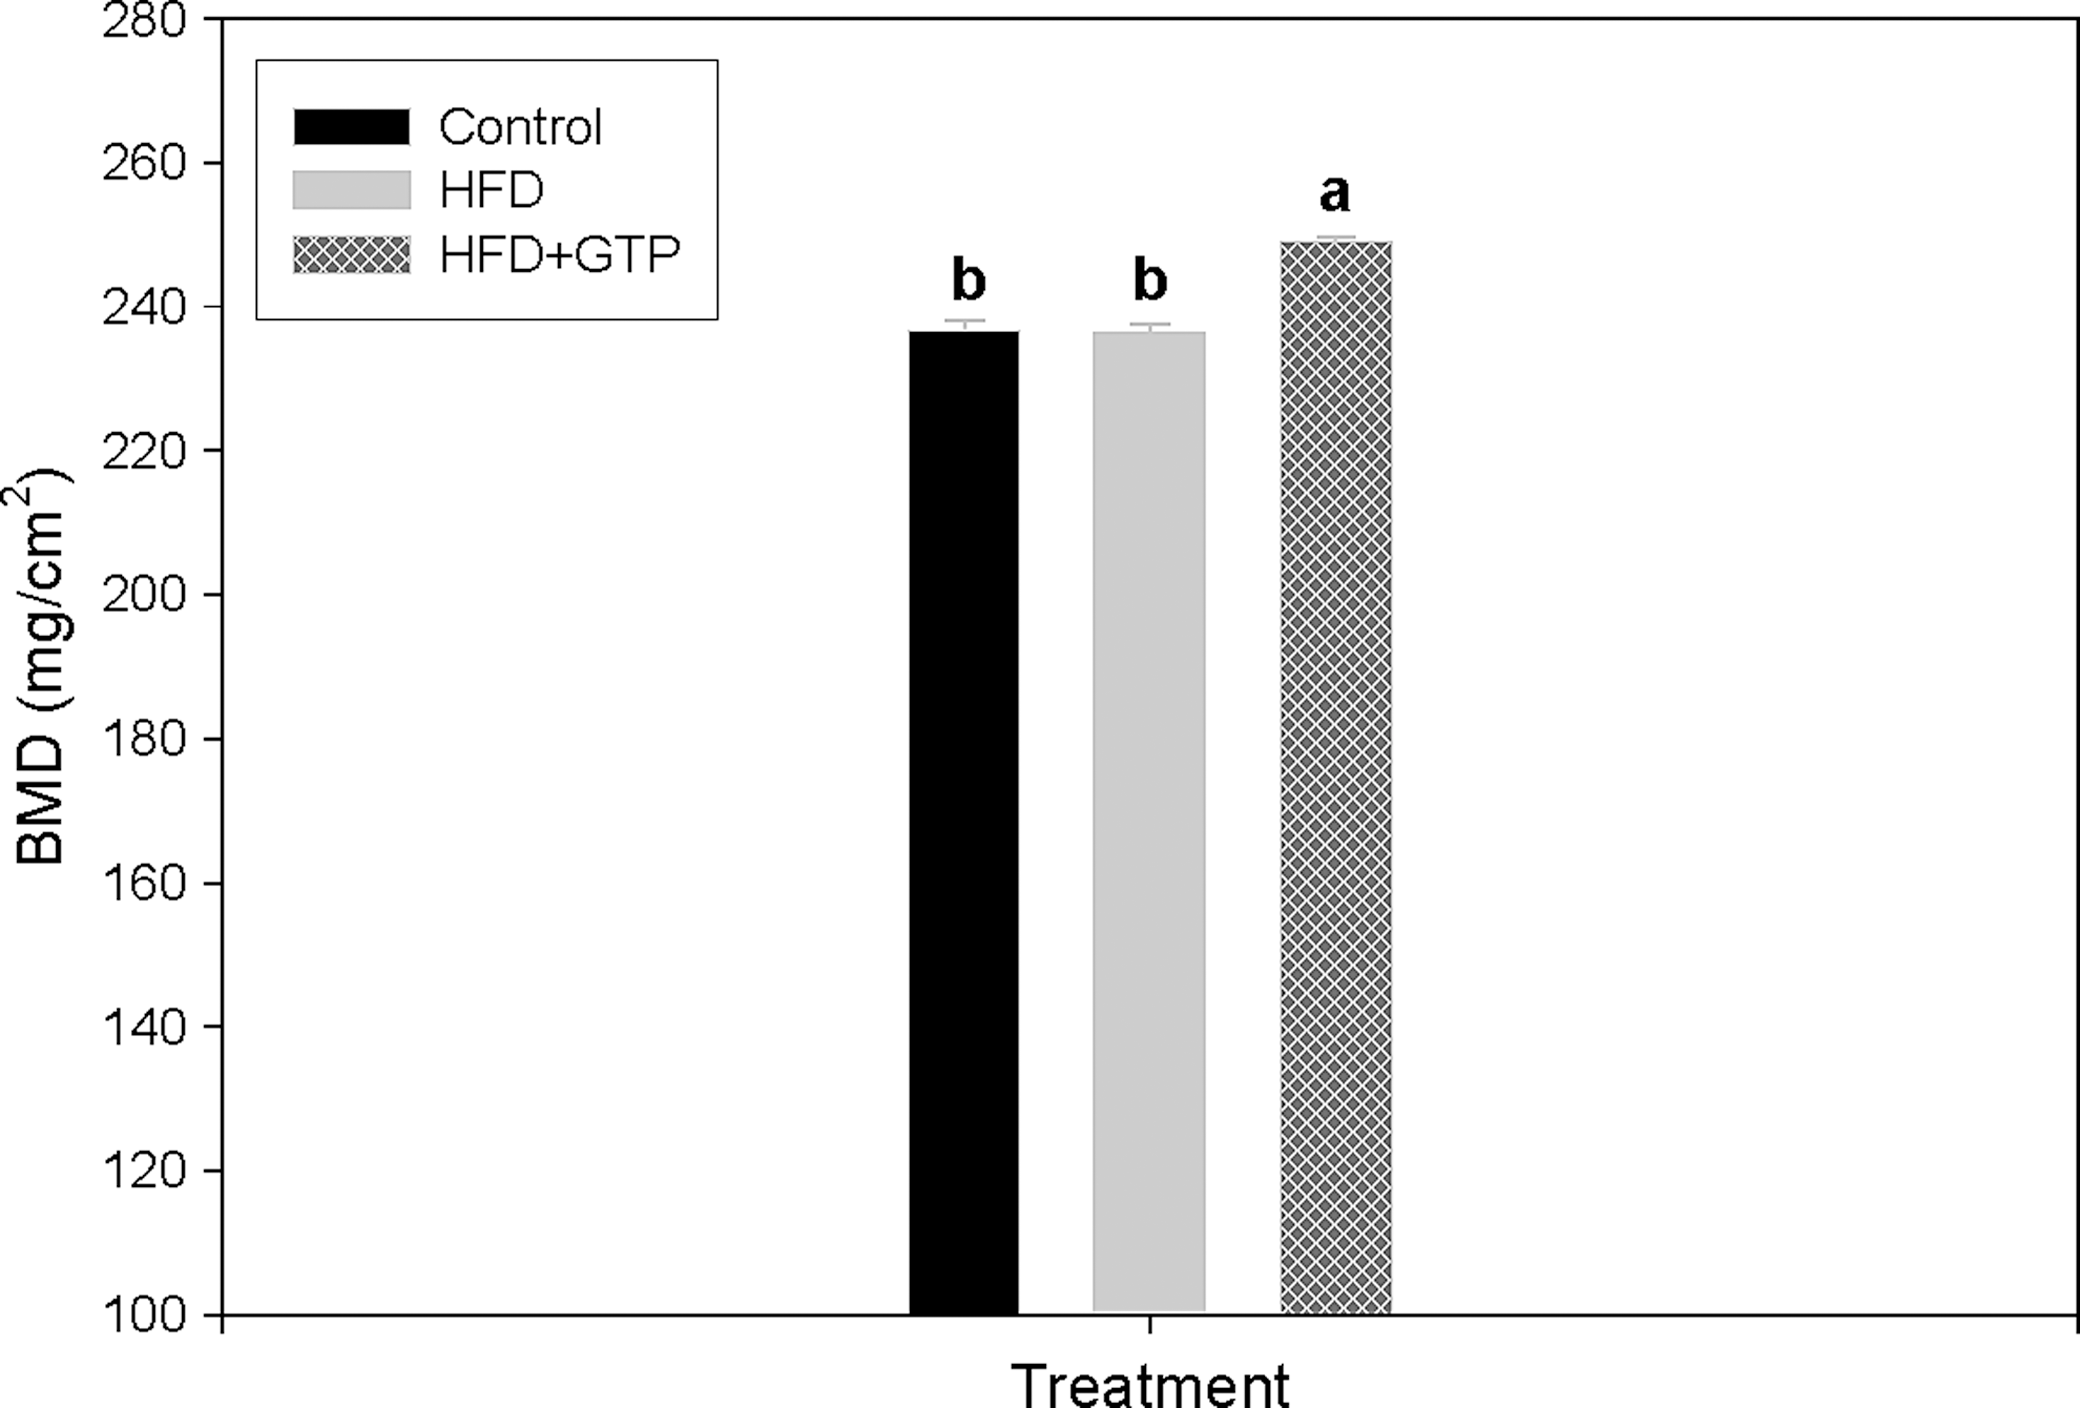
Bone mineral density in female rats (n=10–12) supplemented with green tea polyphenols (GTP) in drinking water for 4 months. Values are mean with their standard error of the mean (SEM) represented by vertical bars. abDifferent letters indicate significant differences at P<.05 by one-way analysis of variance followed by Fisher's least significant difference test.
Discussion
In our previous study, we reported that excessive body weight, in terms of % fat mass, is detrimental to bone strength, as measured by a three-point bending test. 18 The present study further confirms the negative impact of excessive body weight (increased % fat mass, data not shown) on bone microstructure in obese female rats. Such a detrimental effect of HFD on bone microstructure seems to be mediated by a higher bone turnover rate (as shown by increased both bone formation and bone erosion) during bone remodeling.
Relative to the control group, the HFD group demonstrated significant microarchitectural deterioration by both static (Table 1) and dynamic histomorphometric parameters (Table 2). Such result agrees with other studies using mice with different study periods. 7,21 For example, Cao et al. 7 reported that feeding mice an HFD (45% energy from fat) for 14 weeks decreases trabecular BV/TV and Tb.N, increases Tb.Sp, but results in no effect on the cortical bone mass in the tibia of young mice. Patsch et al. 21 also reported that short-term and extended HFD-induced obesity significantly decreases BV/TV and BMD at LV-4, while Ct.Th remains unaffected in male C57BL/6J mice.
The increased BFR, MAR, and erosion surface at both the proximal tibia and tibial shaft in the HFD group suggest a higher bone turnover rate due to the HFD treatment. Relative to the control group, the increased Ob.S/BS (%) and Oc.S/BS (%) in the HFD group further corroborate the findings of static and dynamic histomorphometric data. Such findings are in agreement with Cao et al. 7 that a dramatic increase in body weight of obese mice may increase both bone formation and bone resorption, thus, the bone turnover rate. Ionova-Martin et al. 9 reported that Ec-BFR/BS was unchanged in both young and adult mice fed with the HFD (60% energy from fat) or low-fat diet (10% energy from fat); however, Ps-BFR/BS was higher in both age groups of the mice (P<.05). On the other hand, Patsch et al. 21 showed that the BS covered by osteoblasts (Ob.S/BS) or osteoclasts (Oc.S/BS) was similar among the low-fat-diet group, short-term HFD group, and extended HFD group. The discrepancy among these studies can be due to the differences in species of animals (mice vs. rat), age of animals (young vs. adult), amount of energy from fat, and length of study (short term vs. long term).
When we evaluated the impact of HFD on bone parameters in animals, both bone formation and bone resorption should be considered together. Then, the impact of HFD on net BV should be noted. If the net BV is decreased, it indicates that HFD is detrimental to bone. In the Tables 1 and 2, relative to the control diet, HFD increased both bone formation and resorption rates at the same time, resulting in a small net BV (↓BV/TV [%] in Table 1 and ↓Ct.Ar [%] in Table 2). Such findings suggest that the impact of HFD on bone is detrimental. In addition, the results of comprised bone quality (an indicator of bone strength assessed by the three-point bending test) in the HFD group are also supported by the deterioration of bone microarchitecture.
Compared to the control diet, although the HFD shows the detrimental effects on bone microstructure, we noted that there was no difference in BMD between the control group and the HFD group, a result in agreement with Chen's study 12 that male rats fed with a diet containing 45% energy from fat, the same amount of fat as the current study.
The present study supports our hypotheses that (1) GTP supplementation benefits HFD-induced deterioration of bone microstructure in obese female rats during bone remodeling, and (2) GTP supplementation even renders bone microarchitecture in rats on a HFD the same as that in rats on a low-fat diet (except for Tb.N, Tb.Sp, and MS/BS among the 11 measurements for the trabecular bone of the proximal tibia (Table 1), and Ct.B.Ar and Ec-MAR among the 12 measurements for the cortical bone of the tibia shaft (Table 2). Such results suggest that GTP may largely compensate for the bone deterioration due to the HFD.
Unlike our previous GTP studies using various bone loss models, 14 –17 this is the first report that GTP supplementation suppresses the bone turnover rate in the studied animals by inhibiting both BFR and the bone resorption rate, as indicated by measurements for the trabecular bone of the proximal tibia and periosteal and endocortical surface of the tibial shaft. Such results suggest that GTP may suppress both bone modeling and bone remodeling.
The result that GTP supplementation in drinking water suppresses osteoblastogenesis in obese rats is supported by the Kamon et al. study, 22 which reported that EGCG (the main component of green tea catechin) suppresses differentiation of murine osteoblastic MC3T3-E1 cells, but does not affect mineralization of differentiated MC3T3-E1 cells along with reduced osteoclast formation in coculture, suggesting suppressed bone resorption. The current result of GTP's suppression of osteoclastogenesis, as shown by the reduced erosion surface in both the trabecular and endocortical bone of tibia, seems to be supported by previous studies that EGCG inhibits osteoclastogenesis by suppressing the nuclear factor –kappa-B signal 23,24 and by inhibiting the matrix metalloproteinase-9 expression. 25
Contrary to the present observation that GTP improves BMD in obese rats, the study by Iwaniec et al. 26 reported a negative impact of GTE on bone mass in genetically obese, leptin-deficient (ob/ob) male mice. In that study, 5-week-old lean and ob/ob mice fed powder diets containing 0%, 1% or 2% (w/w) GTE for 6 weeks demonstrated lower values of bone length, volume and BMC of the femur, but larger trabecular BV of LV compared to wild-type mice, suggesting that dietary GTE supplementation inhibited the rate of bone accumulation during growth. The discrepancy between the present study and the Iwaniec's study 26 could be due to the differences in the dose of green tea consumed by animals (∼4 servings/day in our study vs. ∼7–14 servings/day in the Iwaniec's study, 120 mL/serving), the models of obesity (HFD-induced obese rats vs. genetically obese, leptin-deficient ob/ob mice), and the age of animals (11 months vs. 3 months old) reflecting different stages of bone metabolism (remodeling stage during aging vs. modeling stage during growth). Green tea has been considered as a relatively safe beverage, a rich source of antioxidants, showing no serious side effects for up to 8 servings/day in humans. However, a higher dosage of green tea, such as those used in the Iwaniec's study, 26 may become a source of pro-oxidants that could be detrimental to the bone matrix.
The current study is limited in lacking GTP bioavailability in terms of serum or urinary GTP metabolites data. Although we have demonstrated an elevation of urinary GTP metabolites due to GTP supplementation in various models of rats, and that the amount of GTP consumption in our previous studies was comparable to that in the present study, 15,27 the potential difference in the study design (i.e., age and study duration) should be noted.
In the current study, GTP was evaluated as an alternative treatment choice for mitigating deterioration of bone microarchitecture due to obesity. Our data demonstrate that GTP supplementation has preservative effects on bone microarchitecture in obese female rats. These effects may be mediated, in part, through a reduced bone turnover rate along with modulated cancellous and endocortical bone compartments, resulting in a larger net BV. Beyond our previous GTP studies using other animal models, 13 –17,27 the present study using obese female rats shed more light on GTP supplementation's possible benefits to the maintenance of skeletal health in obese women during aging, in terms of GTP's impacts on the osteoclast and osteoblast activity and resorption of bone during bone remodeling. Future translational research based on results of the current and other animal studies is warranted to evaluate possible therapeutic efficacy of GTP supplementation in preserving bone microarchitecture, thus reducing risk of fractures, at various bone sites by advanced imaging technology in obese women.
Summary
This study demonstrates beneficial effects of GTP supplementation on bone microarchitecture during skeletal aging in an HFD-induced obesity model. In general, supplementation of GTP to HFD-induced obese rats for 4 months provides an osteoprotective or even compensatory effect on bone microstructural deterioration due to the HFD, possibly via suppression of bone formation and bone erosion.
Footnotes
Acknowledgments
This study was supported by the Laura W. Bush Institute for Women's Health and Winthrop-University Hospital (C.-L.S.), and partially supported by the USDA Agricultural Research Service CRIS program 5450-51000-046-00D and 5450-51000-039-00D (J.J.C.). We thank Raul Y. Dagda (Department of Pathology, Texas Tech University Health Sciences Center, Lubbock, Texas) for the animal care involved in this study.
Author Disclosure Statement
No competing financial interests exist.