
Abstract
Although rutabaga (Brassica napus L. var. napobrassica) is a popular crop, especially in North Europe and North America, its sprouts are a new kind of vegetable. Rutabaga roots, and particularly sprouts, have not been investigated so far for antioxidant and anticancer effect on human tumor cells (Hep G2). Therefore, in vitro tests were conducted to find out whether rutabaga seeds, roots, and sprouts exert a cytotoxic effect on mammalian cells and combine them with other biological properties of particular parts of the plant. Rutabaga methanol extracts were measured for total phenolic, total flavonoid concentrations, and total antioxidant activity. Cytotoxicity of the investigated extracts was measured using 3-(4,5-dimethylthiazol-2-yl)2,5-diphenyltetrazolium bromide assay in Chinese hamster ovary cells (CHO-K1) and Hep G2 cells culture. Cell membrane integrity was assessed in CHO-K1 and Hep G2 cells by luminescence ToxiLight BioAssay. The results of the investigation have shown that sprouts have significantly higher antioxidant activity than seeds and roots, which may result from different contents of polyphenols. Rutabaga extracts (especially 8 day sprouts) inhibited the tumor cell line Hep G2 proliferation and had a slight effect on the normal mammalian CHO-K1 culture. An advanced analysis of previously observed morphological changes and cytotoxic properties demonstrated that the evaluated extracts exerted cell death via apoptosis. These findings strongly suggest that one of the biological activities of rutabaga is antiproliferative and proapoptotic potential specific to tumor cells. The obtained results demonstrate the antioxidant property of rutabaga and its potential as a nutritional supplement in cancer prevention. These findings also strongly advocate the application of rutabaga sprouts (especially harvested in conditions presented in this article) in functional food.
Introduction
R
The sprouts of rutabaga are, however, a novel kind of food, containing valuable bioactive compounds. The nutritional value of the sprouts has not yet been investigated. An examination of the phytochemicals of Brassicaceae species affords the opportunity to examine a wide range of chemical compounds. In particular, this plant family is rich in glucosinolates and their derivates, isothiocyanates, as well as vitamins, dietary fiber, flavonoids, and phenolic acids. Brassica vegetables are one of the natural products that express chemopreventive activity against tumors derived from a variety of animal tissues such as liver, small intestine, lungs, pancreas, colon, or mammary gland. 1 These attributes stem mostly from the phenolic compounds, glucosinolates, and their hydrolysis products, isothiocyanates. 2,3 In epidemiological studies, the consumption of brassica vegetables has been related to the reduction of not only cancer risk, but also cardiovascular diseases. 4 Medicinal effectiveness of these species is already well known, but there are seldom notifications about the negative effect (thyrotoxicity) of these plants, especially its sprouts, 5,6 therefore an advanced nutritional study is required.
So far, not enough scientific evidence has been gathered on the health effects of rutabaga and its sprouts, which after a detailed examination could probably be utilized as “nutraceuticals” in human nutrition.
The estimation of drug toxicity is also a critical step during the discovery process. The main problems are, on one hand, unpredictable features of chemicals and, on the other hand, the species and tissue specificity. The application of the proper toxicity tests is the key step in the discovery process and is a base of strategy to avoid unforeseen side effects. Various in vitro cytotoxicity tests are used to measure biological parameters and are applied using various cell types. In adenosine triphosphate (ATP) monitoring luminescence tests, an assessment of the synthesis and degradation of ATP level reflects precisely the state of metabolism in living cells. 7 –9 The bioluminescent methods are based on the production of light as the effect of the reaction of ATP with enzyme luciferase. Since ATP is present in all living cells as the carrier of energy, measurement of this compound provides information about the metabolic state of the cell. Advanced generation of bioluminescent non-destructive tests is based on assessment of adenylate kinase—the enzyme that catalyzes conversion of adenosine diphosphate (ADP) to ATP inside the cell. Disruption in cell membrane integrity by toxic compound causes efflux of enzyme to cell culture medium, where it may be detected. 10 The 3-(4,5-dimethylthiazol-2-yl)2,5-diphenyltetrazolium bromide (MTT) quantitative colorimetric test developed by Mosmann is a well-documented cell viability assay that is used for measuring cytotoxicity. 11 Chinese hamster ovary cells (CHO-K1 from Cricetulus griseus) are easy to maintain and commonly used normal cell lines for cytotoxicity assessment. 12 This mammalian cell model is a very useful tool for screening tests. However, considering species differences and specific metabolic transformations, the reliable model of human tumor cells, which reflects regulation of cellular processes, is cell line Hep G2 (Homo sapiens). This epithelial-like hepatoma cell line is stable and widely used in proliferation/viability tests. 2,13
The aim of cancer treatment is to induce apoptosis and to trigger tumor-selective cell death. Therefore, it is important to assess the response of tumors to tested chemicals in comparison to normal cells in order to find out whether cancer cells may enter programmed suicide. Regardless of the pathways involved, there is no doubt that mitochondrial permeabilization is essential for apoptosis. Hence, targeting cancer cell death through mitochondria is of high importance. It is well known that P53 differentially activates or suppresses target genes of cell growth and proliferation through multiple mechanisms. P53 represses anti-apoptotic proteins and one of the proteins, Bcl-xl, inhibits cytochrome c release from mitochondria to cytoplasm. When suppressing fails, cyt-c protein enters cell cytoplasm, where it can be detected as a proof for advanced apoptosis.
The present study was focused on determining antioxidant activity (AA) of different parts of rutabaga and estimating whether the effects of rutabaga seeds, roots, and sprouts are cytotoxic to mammalian, normal, and tumor-derived cells. The mechanism of cell death, via apoptosis or necrosis, was studied. The best conditions of rutabaga sprouts harvesting were also evaluated and combined with biological activity to support application of sprouts in functional food.
Materials and Methods
Plant material and growth conditions of sprouts
Rutabaga seeds (B. napus L. var. napobrassica) were collected from plants harvested in northern Poland (Gdańsk) in 2004. Voucher specimen was deposited in the POLAN Hodowla i Nasiennictwo Ogrodnicze Gdańsk—Wieniec Sp. z o.o. (Horticultural Breeding and Seed Supplies Company Gdansk-Wieniec) and in the Department of Food Chemistry and Nutrition, Faculty of Pharmacy, Jagiellonian University Medical College (No#BNN/PP/PL 1025).
Rutabaga seeds were immersed in water for 3 h and then put into plastic vessels. Sprouts were grown for 8, 10, and 12 days after seeding (DAS) at the fixed temperature of 20±2°C. They were watered every day. Half of the culture was stored in natural conditions (daylight), while the rest was kept in darkness at all times.
The duration of cultivation was based on the laboratory observation that 8–12 days were optimal for growing this species of sprouts. In shorter periods, sprouts did not develop sufficiently and in longer time spans, they overgrew. In general, the fresh weight of all rutabaga sprouts increased significantly during sprouting days. Harvesting in darkness had a clearly positive influence on the fresh weight of all rutabaga sprouts as compared with harvesting in daylight. Roots of rutabaga were harvested in southern Poland (Kroscienko on Dunajec) in October 2010.
Extracts preparation
After 8, 10, and 12 days of germination, sprouts were collected and extracted immediately. The remaining portion of samples was stored at −80°C until they were used for measurement of antioxidant and cytotoxic effects.
Samples of seeds and blended sprouts and roots (1 g) were extracted with 80 mL of hot methanol for 3 h. The initial methanol extracts were decanted, centrifuged, and stored in darkness in a freezer at −20°C.
These extracts were used for estimation of total antioxidant activity (TAA), total phenolic (TP) content, cytotoxic assays, apoptosis, and necrosis effects. For Cell Membrane Integrity Assay, dry methanol extracts were obtained after removing the solvent by evaporation under reduced pressure. Dry methanol extracts were then dissolved in dimethyl sulfoxide (DMSO). All solutions for cytotoxic assay and for cell membrane integrity assay were kept at −20°C for less than a week.
Plant material for free flavonoid (FF) analysis was extracted with 50% methanol/water, and the sample was vortexed for 1 min and heated at 90°C for 3 h. Total flavonoids (TF) were extracted with 1.2 M HCl in 50% methanol/water and heated at 90°C for 3 h. 14,15
Determination of ferric-reducing antioxidant power
Ferric-reducing antioxidant power (FRAP) assay was previously described 16 and modified to 48-well plates and automatic reader (Synergy-2) with syringe rapid dispensers. Briefly, the oxidant in the FRAP assay (reagent mixture) consisted of ferric chloride solution (20 mmol/L), triphenyltriazine (TPTZ) solution (10 mmol/L TPTZ in 40 mmol/L HCl), and acetate buffer (pH=3.6) in a proportion of 5:5:10, respectively, and was freshly prepared. To each plate, 0.4 mL of acetate buffer (pH 3.6) was dispensed, followed by 50 μL of sample, standard or blank. The plate was conditioned at the temperature of 37°C for 2 min, and then, 0.2 mL of reagent mixture was added and shaken for 30 sec; afterward, absorbance at 593 nm was measured with kinetic mode for 15 min. The final results were expressed as mmol Fe2+/kg dry weight.
Determination of antioxiolant activity using DPPH free radical method
Diphenylpicrylhydrazyl (DPPH) radical-scavenging activity was measured according to the method of Yen and Chen 17 with modifications. 16 For measurement of sample scavenging activity, 0.4 mL of methanolic acetate buffer was added to the cuvettes containing the increasing volumes of sample (e.g., 0, 0.1, 0.2, 0.3, 0.45, 0.6 mL) with adequate volumes of methanol until they reached the total volume of 1 mL. Acetate buffer was made from 0.2 mol/L solutions of sodium acetate and acetic acid in methanol mixed at the volume ratio 7.9:2.1. The pH of the buffer was 5.2. 1 mL of DPPH stock solution (12 mg DPPH was dissolved in 100 mL of methanol; absorbance 1.3), which was added to each cuvette; then, absorbance was measured after 24 h. The absorbance of the resultant solution was determined using Jasco UV-530 spectrometer at 514 nm. The TAA were estimated as Trolox equivalents (TEAA) by interpolation to 50% inhibition (TEAA50).
Determination of TPs content
TPs were determined colorimetrically using Folin–Ciocalteau reagent, as previously described. 16 TP assay was conducted by mixing 2.7 mL of de-ionized water, 0.3 mL of extracts, 0.3 mL 7% Na2CO3, and 0.15 mL Folin–Ciocalteu reagent. Absorbance of mixture was measured at 725 nm. A standard curve was prepared with gallic acid. Final results were given as gallic acid equivalents.
Determination of flavonoid content
Briefly, a 0.25 mL of extract was diluted with 1.25 mL of distilled water. Then, 75 μL of 5% NaNO2 solution was added to the mixture. After 6 min, 150 μL of 10% AlCl3·6H2O solution was added and the mixture was allowed to stand for another 5 min. Then, 0.5 mL of 1 M NaOH was added and after mixing, the absorbance was measured immediately at 510 nm. 14 The final concentration of flavonoids was expressed as an equivalent of rutin (mg rutin/g dry weight).
Cell culture conditions
Chinese hamster ovary cells (American Type Cell Culture [ATCC] designation: CHO-K1, CCL-61) and human hepatocellular carcinoma cells (ATCC designation: Hep G2, HB-8065) were obtained from ATCC collection. Cells for experiments were between 10th and 25th passages. Media and sera were purchased from ATCC; antibiotics mixture and Trypsin–0.05% EDTA solution were from Gibco. Sterile and nontoxic plates, flasks, tips, and centrifuge tubes were from Sarstedt and Falcon. All salts and other solutions were of cell culture grade (Gibco).
The base medium for CHO-K1 was F-12K. Hep G2 cells were cultured in Eagle's Minimum Essential Medium. Both substances were supplemented with 10% Fetal Bovine Serum and with 1% antibiotic solution (100 IU/mL penicillin, 0.1 mg/mL streptomycin). Cells were maintained at 37°C in a humidified atmosphere of 5% CO2 in air and were subcultivated twice a week. Trypsin–0.05% EDTA solution was used to detach adherent cultures. At every step of the procedure, cell morphology was investigated by an inverted light microscope (Olympus). Cell viability during the culture was assessed with Trypan Blue Exclusion Test. 0.4% Trypan Blue solution in buffered PBS without Ca++ and Mg++ (pH 7.4) was added to cells and counted in an automatic cell counter (Countess, Invitrogen). The percentage of living cells was very high and reached 95–98%.
Before experiments, the optimal cell seeding density and amount of medium were tested to assess proper correlation between cell number and biochemical activity of cells. Taking into consideration, on one hand, the optimal confluency of culture and, on the other hand, sufficient medium nutrients, cells were finally seeded into a 96-well plate (Falcon) at a density of 4×10⁴ cells/well (CHO-K1) and 2×10⁴ cells/well (Hep G2) in 200 μL of medium.
Cell colonies morphology
After 24 h of incubation with extracts, morphology of Hep G2 cell colonies was inspected with a phase-contrast microscope (Olympus). Proliferation as well as the hyperplastic changes in cultures was evaluated in comparison to the controls.
Cytotoxicity assay
For MTT test, incubations were performed in a similar way as in luminescence assay, but methanol extracts of rutabaga were used. The positive control (100% of growth) were Hep G2 cells cultured in medium; the negative control was prepared by addition of 20 mM/L of hydrogen peroxide to cells. After 24 h, media were changed for new media, containing additional MTT (5 mg/mL in PBS, pH 7.4). After incubation, media were removed again and DMSO was added to each well to dissolve MTT formazan generated during incubation. The absorbance was measured at 550 nm (reference wavelength was 690 nm) using Multiscan Go (Thermo Scientific) microplate reader. Results were expressed as a percentage of metabolically active cells related to untreated cells.
Cell membrane integrity assay
Luminescence ToxiLight BioAssay was performed according to the manufacturer's protocol using cultured CHO-K1 and Hep G2. Cells were incubated overnight at 37°C and in 5% CO2 in the air; then, media were removed and replaced with 100 μL of new medium in each well. DMSO solutions (2% v/v) of dried extracts were added to wells (amounts equal to 5 μg, 50 μg of dry weight per well of each extract). The positive controls were the cells with the same amounts of solvent as in the tested wells (2% v/v). As described in the protocol, the negative control was prepared by addition of TritonX (2.5% v/v) to cells, which caused 100% of membrane disruption and adenylate kinase release. To avoid false background values coming from extracts, the blanks were prepared (media and particular chemicals without cells). The luminescence was measured in black 96-well microtiter plates using BMG Labtech's Fluostar Optima microplate reader. Results were expressed as a percentage of the total membrane disruption and adenylate kinase release from cells treated with TritonX.
Apoptosis and necrosis quantitation
The cells were analyzed on an LSRII flow cytometer, using FACSDiva software (BD Biosciences Immunocytometry Systems). The list mode data of 50,000 events from “live gate” mode were acquired. The cells were gated according to forward, side scatter, and fluorescence parameters. Cells that were negative for annexin-V and 7AAD were considered alive cells, apoptotic cells were defined as being annexin-V positive and 7AAD negative, late apoptotic cells were annexin-V and 7AAD positive; and necrotic cells were annexin-V negative and 7AAD positive. The results were given as the percentage of apoptotic/necrotic cells of total counted cells.
Western blot analysis
Hep G2 cells were seeded at a density of 5×10⁵/mL to six-well plates and were then treated with evaluated extracts for 24 h. Mitochondria and cytoplasm were separated using organelles extraction kit (Cayman). The lysates were electrophoresed on polyacrylamide gel electrophoresis with sodium dodecyl sulfate and electro transferred to polyvinylidene difluride membranes. Then, membranes were blocked by 3% bovine serum albumine in Tris-buffered saline, probed overnight with primary antibody (Abcam), and incubated with the horseradish peroxidise-conjugated secondary antibody (Pierce). Proteins were detected in ChemiDoc (BioRad) using the enhanced chemiluminescence system (Pierce).
Statistical analysis
Results of biochemical analyses are given as means±standard deviation based on four measurements for each sample of rutabaga extracts. Differences between various groups of rutabaga sprouts, seeds, and roots were tested using Kruskal–Wallis test and verified with Dunn's test. Differences with P<.05 were considered statistically significant. A statistical analysis of cell culture cytotoxicity experiments was performed by analysis of variance followed by Duncan's post hoc test. Pearson correlation coefficients were calculated for pairs of biochemical parameters. Statistical calculations were carried out using commercially available package Statistica v.5.1 (StatSoft, Inc.).
Results and Discussion
A lot of clinical trials have been dedicated to the role of modified diet and nutritional supplements in cancer prevention. The idea of using naturally occurring plant substances is becoming more popular in Western societies, and utilization of these phytochemicals is also becoming increasingly tempting for the food industry. However, it is critical to provide rigorous scientific evidence for biological activities of phytochemicals before their recommendation for diet supplementation.
The AA (FRAP and DPPH method)
The investigated extracts of rutabaga seeds, sprouts, and roots are shown in Table 1. The highest AA measured by FRAP method was observed in rutabaga sprouts in the range of 278.9–1149.1 mmol Fe2+/kg dry weight (DW). The lowest TAA were observed in rutabaga roots and seeds—29.14±2 and 81.9±5 mmol Fe2+/kg DW, respectively. Rutabaga sprouts activity depended on the time of their growth and light conditions. The peak value was reached on the 12th day. AA (FRAP method) in the case of 8 and 12 days of germination was significant (P<.05), and a substantial influence of availability of light on AA of sprouts was observed. Inverse dependence was observed in case of 10-day rutabaga sprouts—there was higher AA in sprouts harvested in normal light conditions than in darkness. The same observation was made for total polyphenol content. TAA of other kinds of sprouts changed during the time after seeding; amaranth and radish sprouts—decrease in AA, 16,18 quinoa sprouts—increase in AA. 16 AA of rutabaga roots was similar to the data shown by Halvorsen et al. 19 In comparison to scientific data on brassica vegetables and other vegetables, the presented data (recalculated into adequate units), considering rutabaga using the FRAP method, were higher than TAA of turnip, cauliflower, cabbage, cucumber, tomato, or potato. Results of the present study were close to the data obtained for radish, broccoli, and leek and lower than in brussels sprout, kale, red cabbage, spinach, or beetroot. 19 The highest TEAA value was observed in rutabaga sprouts in the range of 178–644 mmol Trolox/kg DW by the DPPH method. The lowest values were observed in rutabaga roots and seeds—32.9±7 and 71.45±5 mmol Trolox/kg DW, respectively (Table 1). During 12-day germination, TEAA (DPPH) in sprouts increased, and on day 12 after seeding, darkness (12DAS-N), reached the highest value. Light conditions did not significantly influence the AA activity in all cases. In 8DAS and 12DAS samples, AA activity was higher in sprouts harvested in darkness as opposed to 10-day sprouts. The opposite results were presented by Paśko et al. 16 with the AA (DPPH) on pseudocereal sprouts. Those grown in daylight were higher than those grown in darkness. Subsequent evaluation of antioxidant capacity of the investigated rutabaga sprouts revealed that the samples had significantly lower DPPH free radical-scavenging activity than radish sprouts harvested under exogenous plant hormone methyl jasmonate. 20 TEAA estimations of rutabaga sprouts (daylight [-L] and darkness [-N]) were the same by FRAP and DPPH methods—an increase of AA in sprouts harvested in darkness. In case of TP values in 12-day sprouts, the opposite effect was observed. TP tended to drop in darkness. The described effects may be associated with the presence of substances such as pigments, vitamins, or glucosinolates, which can be also involved in antioxidant reactions. Zieliński and Kozłowska found that the use of light conditions during germination of selected brassica seeds (rape seeds, white mustard, radish, and small radish) may influence the level of vitamin E. 21 The optimal sprouting time maximizing the synthesis of vitamin E was found to be 4DAS and 5DAS in daylight conditions. In darkness conditions, the best time of germination was found to be 3DAS for small radish and 4DAS for radish and rape seeds. With germination longer than 3–4 days and shorter than 7 days, the vitamin E content reached a stable level. A noticeable increase in vitamin C was observed by Frias et al. 22 in lentil sprouts after germination of 5 days.
Values represent the mean ± standard deviation (n = 4).
Statistical comparisons of the 8DAS and 12DAS samples revealed significant differences: 8DAS-L vs. 12DAS-L (* P < .05, ** P < .01, *** P < .001); 8DAS-L vs. 12DAS-N († P < .05; †† P < .01; ††† P < .001); 8DAS-N vs. 12DAS-N (# P < .05; ## P < .01; ### P < .001).
FRAP, ferric-reducing antioxidant power; DPPH, diphenylpicrylhydrazyl free radical method; DW, dry weight; TP, total phenolic compounds; GA, gallic acid; FF, free flavonoids; TF, total flavonoids; DAS, day after seeding; -L, daylight; -N, darkness.
Total content of phenolic compounds and flavonoids
Polyphenol compounds have long been recognized as a major contributor to the overall AA of vegetables. Rutabaga seeds, sprouts, and roots had a TP range of 5.1–125.7 mg gallic acid (GA)/g DW. The total content of polyphenols in seeds of rutabaga was obtained at the level of 6.9±0.4 mg GA/g DW. Sprouts of rutabaga had a significantly higher content of polyphenol compounds than seeds or roots. The content of TP increased significantly during sprouting (8DAS vs. 12DAS). The order of TP for all rutabaga sprouts was 12DAS-L (125.7±2) > 12DAS-N (99.85±2) > 10DAS-L (54±3) >10DAS-N (49.3±3)>8DAS-N (22.8±1.3)>8DAS-L (19.45±2.8 mg GA/g DW). TP content was higher only in 8 DAS in darkness, as opposed to 10 and 12 days of germination. It was observed that the availability of light did not significantly influence the TP content. Yuan et al. observed different changes in TP activity of radish sprouts during germination time (3, 5, 7 days). 18 In 5-day radish sprouts, TP content significantly decreased in comparison to 3 and 7 days of germination. Since this article is the first one to address the antioxidant effect of rutabaga sprouts in greater detail, no other scientific data are available for comparison. As compared with pseudocereal sprouts such as amaranth, quinoa 16 or buckwheat, 23 and sesame sprouts, 24 our results obtained with regard to TP content are 2.5–10 times higher depending on the kind of sprouts and the number of DAS. The mean TP content in rutabaga roots harvested in Poland was 5.1±0.25 mg GA/g DW. Our results are similar to the ones obtained by Clariana et al., who examined rutabaga roots cropped in Ireland. 25 On the other hand, Huang et al. presented about a thrice higher amount of total polyphenols in rutabaga roots from Alabama (USA). 26 Differences in TP content probably depended on the place of harvesting and varieties of rutabaga. It was previously observed by Cartea et al. in the total content of glucosinolates, group of biological active compounds, which, as well as polyphenols, had a beneficial effect on health. 27 Further examinations in this area are also needed. In comparison to rutabaga roots, the TP compounds of other vegetables from brassica family, that is, broccoli and kale, had two and four times higher content of TP, respectively. 28 Moreover, other popular vegetables in daily nutrition, such as potatoes or carrots, may have lower phenolic compound content than rutabaga; while tomatoes and green beans have similar TP compounds to rutabaga. 28
The contents of flavonoids (mg rutin/g DW) are presented in Table 1. The lowest content of flavonoids was in rutabaga seeds and roots, but it was the highest in sprouts. An increasing tendency in the amount of total compounds versus FFs was observed between days of breeding. The same trend was observed in case of brassica vegetables, such as broccoli, cabbage, and cauliflower. 15 According to Vinson et al., the strongest antioxidant activities were considered when free active compounds were present in vegetables. 15 Conditions of harvesting had no significant influence on the level of flavonoids in all sprout samples. However, there is a strong correlation in all sprouts between the results of all methods: DPPH versus FRAP (r=0.98; P<.0001), TP versus FRAP (r=0.95; P<.0001), TP versus DPPH (r=0.89; P<.002), DPPH versus TF (r=0.92; P<.001), DPPH versus FF (r=0.95; P<001), FRAP versus FF (r=0.97; P<.001), FRAP versus TF (0.96; P<.001), TP versus TF (r=0.98, P<.001), and TP versus FF (r=0.95, P<.001).
Hep G2 cell colonies morphology
The first stage of rutabaga extract investigations dealt with the observation of the influence of extracts on morphological changes of cells. After 24 h of incubation of cells with established concentrations of solvents or extracts with solvent, evident changes were observed in particular wells. To point out the differences, the micrographs are shown in Figure 1C–L. Microscopic observations revealed variations in cell density combined with changes in the morphology of cell colonies. Hep G2 cell colonies grown only in medium for 24 h were composed of a few cells with a typical epithelial-like morphology. The confluence was approximately 60% (Fig. 1A). In general, at lower concentrations of each extracted compound, the cells had typical morphology confluence (not shown). Cell colonies were distinguished by regular shape and confluences as observed for untreated cells. However, at higher concentrations, the cytotoxic effect of the extracts was observed as a decrease in cell proliferation, loss of typical cell shape, and colony forming as well as the confluence at the level of 20–35% (Fig. 1E–L). By contrast to the untreated cells, they were disrupted and damaged—a fact that was confirmed by data obtained in MTT test. The antiproliferative effect was even comparable to that obtained after addition of 20 mM/L of hydrogen peroxide to cells (negative control; Fig. 1B).
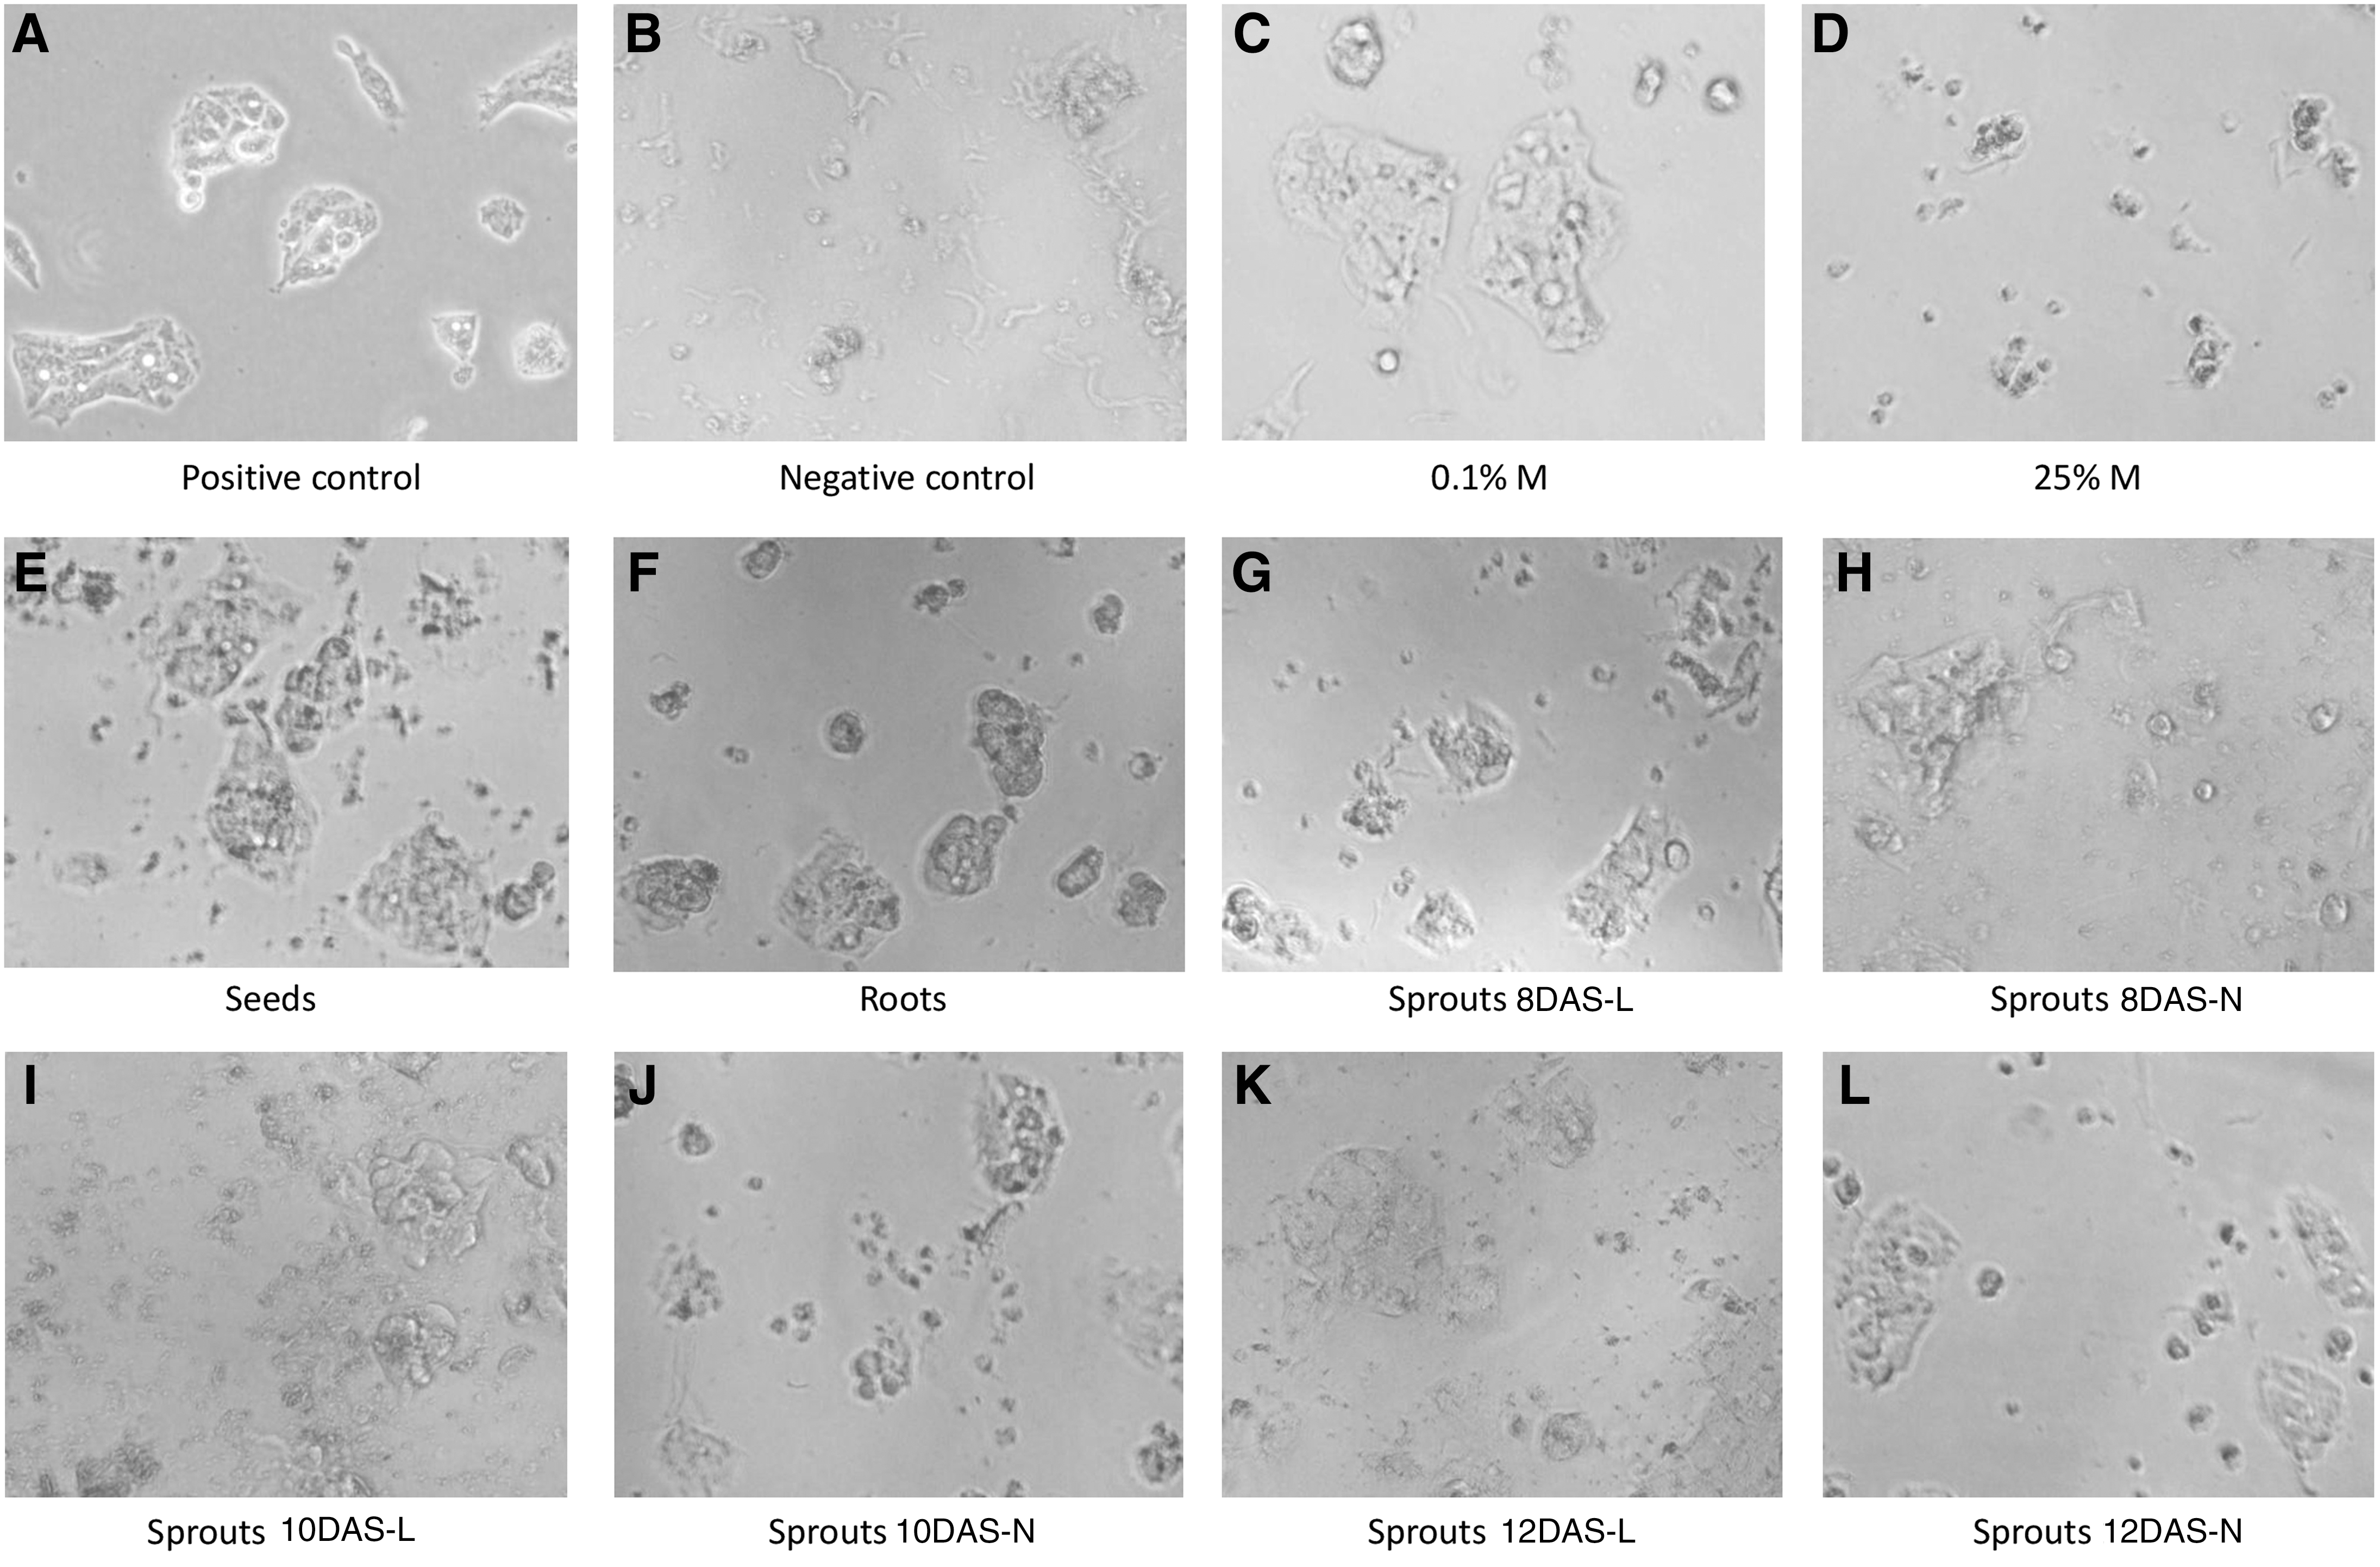
Morphological comparison of positive control of Hep G2 cell culture
In all conducted experiments, solvents did not change cells viability in low concentrations (methanol [M] from 0.1% v/v to 5% v/v; Fig. 1C). It is evident that the latter caused a more harmful effect to cells integrity than any other compound in high concentrations (25% v/v; Fig. 1D).
Cytotoxicity assays
What should be emphasized is the relevance of application of an appropriate solvent in cytotoxicity tests. The protective effect of brassica vegetables may be due to their content of polyphenols, in particular the high content of sulfur compounds—glucosinolates. Verhoeven et al. suggested that a high intake of such vegetables has a beneficial effect on the human body and may decrease the risk of cancer, particularly lung, stomach, colon, and rectal cancer. 29 Rutabaga root was an object of a population-based case control study as an element of dietary habits and risk of lung and gastric cancer. 30,31 Typically organic solvents are used for plant extracts and toxicity assessments. Therefore, it was of vital importance to probe their influence on final cytotoxic effect and, in parallel, experiments extraction solvent methanol was tested in order to avoid false findings in planned MTT cytotoxicity test. The obtained data revealed that high doses of solvent M (50% v/v) caused total disruption to CHO-K1 cells (100% of total destruction of cells by 2.5% Triton-X), while 10% M did not damage cells (7% of total destruction of cells by 2.5% Triton-X).
MTT assay
MTT assay confirmed that high doses (10 μg/μL) of evaluated extracts did not significantly change normal mammalian cells viability CHOK1 (Fig. 2). In order to check the effect in the tumor cell line, Hep G2 cells were incubated with rutabaga extracts and then, MTT cytotoxicity assay was performed (Fig. 2). The amount of MTT formazan generated by the Tricarbolic Acid Cycle decarboxylases in mitochondria of viable, biochemicaly active cells reflected metabolic activity of hepatoma cells. Results obtained in the MTT assay suggested that tested extracts were cytotoxic to tumor Hep G2 cells. As Figure 2 indicates, the most spectacular effect was observed for probes of sprouts (10 μg/μL). In case of all investigated rutabaga sprouts, about 40% decrease in cell viability was observed at dose 10 μg/μL. There were no significant differences between sprouts harvested in different conditions of the light or DAS. In probe, 8DAS-L caused more than 40% decrease in cell proliferation, 12DAS-N inhibited <35% cells proliferation. The data suggest that sprouts should be grown for at least 8 days for the best inhibitory effect. Rutabaga seeds caused lower cytotoxic activity (about 23%) in Hep G2 than sprouts. Roots of rutabaga also did not present strong cytotoxic activity in comparison with sprouts. The obtained results are in opposition to the results presented by Boivin et al., which emphasized high chemopreventive potential of rutabaga roots. 2
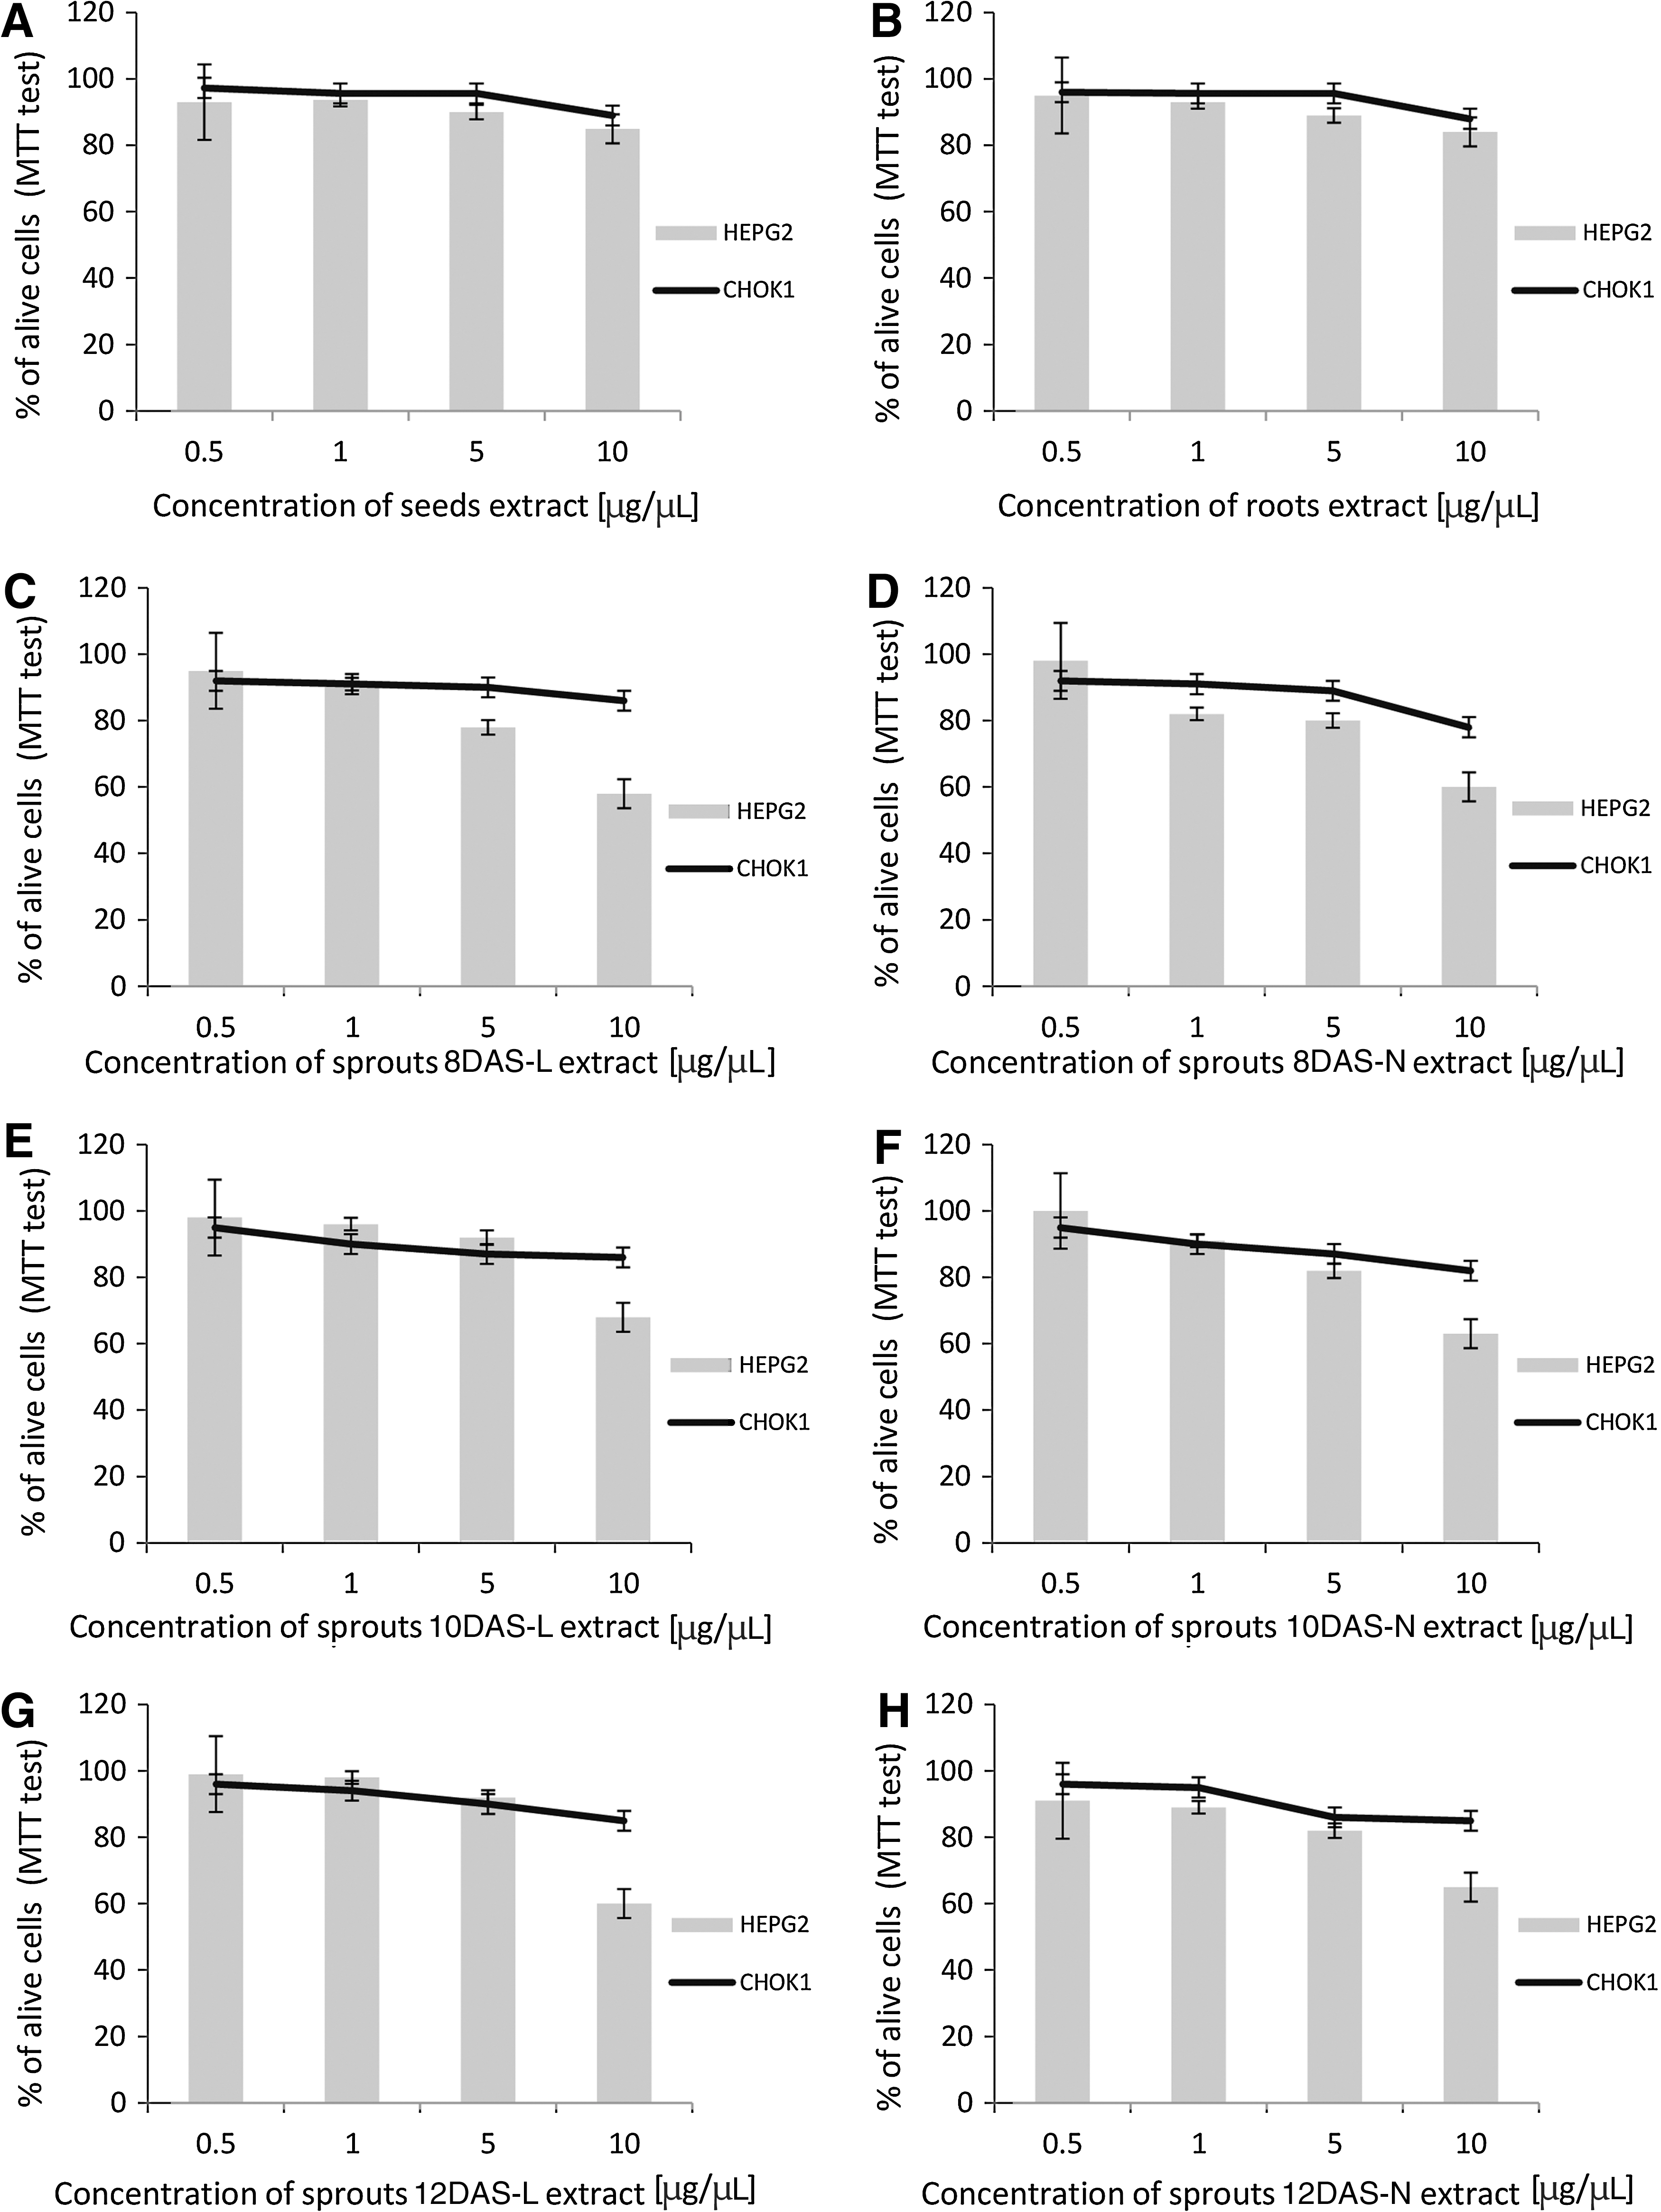
Effect of rutabaga extracts [seeds
Cell membrane integrity assay
During the next cytotoxicity analysis to make the antitumor effect more visible, a high dose (50 μg) was added in comparison with a low dose (5 μg). The viability of mammalian cells: CHO-K1 and Hep G2 after 24 h of incubation with tested compounds was assessed by a sensitive Luminescence ToxiLight BioAssay. Table 2 presents results expressed as the percentage of disrupted cells after incubation with each extract as compared with the total cell integrity loss caused by TritonX (2.5% v/v). For the all tested extracts, the influence on cell membrane (CHO-K1) was modest and similar to the effect of a solvent (DMSO, 2% v/v). Even with the highest amounts of extracts, which reached 50 μg of medium, no significant damage to CHO-K1 cells was observed. The data obtained with sensitive luminescence test confirm that rutabaga extracts are not toxic to normal mammalian cells. On the contrary, rutabaga sprouts 8DAS-L and 12DAS-L caused more than a 70% increase in cell membrane disruption.
The values are expressed as a mean percentage±standard deviation of three independent experiments. Solvent: dimethyl sulfoxide (DMSO; 2% v/v) 17±4.
Apoptosis and necrosis assay
Antiproliferative and cytotoxic effect of the tested extracts on Hep G2 tumor cell line was shown in Figure 2, Table 2. Cell membrane integrity test proved a previous observation that evaluated extracts of rutabaga in a high dose of 50 μg/μL (especially 8DAS-L) caused selective damage of cancer cell line. The next experiments attempted to distinguish between cell apoptosis and necrosis. These observations were shown in all cases in Figure 3. Concentration (50 μg/μL) of rutabaga seeds extract caused a remarkable decrease of not only CHO-K1 living cells but also Hep G2, which was a substantially interesting observation for future investigation. More than 90% of CHO-K1 cells were in apoptosis; in case of Hep G2 cells, about 48% were in a different state of apoptosis. Such an effect could be associated with a high concentration of diverse active compounds in seeds. The best results were obtained for the rutabaga sprouts (8DAS-L); these sprouts caused Hep G2 cells apoptosis in about 60% without a significant toxic effect on normal CHO-K1 cells, while unfortunately in the case of 12 day sprouts, especially those harvested in the light condition, negative effects were observed, such as an increase of Hep G2 and also CHO-K1 cells in late apoptose and necrosis state. Roots caused more than 50% apoptosis of Hep G2 cells, but this extract decreased viability of CHO-K1 cells. It was suggested that the length of germination of sprouts culture may probably influence the presence of sulfur compound as well as other substances that have cytotoxic effects. Potential chemopreventive effects of rutabaga sprouts could be associated with isothiocyanates content in this plant. A lot of isothiocyanates have been identified as strong inhibitors of cell proliferation and apoptosis-inducing agents, which presents the chance for therapeutic impact of malignant transformed cells. 32 Further scientific scrutiny is needed to assess this activity, because during sprouting time the amount of necrotic Hep G2 cells increased.
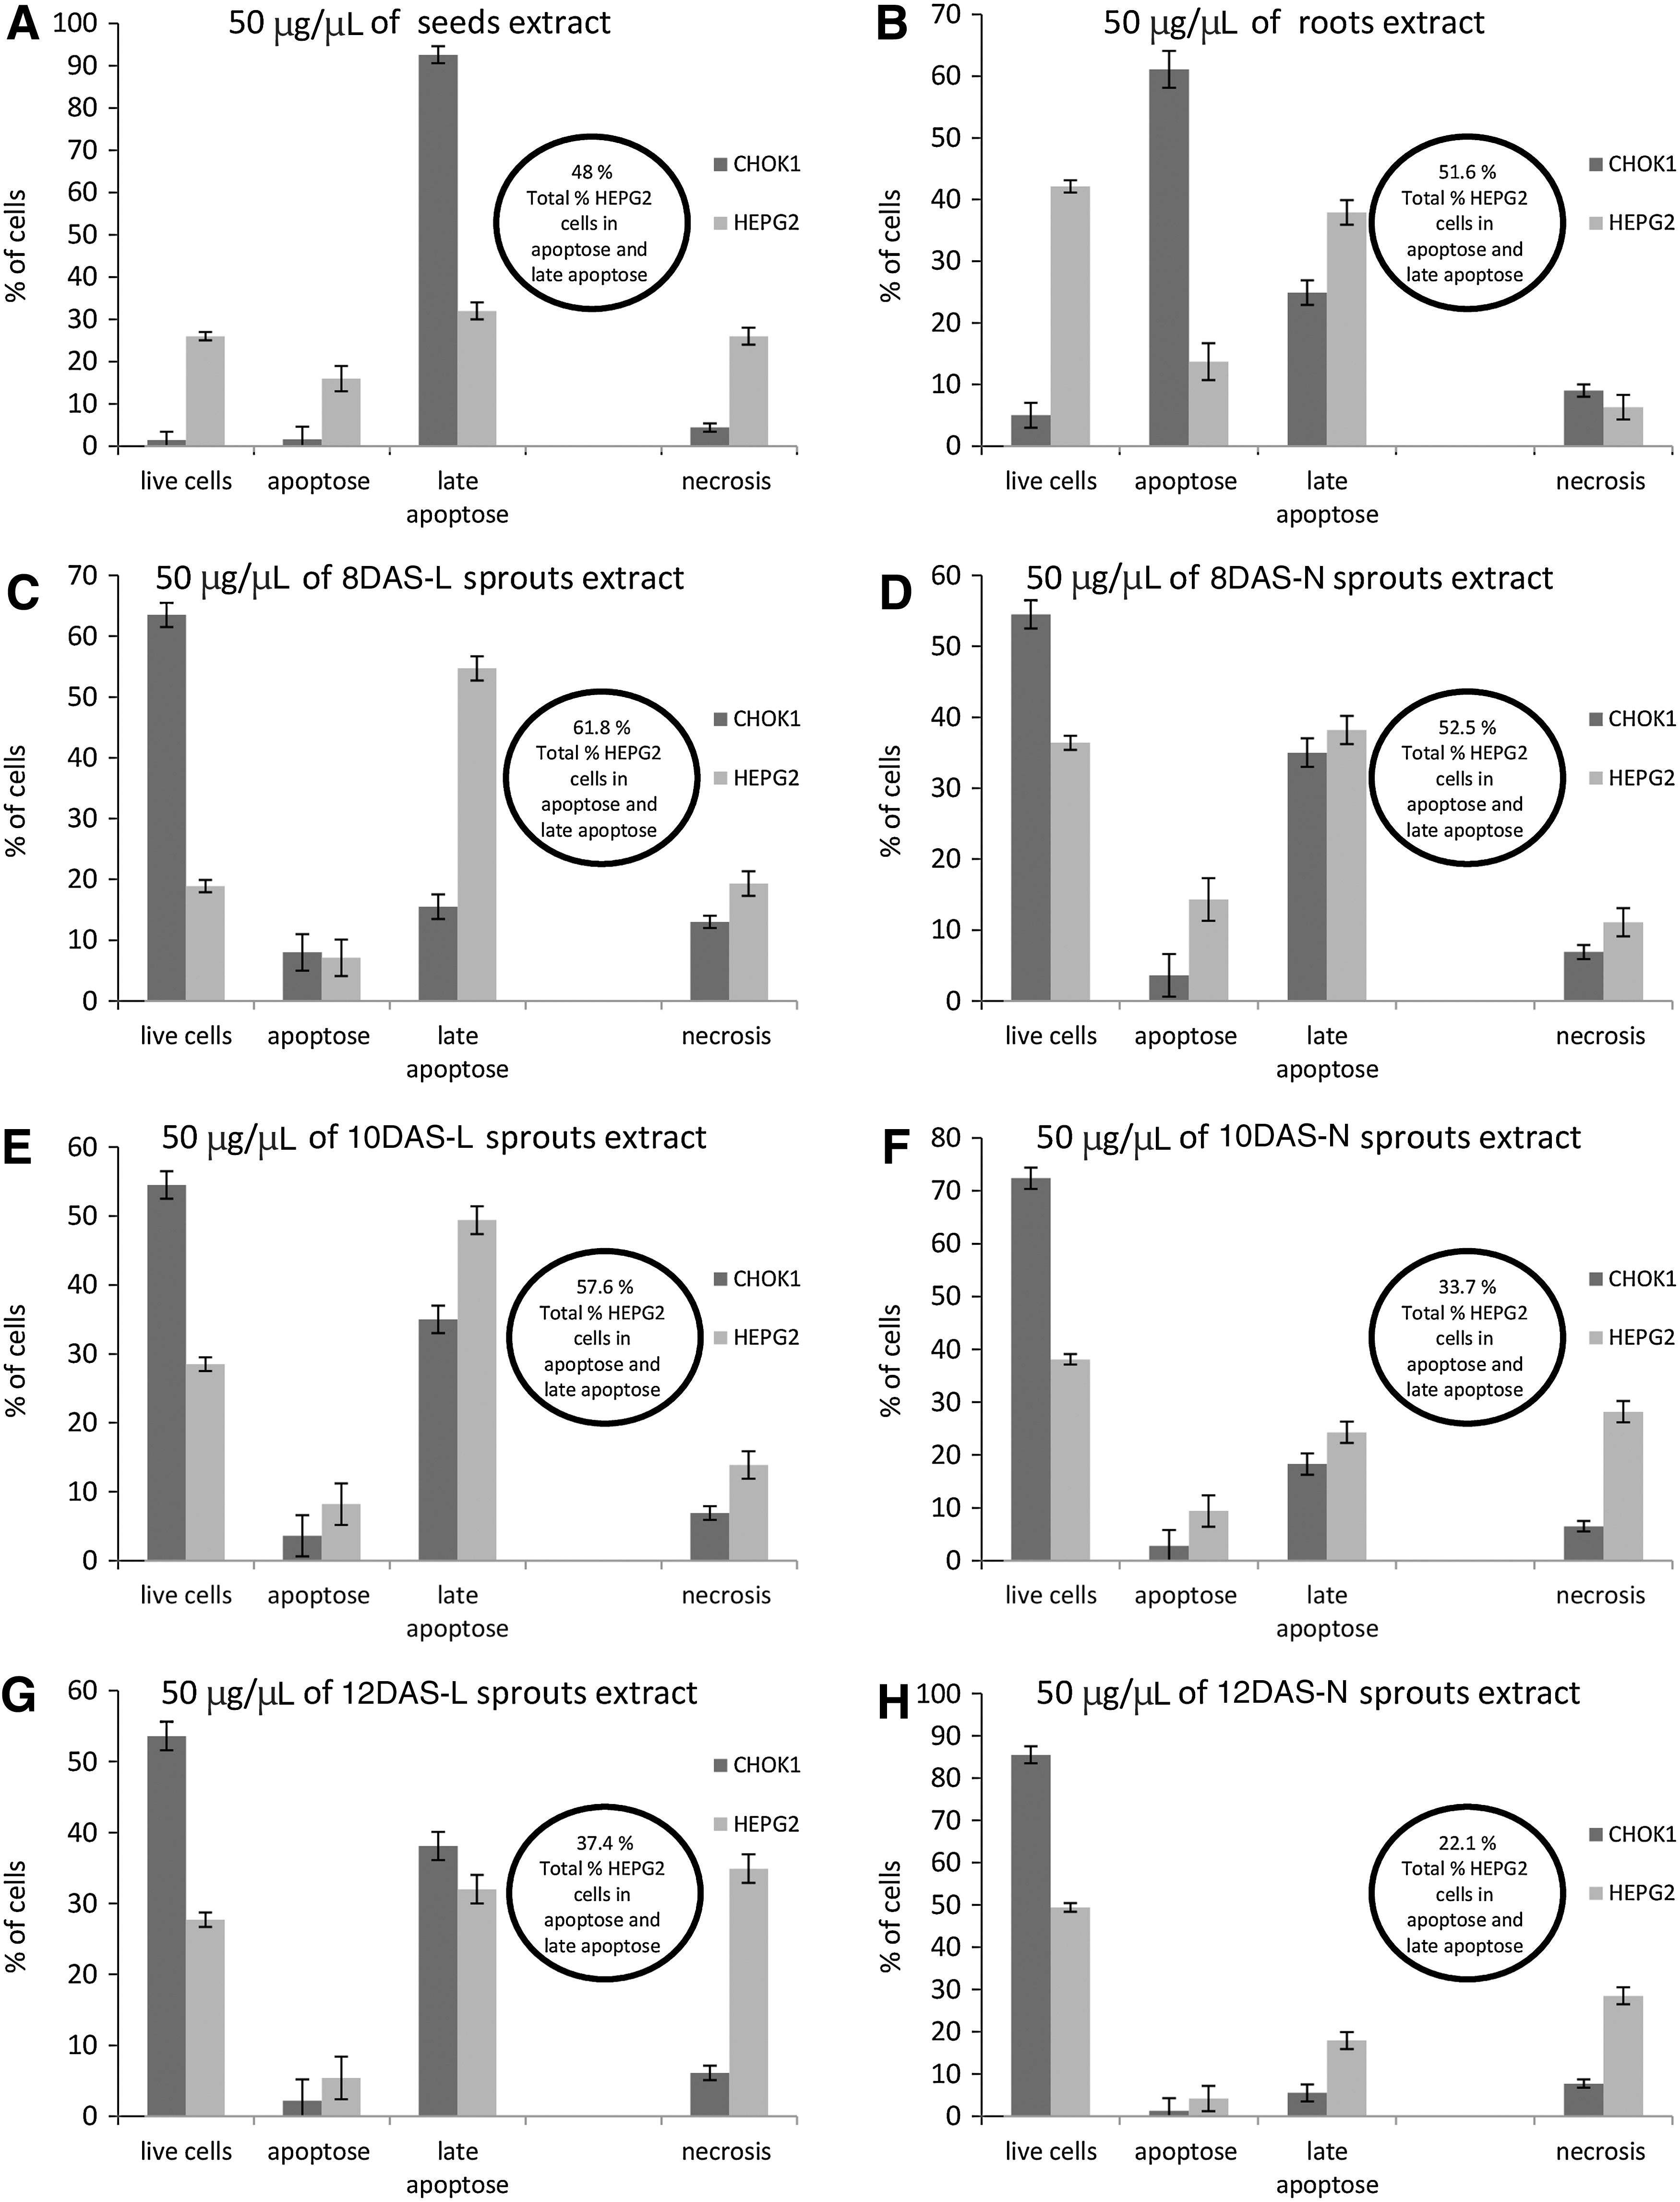
Mechanism of cell death after incubation of 50 μg/μL rutabaga extracts [seeds
Western blot analysis
Using Western blot analysis, the mechanism of cells death was confirmed. The apoptosis process was responsible for the observed effect and it was confirmed by the cytochrom C release into the cytoplasm (Fig. 4). A majority of studies have focused on the mitochondria-mediated intrinsic path of apoptosis induction by the sulfur compound observed in brassica products such as isothiocyanates, which is initialized by an alteration in the mitochondrial membrane permeability and cytochrome c release into the cytoplasm. Lamy 33 suggest that this release is mediated by mitochondrial membrane proteins of the Bcl-2 family, acting either pro-apoptotic (e.g., Bax, Bak, Bad) or anti-apoptotic (e.g., Bcl-2, BclxL). The subsequent recruitment and activation of caspase 9 leads to the cleavage of caspase 3 and internucleosomal DNA fragmentation. This process occurs under the premise of sufficient ATP to maintain the integrity of the cell and to provide the necessary energy for enzymatic degradation. 33
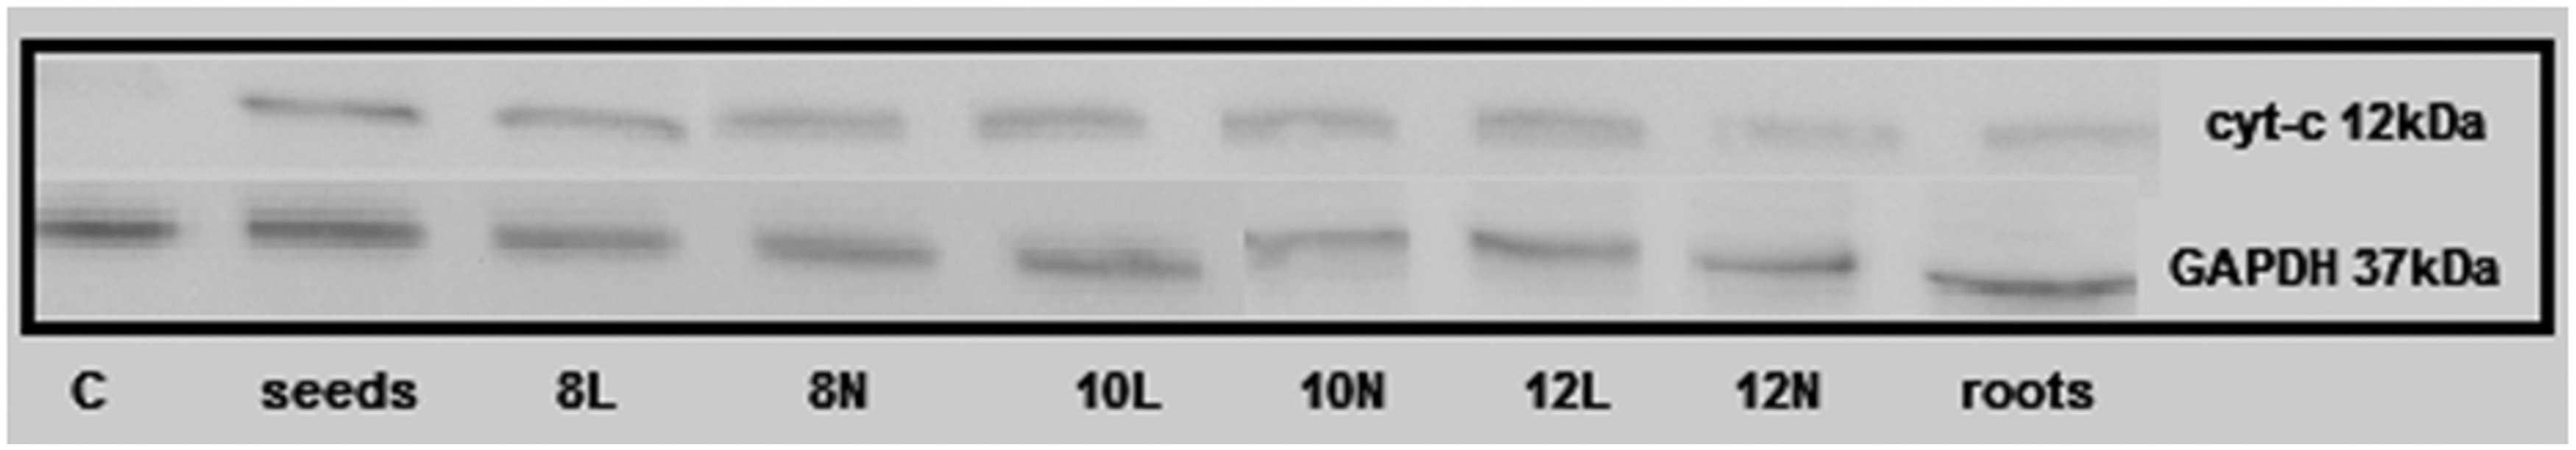
Western blot analysis of cytochrome c release to cytoplasm in Hep G2 cells after 24 h of incubation after addition of rutabaga extracts to controls vehicle. Three independent incubations were repeated.
Conclusions
The presented results have proved that rutabaga seeds, sprouts (especially harvested in the 12th DAS), and roots show relatively high AA. The results of the investigation have also shown that sprouts have a significantly higher AA than seeds and roots, which may be a result of the difference in the content of polyphenols and other compounds such as sulfur compounds.
In conclusion, rutabaga extracts manifested cytotoxic and antiproliferative activity to hepatoma cell line in vitro (especially 8 day sprouts), but had a negligible effect on growth, proliferation, and metabolism of normal cells, which may suggest that this effect was specific to tumor-derived cells. The morphology of eucaryotic cells is closely related to their function; therefore, observations of cell cultures with the light microscope provided extra information on how rutabaga extracts exert a cytotoxic effect in Hep G2 cells. Another successive analysis demonstrated that the evaluated extracts exerted tumor cell death mostly via apoptosis. It is highly possible that the effect was due to the high polyphenols, glucosinolates, and their derivates content that was previously suggested. It can be concluded that rutabaga sprouts, as alternative vegetables, may probably be used as food that safely provides nutritional value to the human diet.
Footnotes
Acknowledgments
Funding for this work was provided by Medical College, the Jagiellonian University (No K/DSC/000037; K/DSC/000805). The authors are grateful to Patrycja Jankowska for help in sprout harvesting and antioxidant analysis.
Author Disclosure Statement
None of the authors has financial or proprietary interest in any of the materials mentioned.