
Abstract
The aim of our work was to determine and to compare the possible antigenotoxic effect of methanolic extracts of common buckwheat (CB) and Tartary buckwheat (TB) flour, containing naturally present rutin (R), and quercetin (Q), and of R and Q in chemical form, against tert-butyl hydroperoxide (t-BOOH) induced DNA damage in human hepatoma cell line (HepG2). R and Q content of CB and TB flour extracts was determined by reversed phase-high performance liquid chromatography and antigenotoxic effect of flour extracts, R and Q was evaluated using the comet assay. R (100 μM) and Q (50 μM) decreased the extent of t-BOOH induced DNA damage for 51% and 67%, respectively. CB and TB flour extracts showed high antioxidant capacity and prominent genoprotective ability. CB extract containing up to 0.1 μM R decreased t-BOOH induced DNA damage for 34%, and TB extract containing up to 12.64 μM R, and 2.86 μM Q for 40%. The obtained results show high antigenotoxic activity of buckwheat and furthermore, they suggest that complex nutrient and flavonoid rich food products are more efficient in their health promoting effects compared to a single active substance.
Introduction
T
R and Q (sugarless form of R) are the major bioflavonoids in human diet. Flavonoids are phenolic compounds that are naturally present in fruits and vegetables and their consumption has been linked to decreased capillary fragility, 7 protection against heart disease and cancers. 8 Additionally, R, Q, and other flavonoids have antioxidant properties and may inhibit lipid peroxidation, 5 decrease capillary fragility associated with hemorrhagic changes, 9 lower cholesterol, 10 and reduce high blood pressure and the risk of arteriosclerosis. 11 Flavonoids are also considered to modulate mammalian enzyme activities, such as cytochrome P450, epoxide hydrolase, glutathione transferaze, DNA and RNA polymerases, and topoisomerase. 12 As plant secondary metabolites, flavonoids play a role in the protection of plants against ultraviolet radiation, pathogens, and herbivores. 13
Living cells are constantly exposed to reactive oxygen species (ROS) from endogenous and exogenous sources. Excessive amounts of oxidants cause cell damage 14 and contribute to occurrence of many degenerative human diseases, such as coronary heart disease, stroke, rheumatoid arthritis, and cancer. 15,16 Antioxidants naturally occurring in fruits and vegetables are reported to provide protection against these pathologies. 17
This study compares the ability of common (CB) and TB flour extracts, as well as of pure flavonoids R and Q to protect against DNA damage induced by tert-butyl hydroperoxide (t-BOOH) in human hepatoma cell line (HepG2 cells). This cell line was used because it retained inducibility and activities of several phase I and phase II xenobiotic metabolizing enzymes, 18 which are important in the metabolism of many substances, including flavonoids.
Materials and Methods
Chemicals
William's medium E, penicillin/streptomycin, fetal bovine serum (FBS),
TB, CB and wheat flour extracts
TB and CB were sown on faculty experimental field in Ljubljana, Slovenia in June and harvested in August. Seeds were air dried at the temperature of 30°C until constant weight and milled on Hawos Billy Mill 200 (Getreidemühlen Reisinger, Ybbsitz, Austria) to obtain TB and CB flour with particle size of <0.236 mm. Wheat (W) flour (type 850) was a commercial sample purchased from Mlinotest (Ajdovščina, Slovenia), flour particle size was <0.200 mm. All flour samples are deposited at University of Ljubljana, Biotechnical Faculty (Ljubljana, Slovenia). Wheat was chosen as a plant material similar to buckwheat in its composition and usage, but containing negligible or nondetectable concentrations of flavonoids and having poor antioxidant capacity compared to buckwheat. It was used to exclude the possible effects of the matrix in comparing the effects of flavonoids rich material.
To prepare methanolic extracts, 25 mL of 80% methanol (HPLC grade) in water was added to 1 g of each flour sample. The mixture was shaken at room temperature for 8 h at 250 rph. Extracts were filtered through filter paper (70 g/m2; Macherey-Nagel, Düren, Germany); aliquots were prepared and stored at −20°C until they were used.
Concentration of R and Q in flour extracts
W, CB, and TB flour extracts were prepared in three replicates and filtered through a syringe filter unit (0.22 μm; Millipore, Billerica, MA, Milford, Massachusetts USA). The filtrate was injected into a HPLC system that consisted of a HPLC chromatograph (Alliance 2695; Waters, Milford, Massachusetts, USA), a LiChroCART Purospher RP C18 column (5 μm, 250×4.6 mm; Merck, Darmstadt, Germany), and a DAD 2996 UV detector (Waters, Milford, MA, USA). The column temperature was 30°C. A gradient elution of the mobile phase was used with a flow rate of 1 mL/min. Solvent A was acetonitrile and solvent B was 0.1% phosphoric acid. The solvent gradient was as follows: 40% of solvent A for the first 3 min and 5% for the next 7 min. The presence of R and Q was detected at 365 nm and the concentration was calculated based on the calibration curve of R and Q standards prepared in methanol (HPLC grade). 19
Free-radical scavenging activity (DPPH assay)
Antioxidant activity of W, CB and TB flour extracts and of R and Q was determined based on the ability of the antioxidants to act as radical scavengers towards the stable free radical DPPH according to Brand-Williams et al. 20 assay. DPPH stock solution (250 μg/mL) was prepared in methanol (Spectranal) and stored at 4°C in a dark place. Immediately before the analysis, 1:10 dilution of the stock was made with methanol. Reaction mixtures containing 1 vol.% of each extract, 100 μM R and 50 μM Q and DPPH working solution (25 μg/mL) were prepared. Absorbance at 515 nm was measured after 10 min with Shimadzu spectrophotometer (710; Shimadzu, Kyoto, Japan). The antioxidant activity was calculated as the percentage of DPPH scavenged as follows:
Inhibition (%)=(A 0−A 1)/A 0×100,
where A 0 represents the absorbance of the control reaction (without extracts, R or Q) and A 1 the absorbance in the presence of the W, CB and TB flour extracts, R or Q. Two independent experiments with four replicates each were performed and the results were expressed as the percentage of DPPH scavenged.
Human hepatoma cell line (HepG2 cells)
HepG2 cells were provided by Prof. Firouz Darroudi, Department of Radiation Genetics and Chemical Mutagenesis (University of Leiden, Leiden, The Netherlands). Cells were grown in William's medium E containing 15% FBS, 2 mM
In all assays performed on HepG2 cells, 1 vol.% of methanol in growth medium was used as the vehicle control and methanol concentration in growth medium containing extracts, R and Q for cell treatment was adjusted to 1 vol.% at all tested concentrations.
Cytotoxicity assay
Cytotoxicity of W, CB, and TB extracts, as well as of R and Q was determined by the use of MTT assay, as described by Mossman 21 with minor modifications. 22 The assay measures the conversion of MTT to insoluble formazan by dehydrogenase enzymes of intact mitochondria of living cells. HepG2 were seeded onto 96-well microplate at a density of 7000 cells/well. After 24 h the medium was replaced by complete growth medium containing flour extracts (0.0625, 0.125, 0.25, 0.5, and 1 vol.%), 100 μM R or 50 μM Q, and the cells were treated for 24 h. At the end of the exposure, MTT at final concentration of 0.5 mg/mL was added to each well. After 3 h the medium was removed and formazan crystals were dissolved in DMSO. In each well, the optical density (OD) of the solution was measured against blank (a well with DMSO) at 570 nm (the formazan absorption peak) and 690 nm (measurement of the medium turbidity caused by cell debris) with a microplate spectrofluorimeter (Tecan Genios, Maennedorf, Switzerland). The OD difference OD570−OD690 is proportional to the concentration of formazan, which is proportional to the number of viable cells. Viability of cells was determined by comparing the relative formazan concentration (OD570−OD690) of the treated cells with that of cells treated with solvent only (1 vol.% methanol in growth medium). Five individual wells were measured per treatment point.
Genotoxicity testing
The potential genotoxicity of W, CB and TB extracts, R and Q was evaluated using the comet assay. HepG2 cells were seeded into 12-well microtiter plates (Corning Costar Corporation, Corning, NY, USA) at a density of 40,000 cells/mL. After 24 h of incubation at 37°C in 5% CO2 and humidified atmosphere, William's E growth medium was replaced with a fresh medium, containing W, CB, and TB extracts (0.04, 0.2 and 1 vol.%), R (4, 20 and 100 μM) or Q (2, 10 and 50 μM). Cells were incubated for additional 4 and 24 h at 37°C in 5% CO2. A negative control (nontreated cells), solvent control (1 vol.% methanol in growth medium) and positive control (BaP, 30 μM) were included in each experiment. At the end of the exposure (4 and 24 h), cells were harvested and DNA damage was determined using the comet assay as described by Singh et al. 23 with minor modifications. 24
Antigenotoxic effects against t-BOOH induced oxidative DNA damage
To evaluate possible antigenotoxic effects of W, CB and TB extracts, R and Q against DNA damage induced by ROS-inducing agent t-BOOH, the cells were pretreated with growth medium containing 0.04, 0.2 and 1 vol.% of each flour extract or with 4, 20 and 100 μM R and 2, 10 and 50 μM Q for 24 h at 37°C and 5% CO2. Subsequently, the medium was removed and cells were washed with PBS and exposed to 400 μM t-BOOH in cold 1×PBS for 20 min. At the end of the exposure time, cells were harvested and DNA damage was determined with the comet assay.
Comet assay
The comet assay was performed as described by Singh et al. 23 Briefly, 30 μL of cell suspension was mixed with 70 μL of 1% low melting point agarose and immediately added to fully frosted microscope slides precoated with a layer of 1% normal melting point agarose. Cells were then lysed (2.5 M NaOH, 0.1 EDTA, 0.01 M Tris and 1% Triton X-100, adjusted to pH 10) for 1 h at 4°C. Afterwards they were rinsed with distilled water, placed in electrophoresis buffer (1 mM EDTA, 300 mM NaOH, pH 13) for 20 min to allow DNA unwinding, and then electrophoresed for 20 min at 25 V and 300 mA. Subsequently, the slides were neutralized with 0.4 M Tris buffer (pH 7.5), stained with ethidium bromide (5 μg/mL) and analyzed with fluorescence microscope (Nikon Eclipse 800). Images of 50 randomly selected nuclei per slide were analyzed with image-analysis software Comet Assay IV (Perceptive Instruments, Bury St Edmunds, United Kingdom). The percentage of tail DNA was used as the measure of DNA damage. Three independent experiments were performed per each treatment condition.
Statistical evaluation
Student's t-test was used for statistical evaluation of the DPPH and MTT assay data, to compare mean values of DPPH scavenging capacity (%), and OD570–690 values of the treated cells against those of the control, respectively. P<.05 was considered as statistically significant. For statistical evaluation of the comet assay results analysis of variance (nonparametric analysis of variance, Kruskal-Wallis test) was used to analyze differences between treatments within each experiment. Dunn's multiple comparison test was used for the evaluation of differences between control (solvent control, which was 1% methanol) and sample groups; *P<.05; **P<.01; ***P<.001 was considered as statistically significant.
Results and Discussion
R and Q content in flour extracts
The content of R and Q in W, CB and TB flour extracts was determined by reversed phase–HPLC. The results show (Fig. 1; Table 1) that TB contained the highest amount of R and Q, while W flour extract did not contain R and Q. Results are in agreement with those obtained by other authors. 5,19
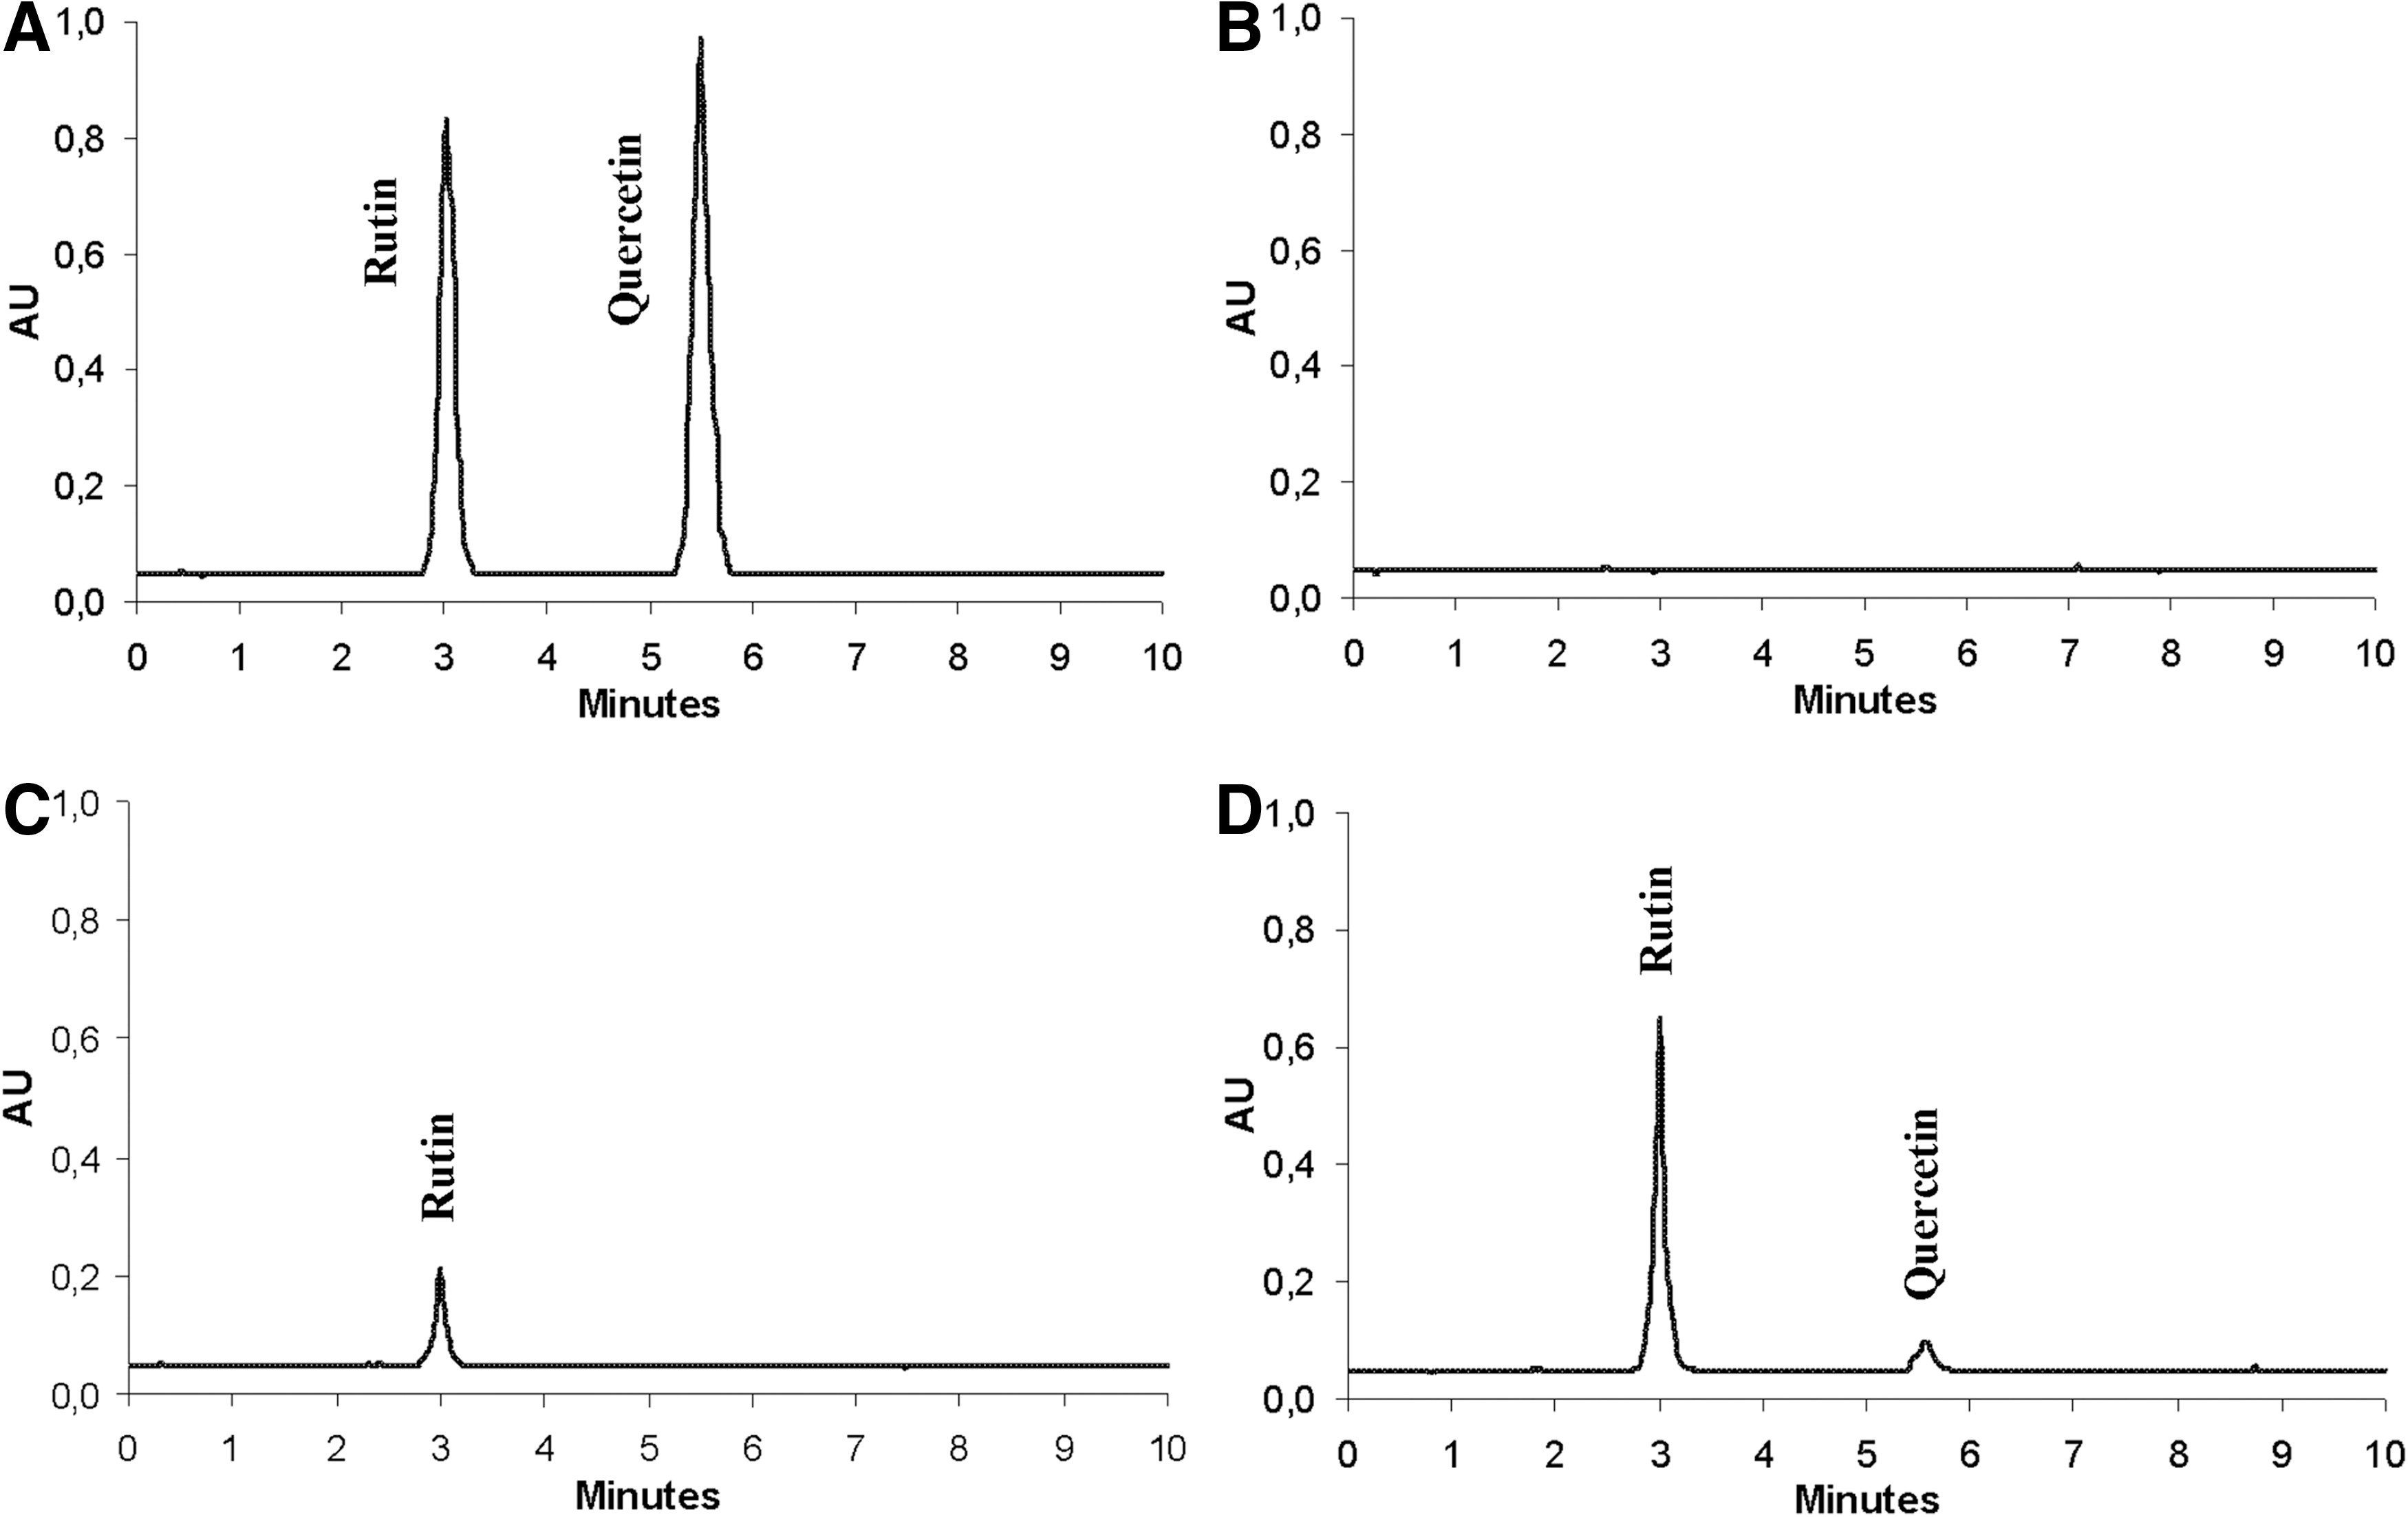
High performance liquid chromatography chromatograms of
Results are given as mean±standard deviation of three replications.
For better comparison with pure R and Q concentrations, results are also expressed in μM concentrations.
R, rutin; Q, quercetin; W, wheat; ND, not detected; TB, Tartary buckwheat; CB, common buckwheat.
Although or maybe just because TB contains high amounts of R and Q, it is not a popular food globally, since it has a bitter taste due to the high content of flavonoids. Its use is limited mainly to the Asian countries, but it was also cultivated in larger amounts in Europe some decades ago, because it was easy to grow in harsh conditions, such as high altitude, rainy, and cold summers and did not require any special attention. Due to its bitter taste and the lack of information about its high nutritional quality it was replaced with other crops. But recently, as functional value of TB products is better known, its growing and utilization is increasing also in Slovenia, Bosnia and Herzegovina and in Sweden, for example.
Antioxidant activity
Results of antioxidant capacity analysis with DPPH assay confirmed very high DPPH scavenging capacity of 100 μM R and 50 μM Q, 83.6% and 90.1%, respectively (Fig. 2). Higher radical-scavenging capacity of Q in comparison to R has been reported also by Kim et al. 25 TB flour extract at 1 vol.%, containing 12.64 μM R and 2.86 μM Q had the highest antioxidant activity among flour extracts (35.6%). CB flour extract at 1 vol.% containing 0.1 μM R showed a 21.7% of DPPH inhibition, while W flour extract with nondetectable Q and R showed no DPPH scavenging capacity. Antioxidant activity of CB and TB extracts was relatively high (Fig. 2) compared to R and Q (100 and 50 μM, respectively), although the extracts contained much lower concentrations of these two flavonoids. This could be due to the presence of other substances in CB and TB extracts (such as phenolic acids, proteins, etc.), contributing to the antioxidative activity of the extracts. For example, rutin–ovalbumin complex formation was observed to improve antioxidative activity and DNA protection against hydroxyl radicals, in comparison to R alone. 26 Higher antioxidative activity of TB in comparison to CB or W was also reported by authors. 19,27,28

DPPH scavenging capacity of W, CB, and TB flour extracts (1 vol.%), R (100 μM) and Q (50 μM). CB extract contained 0.1 μM R, TB extract contained 12.64 μM R and 2.86 μM Q, while W extract contained nondetectable concentrations of R and Q. Results are given as means±standard deviation. DDPH, 2,2-Diphenyl-1-picrylhydrazyl; W, wheat; TB, Tartary buckwheat; CB, common buckwheat; R, rutin; Q, quercetin.
Cytotoxic and genotoxic potential
The viability of HepG2 cells exposed to W, CB and TB flour extracts (0.0625, 0.125, 0.25, 0.5 and 1 vol.%), as well as to R (100 μM) or Q (50 μM) for 24 h was not significantly affected (data not shown). Cell growth medium with the highest concentration of extract present (1 vol.%) contained 12.64 μM R and 2.86 μM Q with TB and 0.1 μM R with CB. Since 1 vol.% of extract in growth medium showed no cytotoxic effects, it was chosen as appropriate for further analysis. Our results for cytotoxicity of 100 μM R and 50 μM Q support those obtained in the study of Ramos et al., 29 who observed no cytotoxic effect in HepG2 cells exposed to 100 μM R or 50 μM Q for 24 h. Results of our study concerning cytotoxicity of R and Q in HepG2 cell line are also in agreement with Kim et al. 25 Based on these results, 100 μM R and 50 μM Q were chosen as the highest tested concentration for further experiments.
Although polyphenols are known antioxidants, some data suggest that flavonoid compounds can also behave as prooxidants, depending on the concentration and free radical source. 30 Moreover, when taken in excessive amounts, some flavonoids, including Q, have also proven to be genotoxic in bacteria and mammalian test systems. 31 Therefore, before studying the protective effect of the three flour extracts and pure R and Q against t-BOOH induced DNA damage, their eventual DNA damaging activity was evaluated using the comet assay. The induction of DNA strand breaks was determined at noncytotoxic concentrations of W, CB, and TB extracts (0.04, 0.2 and 1 vol.% in growth medium), R (4, 20 and 100 μM) and Q (2, 10 and 50 μM) after exposure of HepG2 cells for 4 and 24 h (Figs. 3 and 4). The results showed that none of the tested samples induced increased DNA damage at applied conditions.
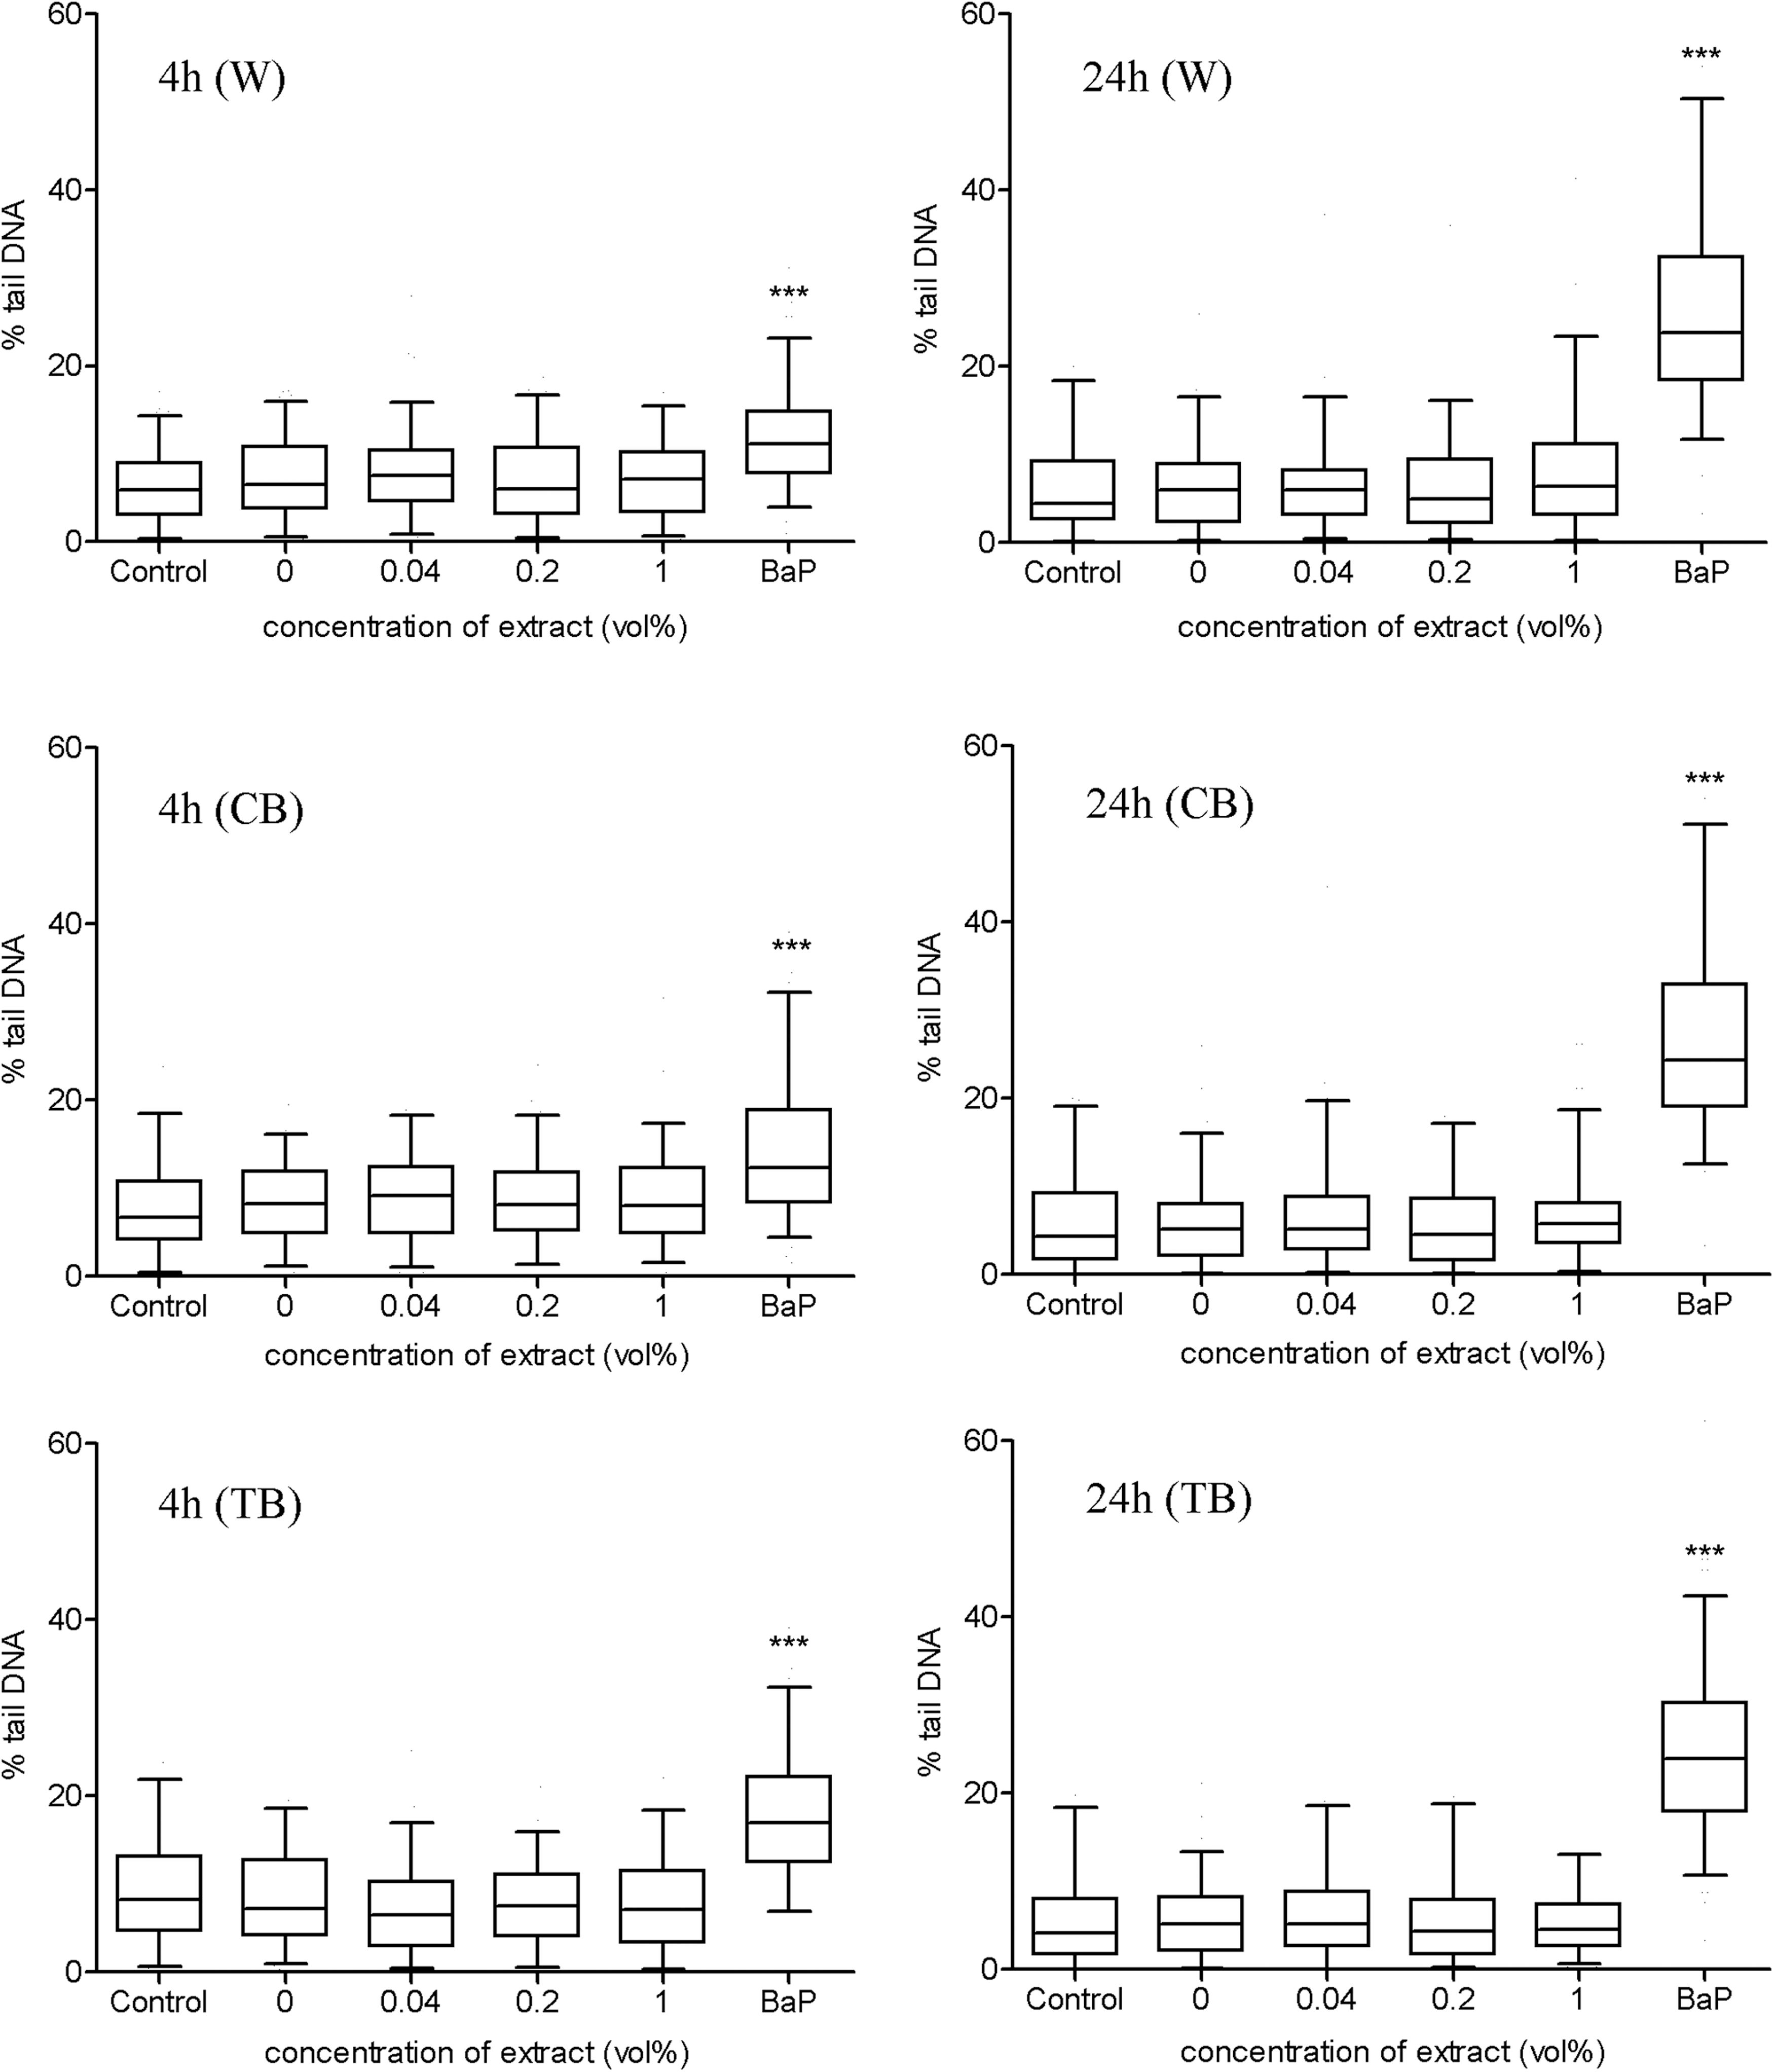
The effect of W, CB and TB flour extracts (1 vol.%) on the formation of DNA strand breaks in HepG2 cell after 4 and 24 h of exposure time, determined by the comet assay. The level of DNA strand breaks is expressed as the percentage of DNA in the comet tails. Data are presented as quartile box plots. The edges of the box represent the 25th and 75th percentiles, the median is a solid line through the box, and the error bars represent 95% confidence intervals. ***P<.001 when compared to treatment with solvent only (1 vol.% of methanol in growth medium).
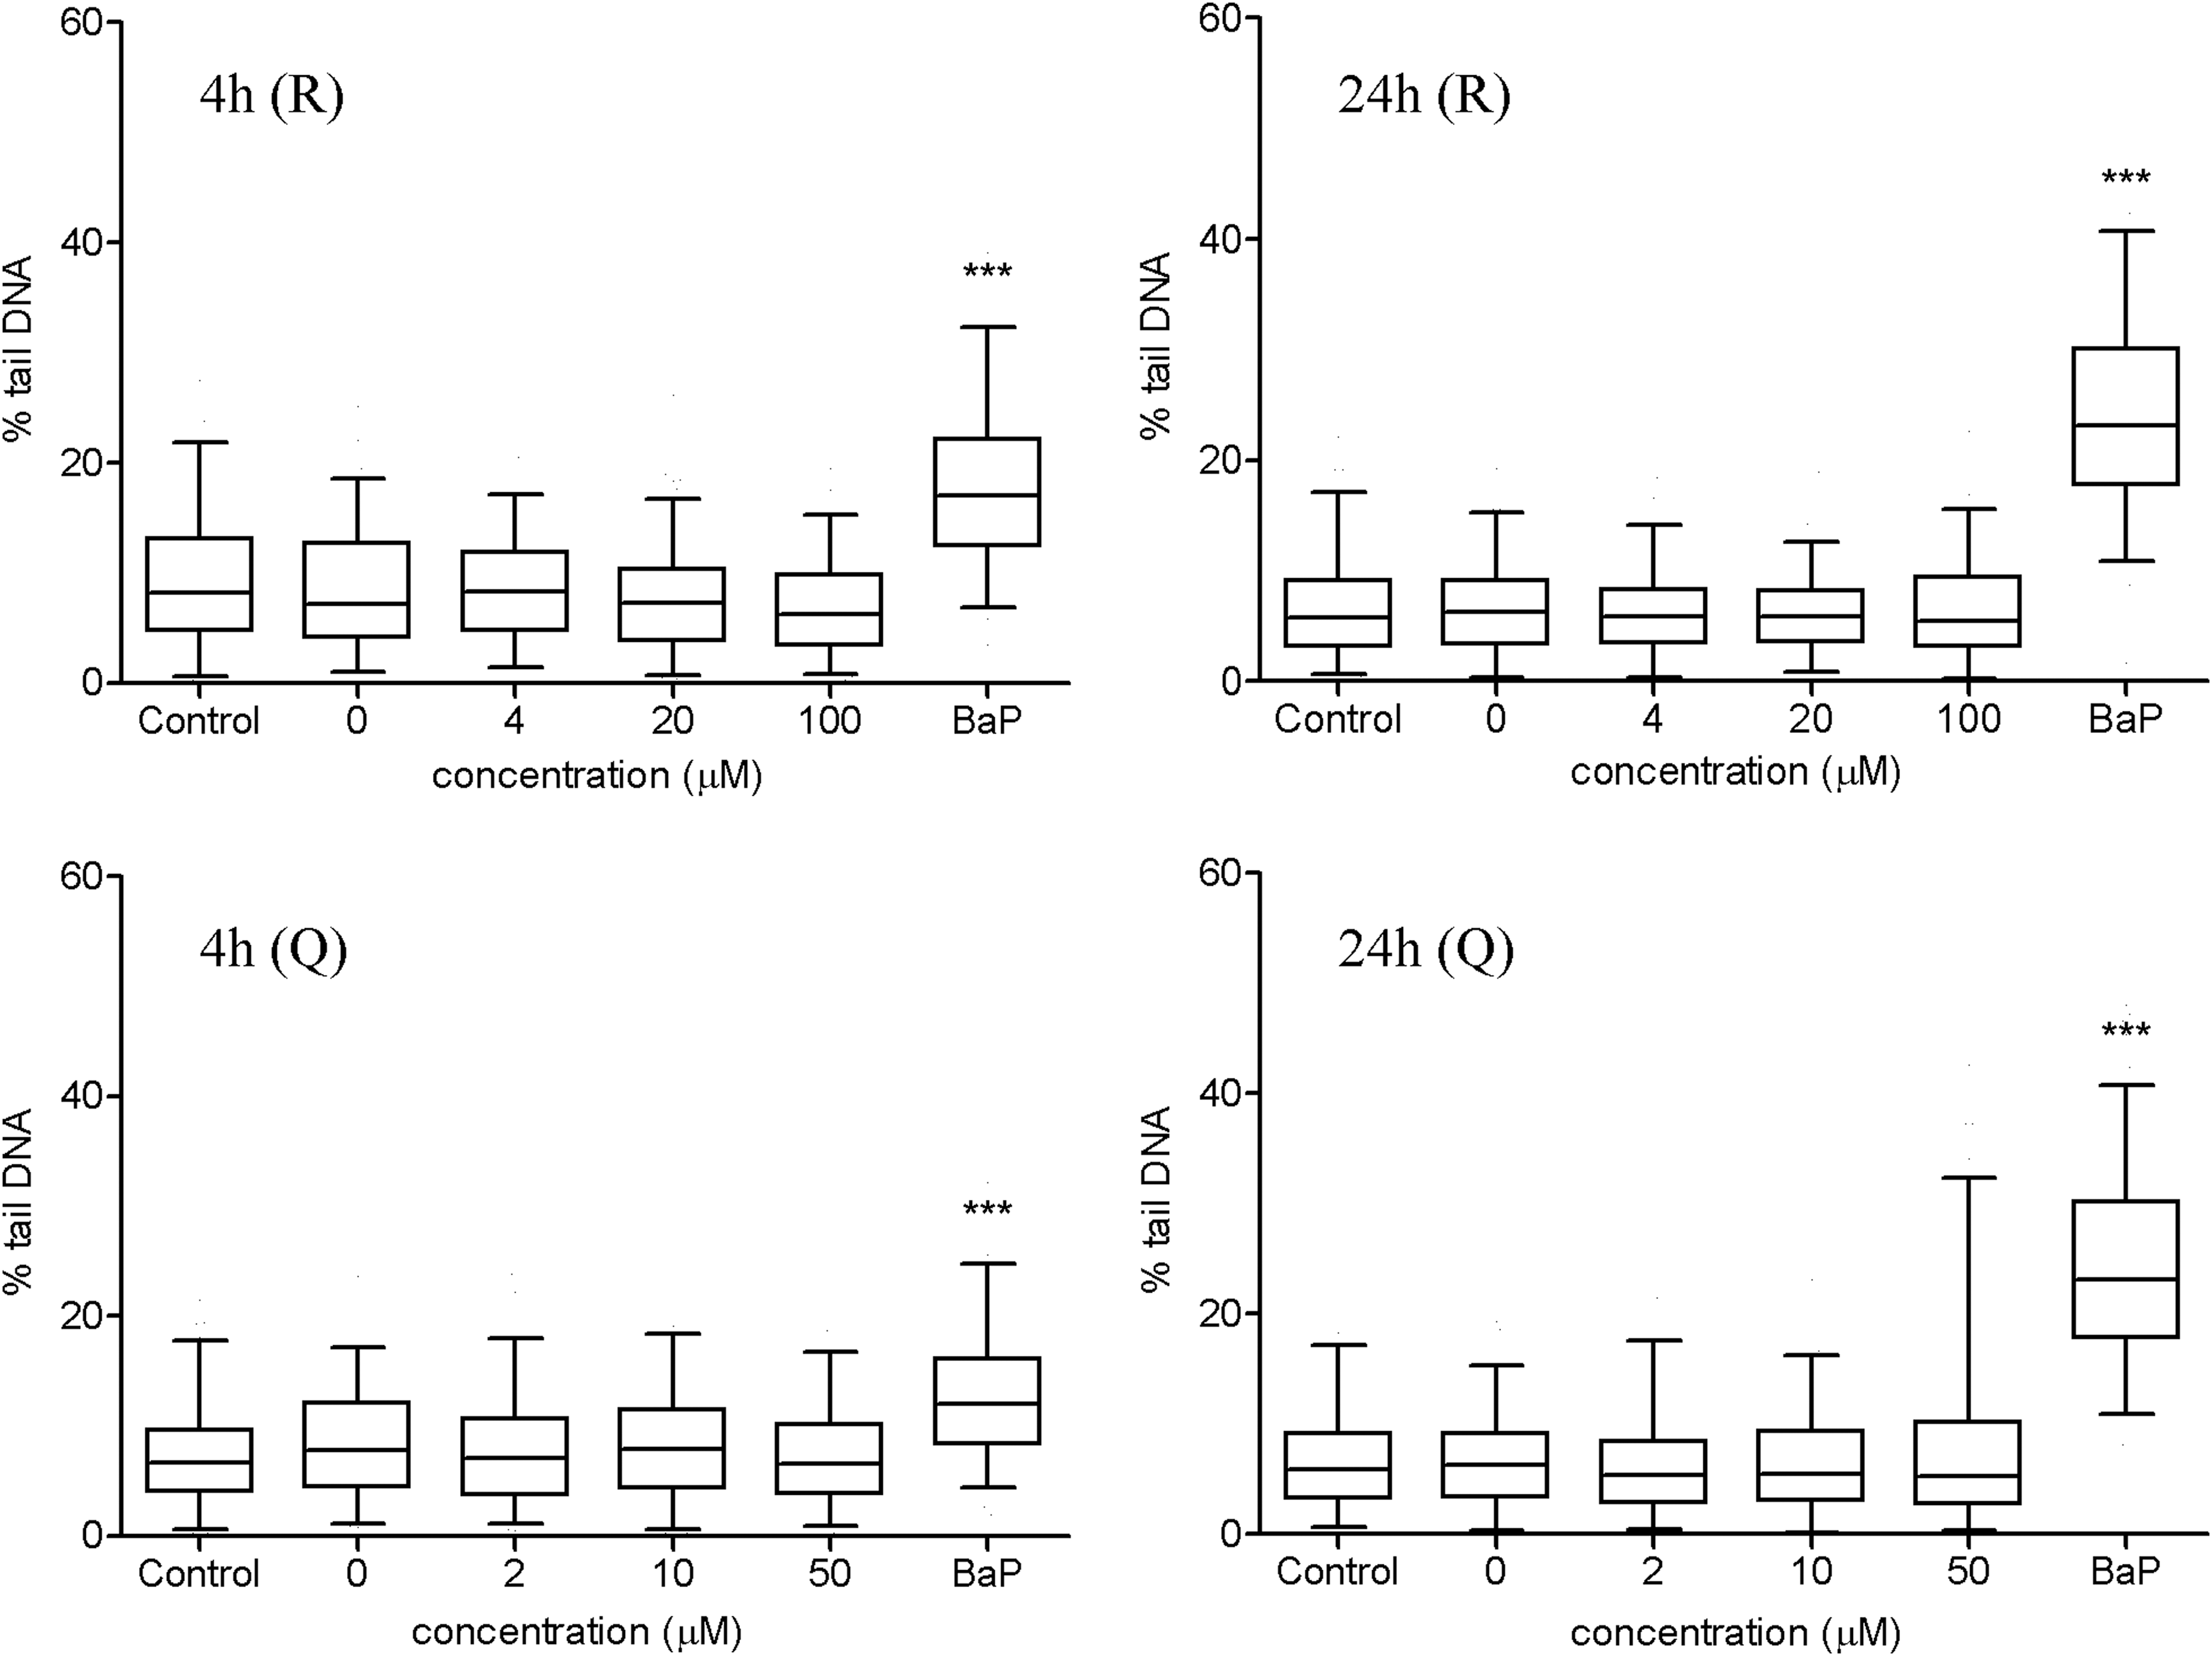
The effect of R and Q on the formation of DNA strand breaks in HepG2 cell after 4 and 24 h of exposure time, determined by the comet assay. The level of DNA strand breaks is expressed as the percentage of DNA in the comet tails. Data are presented as quartile box plots (for details see Fig. 3). ***P<.001 when compared to treatment with solvent only (1 vol.% of methanol in growth medium).
Protective effects against t-BOOH induced DNA damage
The results showed that pretreatment of HepG2 cells with W extract (0.04, 0.2 and 1 vol.%) had no protective effect against t-BOOH induced DNA damage (Fig. 5), indicating that W flour does not contain constituents with antigenotoxic activity. On the contrary, CB and TB extracts showed statistically significant protective activity against t-BOOH induced DNA damage at all tested concentrations (Fig. 5). However, the protective effect of the extracts against t-BOOH induced DNA damage was not dose dependent in the concentration range used in this study. On average, CB extracts reduced t-BOOH induced DNA damage for 34%, and TB extract for 40% (Fig. 5).
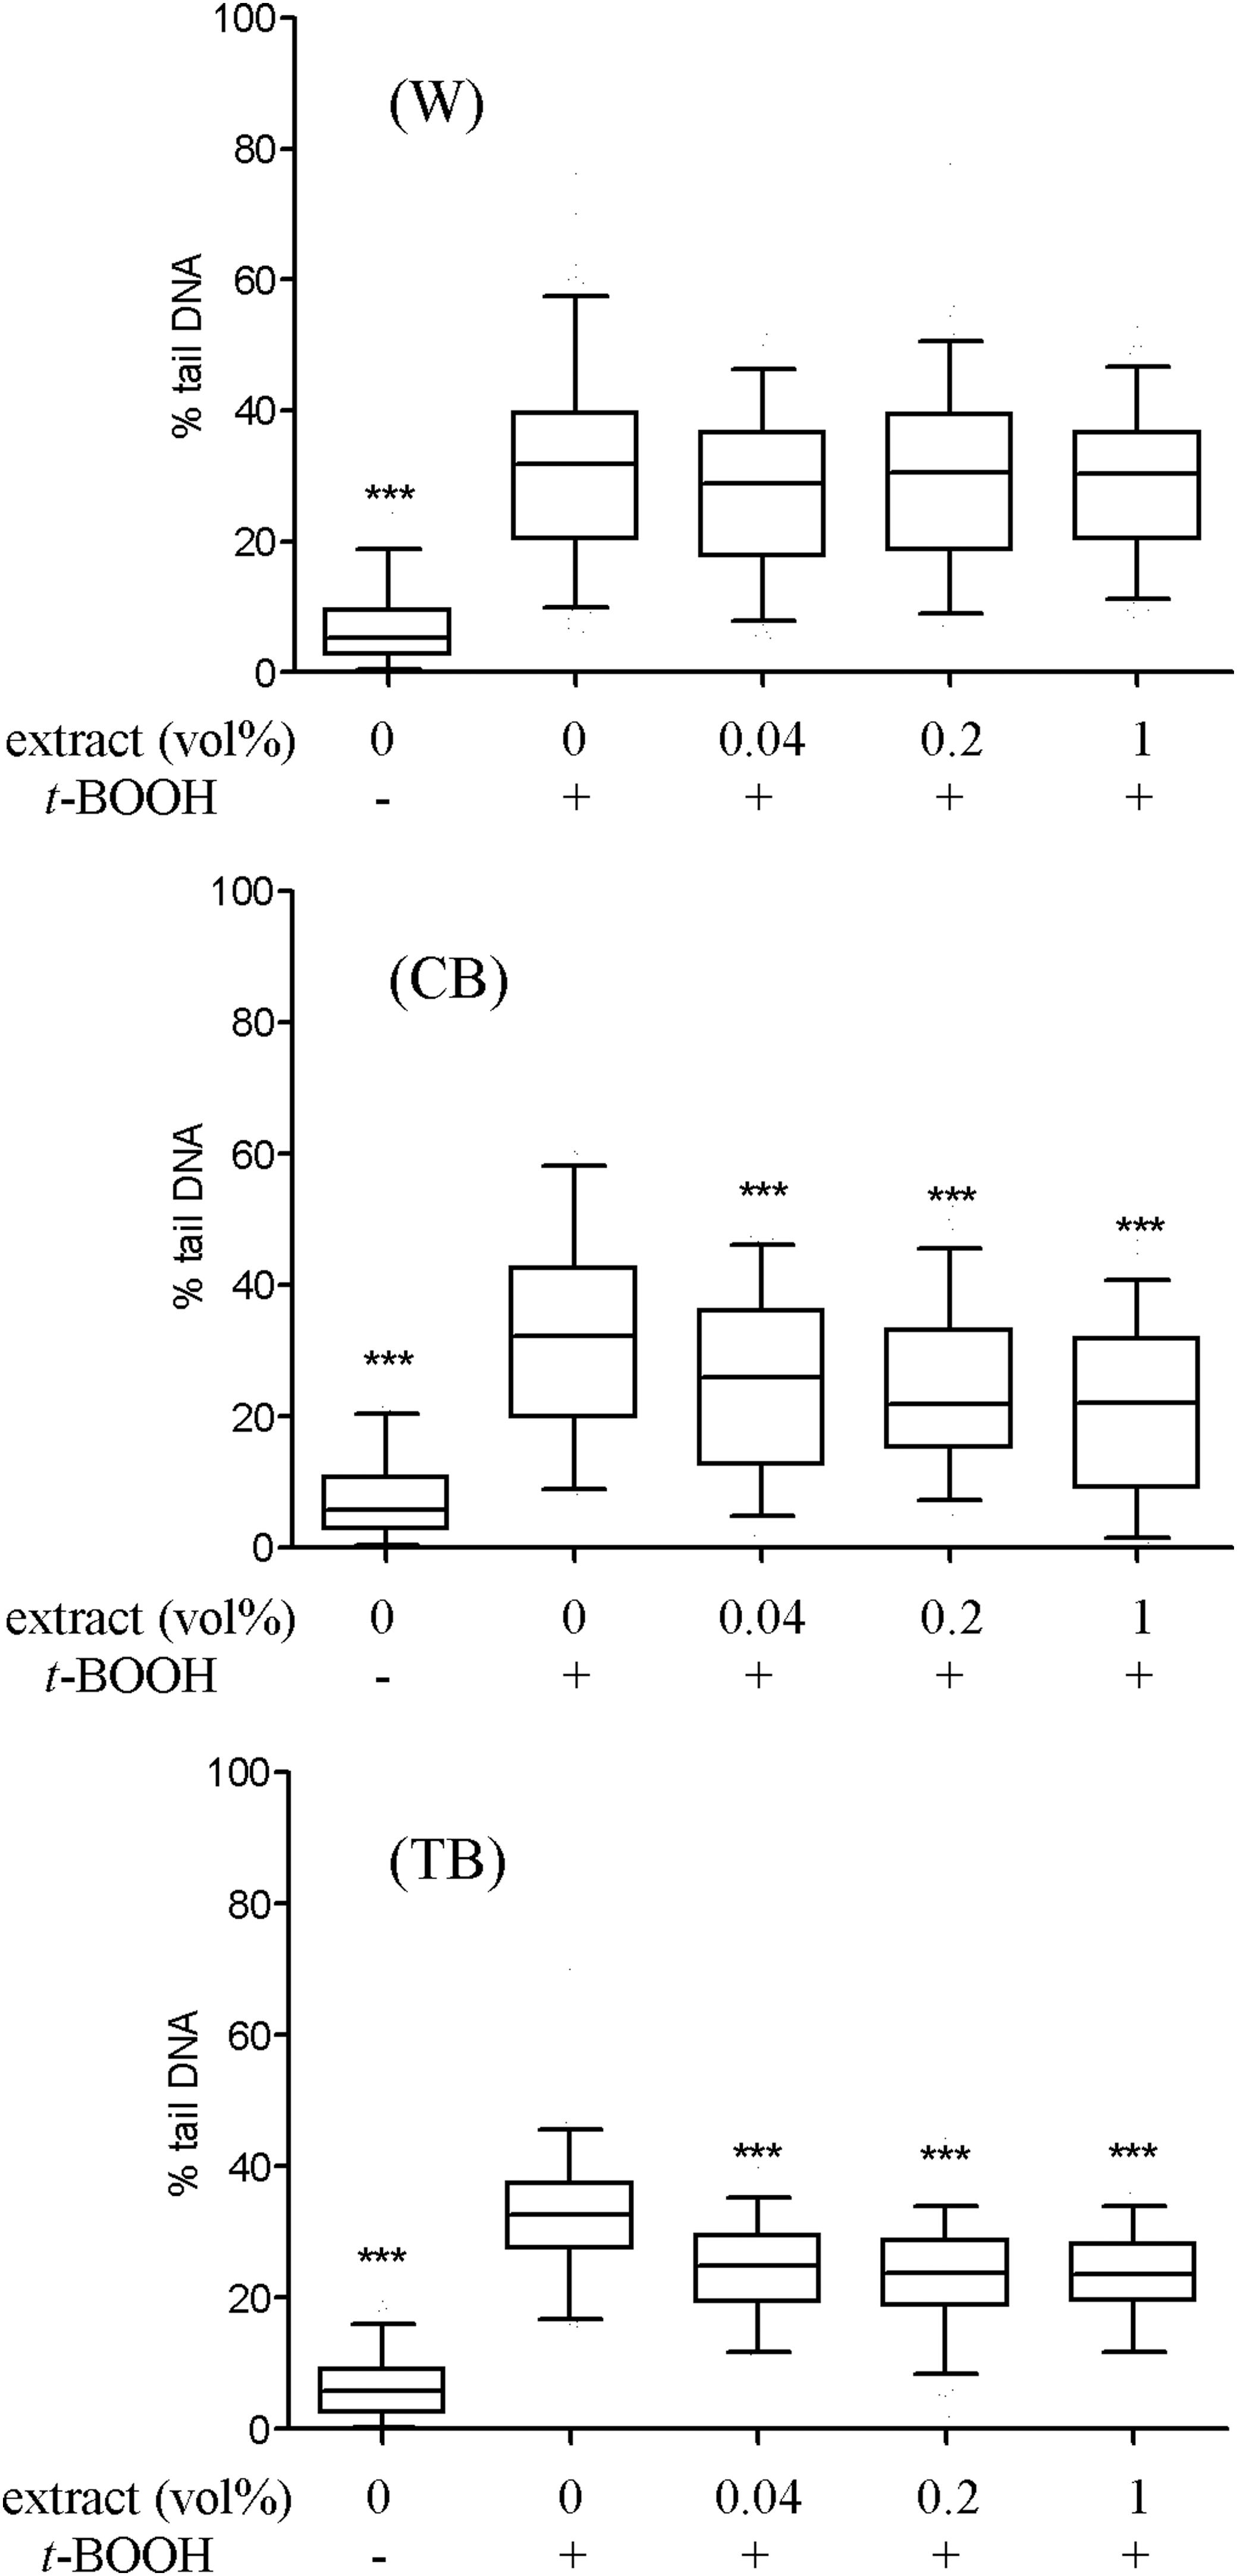
The protective effect of W, CB, and TB flour extracts against t-BOOH (400 μM) induced DNA damage in HepG2 cells, determined by the comet assay. The level of DNA strand breaks is expressed as the percentage of DNA in the comet tails. Data are presented as quartile box plots (for details see Fig. 3). ***P<.001 when compared to treatment with solvent only (1 vol.% of methanol in growth medium). t-BOOH, tert-butyl hydroperoxide.
Results in Figure 6 showed a clear dose dependent protective effect of R and Q against t-BOOH induced DNA damage. Pretreatment of HepG2 cells with 100 μM R decreased DNA damage for 51% and with 20 and 4 μM R for 34% on average. After pretreatment of cells with 50 μM Q, the amount of DNA strand breaks was reduced for 67%, while pretreatment with 10 and 2 μM Q decreased the DNA damage for 39% (Fig. 6). The reason for higher protective abilities of Q (50 μM), although at lower concentrations as R (100 μM), could be due to the poor permeation of R through the cell membrane, as it carries the disaccharide moiety. 32 The observed effectiveness of Q is in agreement with observations of other researchers. 25,33,34

The protective effect of R and Q against t-BOOH (400 μM) induced DNA damage in HepG2 cells, determined by the comet assay. The level of DNA strand breaks is expressed as the percentage of DNA in the comet tails. Data are presented as quartile box plots (for details see Fig. 3). ***P<.001 when compared to treatment with solvent only (1 vol.% of methanol in growth medium).
Similar to our results, Ramos et al. 29 observed antigenotoxic effect of Q, where 50 μM of Q decreased t-BOOH (200 μM) induced DNA damage in HepG2 cells for 29%, but on contrary to our results, they observed no protective effects of R (at concentrations up to 100 μM). On the other hand, the study by Aherne and O'Brien 35 demonstrated protective effects of both R (50 μM) and Q (50 μM) against t-BOOH (200 μM) induced DNA damage in Caco-2 cells, with Q having a stronger protective effect than R.
Protective effects of common and TB groats 27 and sprouts 28 against oxidative stress and oxidative DNA damage, with TB having a stronger protective effect most probably due to the higher R and Q content, were observed previously; 27,28 however, to the best of our knowledge, our study is the first to evaluate protective effects of methanolic flour extracts of Tartary and common buckwheat against t-BOOH induced DNA damage in HepG2 cells and to compare the protective ability of both buckwheat type flour extracts with the protective ability of two most abundant phenolic substances found in buckwheat flour (R and Q) in their chemical form.
To conclude, both CB and TB extracts had a strong protective effect against t-BOOH induced DNA damage in HepG2 cells, despite the different R and Q content; CB extract (1 vol.%) contained 0.1 μM R and TB extract (1 vol.%) contained 12.64 μM R and 2.86 μM Q. Moreover, the protective ability of TB extract (1 vol.%) was comparable to the one of pure R and Q in higher concentrations (20 and 2 μM, respectively) and CB extract (containing 0.1 μM of R) had a similar protective effect against t-BOOH induced DNA damage as 4 μM R. In addition, results of the present study show that the protective effect of complex mixture of polyphenols, together with other constituents as present in whole plant material, against t-BOOH induced DNA damage is higher than the effects of pure R and Q. Based on these conclusions, we are conducting further research on the activity of other substances present in CB and TB extracts, which are not as abundant as R and Q, but have a potential synergistic effect or a significant contribution to antigenotoxic properties of CB and TB extracts. Results presented in this article also suggest that certain food products are more efficient in their health promoting effects compared to a single isolated active substance and that buckwheat (especially Tartary) could be recommended to be included in the diet more often.
Footnotes
Acknowledgments
The study was financed through projects P1-0245, J4-3618, J4-4224, and Young Researchers Funding Program (Maja Vogrinčič), supported by Slovenian Research Agency.
Author Disclosure Statement
All the authors declare no conflict of interest.