




Abstract
This work studied the influence of culture medium composition and pH on exopolysaccharide (EPS) production by Pleurotus sajor-caju and validates the antitumor activity of the produced EPSs and of the mycelial biomass (intracellular polysaccharides [IPSs]) against Sarcoma 180 (S180) cells. The effect of the initial concentrations of (NH4)2SO4, yeast extract and soy peptone on EPS production by P. sajor-caju was studied in shake flasks. A bioreactor was used to evaluate the pH values and the initial CaCO3 and glucose concentrations. Extracts of EPSs (PE1) and IPSs obtained through two different separation processes (PM1 and PM2) were tested on mice inoculated with S180 cells. A medium containing 2.5, 1.0, and 1.0 g/L of (NH4)2SO4, yeast extract and soy peptone, respectively, provided the highest EPS concentration (0.6 g/L). The use of pH 4.0, 1.0 g/L CaCO3 and 20 g/L initial glucose concentration enhanced EPS productivity (3.84 g/L per hour). The PE1 extract promoted the highest reduction of S180 growth (86%), followed by the PM2 extract (80%); growth reduction was dose-independent for both substances. This work provides information about culture medium and conditions that enhanced the production of extracellular polysaccharides by P. sajor-caju. The results can contribute to the search for new bioactive products bringing novel aspects to the medical and pharmaceutical areas.
Introduction
F
Research has been conducted to identify the best medium composition and the best cultivation conditions for exopolysaccharide (EPS) production by various fungi species because these parameters vary depending on the genus and species, composition of the culture medium, and culture conditions. 13 –17
First phase of this work was designed to study the influence of culture medium composition [initial concentrations of (NH4)2SO4, yeast extract, soy peptone, and glucose, as well as the presence of calcium ions] and pH on the EPS production by Pleurotus sajor-caju in batch culture. Second phase of the work has been designed to validate in vivo antitumor activity against Sarcoma 180 (S180) cells of: EPSs; water-soluble polysaccharides isolated by hot water from mycelium biomass and mycelial biomass free of lipids.
Materials and Methods
Microorganism and maintenance
P. sajor-caju CCB 019 was obtained from the Center for Basidiomycete Cultivation of the University of São Paulo. The strain was grown in wheat dextrose agar (WDA) medium 18 and stored under refrigeration (4°C).
Evaluation of the nitrogen source: assays in shake flasks
Assays for defining the initial (NH4)2SO4, yeast extract and soy peptone concentrations were performed in accordance with a 23 factorial design (Table 1). Experiments were carried out in 500 mL Erlenmeyer flasks containing 100 mL of culture medium named POL (of polysaccharides) by Cavazzoni and Adami 19 due to its suitability for the production of polysaccharides by fungi. The composition of POL medium was: 2.0 g/L of MgSO4·7H2O, 1.0 g/L of K2HPO4, and 20.0 g/L of glucose, The concentrations of (NH4)2SO4 (2.5 or 5.0 g/L), yeast extract (purchased from Oxoid Microbiology Products) (1.0 or 2.0 g/L), and soy peptone (0.5 or 1.0 g/L) in POL medium were varied in each experiment (Table 1). The flasks were sterilized, inoculated with two 8 mm diameter agar discs containing mycelium, and incubated at 30°C and agitated at a rate of 120 per min for 7 days in a B. Braun Certomat U shaker. All experiments were carried out in triplicate.
Evaluation of the culture medium pH and initial glucose and CaCO3 concentrations: assays in bioreactor
The assays for defining the pH (3.0, 4.0, or spontaneous pH evolution), the presence or absence of CaCO3 (1.0 g/L) and the initial glucose concentration (20 and 60 g/L) were conducted in batch culture in a B. Braun bioreactor, Biostat® B model containing 4 L of modified POL medium [2.5 g/L of (NH4)2SO4; 0.2 g/L of MgSO4·7H2O; 1.0 g/L of K2HPO4; 1.0 g/L of yeast extract; 1.0 g/L of soy peptone] defined in the assays in shake flasks. pH was controlled using solutions of NaOH 6 M and H3PO4 6 N.
The inoculum was prepared in 2 L Duran flasks containing POL culture medium with the following composition (in g/L): (NH4)2SO4 5.0; MgSO4·7H2O 0.2; K2HPO4 1.0; yeast extract 2.0; soy peptone 1.0; glucose 20, at an initial pH of 6.5–7.0. 14 The flasks were sterilized, inoculated with all the mycelium obtained from a Petri dish after 7 days growth, and incubated at 30°C and 120 agitations per min for 6 days. 20
The best conditions determined in each assay were used in subsequent experiments, in the following order: pH, CaCO3 and initial glucose concentration. All cultures were incubated at 30°C, 300 agitations per min, and 0.25 L per min air flow, generating an initial volumetric oxygen transfer coefficient (K La) of 15 per hour. 20 Experiments were carried out in duplicate.
Analytical methods
The biomass concentration was determined by dry weight at 60°C for 48 h. The glucose concentration in the culture medium was determined by the enzymatic glucose-oxydase-peroxidase method. 21 EPS was extracted by treating the fermented broth samples with acetone cooled to 8°C, at an acetone to sample ratio of 3:1 (v/v). 22 After 24 h of refrigeration (4°C), the samples were centrifuged at 4500 g for 5 min, and the precipitate was washed twice with an acetone–ethanol–distilled water solution at a ratio of 3:1:1 (v/v/v). 19 The washed precipitate was dissolved in 72% H2SO4, and the total sugar content was determined using the phenol sulphuric method. 23
Kinetic parameters calculation
The maximum EPS concentration (ΔP max, g/L) was calculated using ΔP max=(E max−E 0), where E 0 and E max are the EPS concentrations at the beginning of cultivation and at the final process time (t, in hours) when the EPS concentration reaches its maximum value, respectively. The yield factor of glucose for EPS (g/g) was calculated using Y P/S=ΔP max/(S 0−S max), where S 0 and S max are the glucose concentrations at the beginning of cultivation and at the final process time (t), respectively. To calculate the global and maximum productivity (mg/L per hour), QP=ΔP max.1000/t and QPmax=ΔP mE.1000/t mE were used, respectively, where t mE denotes the maximum EPS productivity time and ΔP mE is the EPS concentration at t mE. The same methodology was used for calculating the kinetic parameters related to the biomass (ΔX, Y X/S, QX, and QXmax).
Bioactive compounds for in vivo antitumor test
The culture broth and the mycelial biomass were separated by filtration. EPS were obtained using the method described by Pokhrel and Ohga. 24 Ethanol PA was added to the culture broth in a 1:4 ratio of culture broth to ethanol (v/v), and left overnight at 4°C. The addition of ethanol precipitates the compounds of higher molecular weight, as the polysaccharides with biological activity, and the low molecular weight compounds are dispersed in the ethanolic solution. The EPS precipitate was separated by centrifugation, lyophilized, and stored in a sealed flask at room temperature as the first extraction step of exopolysaccharides (PE1).
To obtain the first fraction step of mycelium polysaccharides (PM1), the mycelial biomass was first lyophilized, dissolved in 500 mL of distilled water, and then heated to 80°C for 4 h under shaking. The solution was filtered through a 0.45-μm membrane, and the filtrate was concentrated by evaporation. The purpose of this method is to promote the removal of particles that are soluble in hot water, as the carbohydrates. Ethanol PA was added in a 1:4 ratio of filtrate to ethanol (v/v), mixed vigorously, and left overnight at 4°C. The solution was centrifuged (4500 g for 20 min), washed with ethanol PA and centrifuged again under the same conditions. The precipitated polysaccharides with high molecular weight thus obtained, were lyophilized and stored in a sealed flask at room temperature.
The second extraction step of mycelium polysaccharides (PM2) was obtained according to Jose et al. 25 The mycelial biomass was lyophilised, and the lipids were extracted in Soxhlet with petroleum ether for 8–10 h. Methanol was added to the lipid-free material, which was lyophilized after methanol evaporation and stored in a sealed flask at room temperature. In this method, both the high molecular weight carbohydrates as the low molecular weight present in the mycelial biomass are preserved and only the lipid fraction is removed. This extraction method allows us to observe if there is influence of lipids on antitumor activity.
Maintenance of animals
Male Swiss albino mice (Mus musculus; 30±5 g) were obtained from the Paraná Institute of Technology, and kept in the Chronic Treatment Laboratory at Univille throughout the period of the experiment. The mice were housed at 22°C±1°C, fed a diet of water and dry pellets of Nuvilab CR1 (Sogorb) ad libitum, and exposed to 12 h of light per day. 26
Maintenance of tumor cells
The S180 cells were obtained from the University of Itajaí and were used for serial transplants through weekly intraperitoneal injections of tumor suspension in mice. 27
Tumor induction
Tumor induction was performed subcutaneously in the back of each mouse in the test and positive control groups at a concentration of 5×10⁶ cells/animal. 21
Experimental design
Animals were distributed in four groups (n=5): (1) test group (with tumor induction and treated with PM1, PM2, and PE1, at four doses); (2) positive control group (with tumor induction and without treatment); (3) control of the substance group (without tumor induction and treated with PM1, PM2, and PE1, at four doses); (4) negative control group (without tumor induction and without treatment). The treatment consisted of administering PE1, PM1, or PM2 to mice intraperitoneally (i.p.) for 10 days, starting 24 h after tumor induction, in daily doses of 3, 10, 30, and 100 mg/kg animal mass. 6,28,29 The mice from the positive control group received a daily dose of 10 mg/kg 0.01 M phosphate-buffered saline (PBS solution) for 10 days.
Tumor development was evaluated 21 days after tumor induction 26,30,31 by determining the tumor mass (g) 32 and calculating the inhibition rate. 29,31 The inhibition rate was calculated using the ratio [(1−T)/C]×100, where T is the tumor mass of the test group, and C is the tumor mass of the positive control group.
The experiments were approved by the Ethics Committee of the University of the Region of Joinville (protocol no. 002/2008) and were carried out in accordance with current guidelines for the Care and Use of Laboratory Animals—Commission on Life Sciences, National Research Council, 1996.
Statistical analysis
Results obtained in shake flasks were evaluated using the Dixon “Q” test at a 95% confidence level to reject deviant values. 33 The effect of each variable and its interactions on the tested factors was evaluated by the Pareto test using Statistica® 7.0 software.
Kinetic curves for the bioreactor experiments were generated using data from duplicates. Kinetic parameters were obtained from the curves using Origin 8.0 PRO® software. This software was also used to find significant differences between the kinetic parameters using the Tukey's test at a 5% significance level.
Data for in vivo antitumor activity were first analyzed using the Dixon “Q” test at a 95% confidence level, 33 followed by variance analysis (ANOVA) at a 5% significance level.
Results
Culture medium composition study
Calculated EPS concentration (g/L) based on the 23 factorial design is shown in Table 2. Figure 1 shows the effect of the initial concentrations (g/L) of (NH4)2SO4, yeast extract, and soy peptone on the EPS concentration.
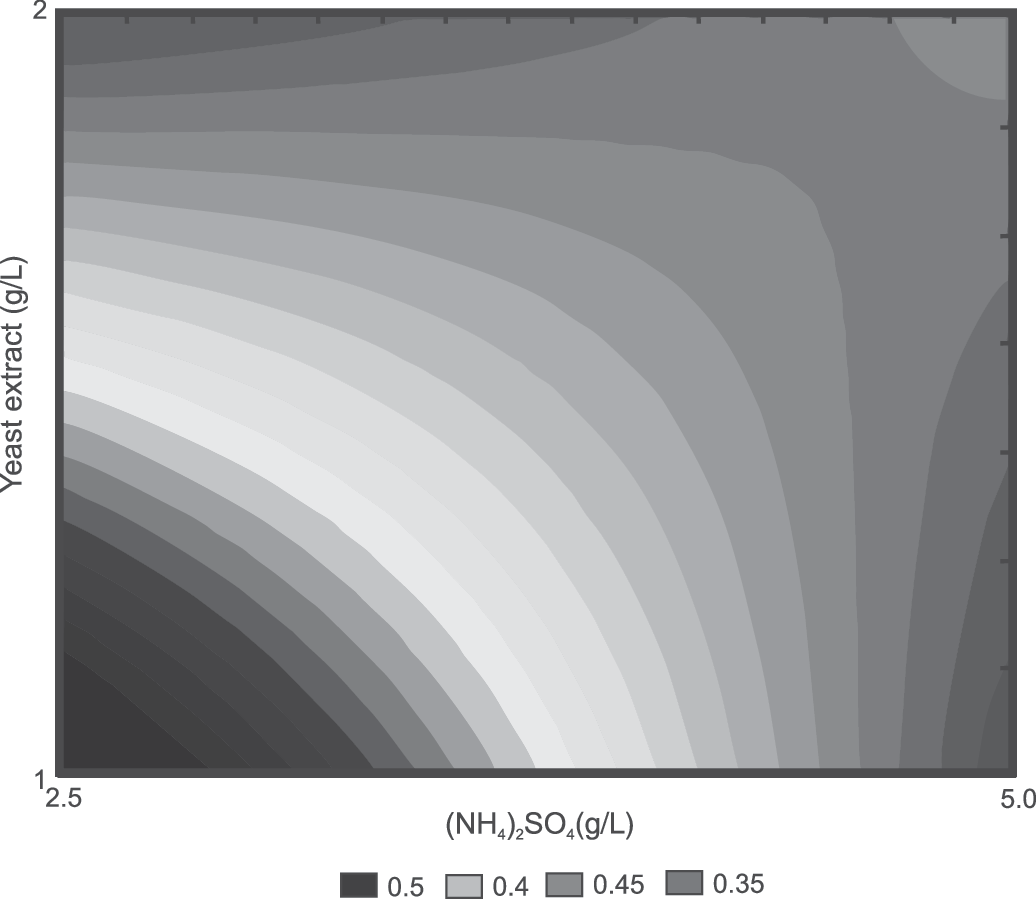
Effect of the concentrations (g/L) of (NH4)2SO4 and yeast extract on the exopolysaccharide (EPS) concentration (g/L).
Initial concentrations were determined using the 23 factorial design. EPS concentrations are given as mean±standard deviation (n=2).
Initial nitrogen source concentrations in POL culture medium proposed by Cavazzoni and Adami. 19
EPS, exopolysaccharides.
Effects of each tested variable on EPS concentration are presented in Table 3. Data show that (NH4)2SO4 and yeast extract had a statistically significant negative effect on EPS concentration, while soy peptone had a positive effect. When the concentrations of (NH4)2SO4 and yeast extract are low, the EPS concentration increases: this increase is more pronounced when the concentration of soy peptone is in the highest level. Thus, the highest EPS concentration (0.60 g/L) in the range of the tested concentrations (Fig. 1) can be obtained by considering significant interactions, and using low concentrations of (NH4)2SO4 and yeast extract (2.5 and 1.0 g/L, respectively) with a high concentration of soy peptone (1.0 g/L) in the culture medium.
Statistically significant effect.
Influence of pH on P. sajor-caju EPS synthesis
When cultivation was carried out at pH 3.0, glucose was not consumed and EPS was not produced for up to 470 h, when cultivation was interrupted.
Figures 2 and 3 show the kinetic curves for the P. sajor-caju submerged culture, using pH 4.0 and spontaneous pH, respectively.
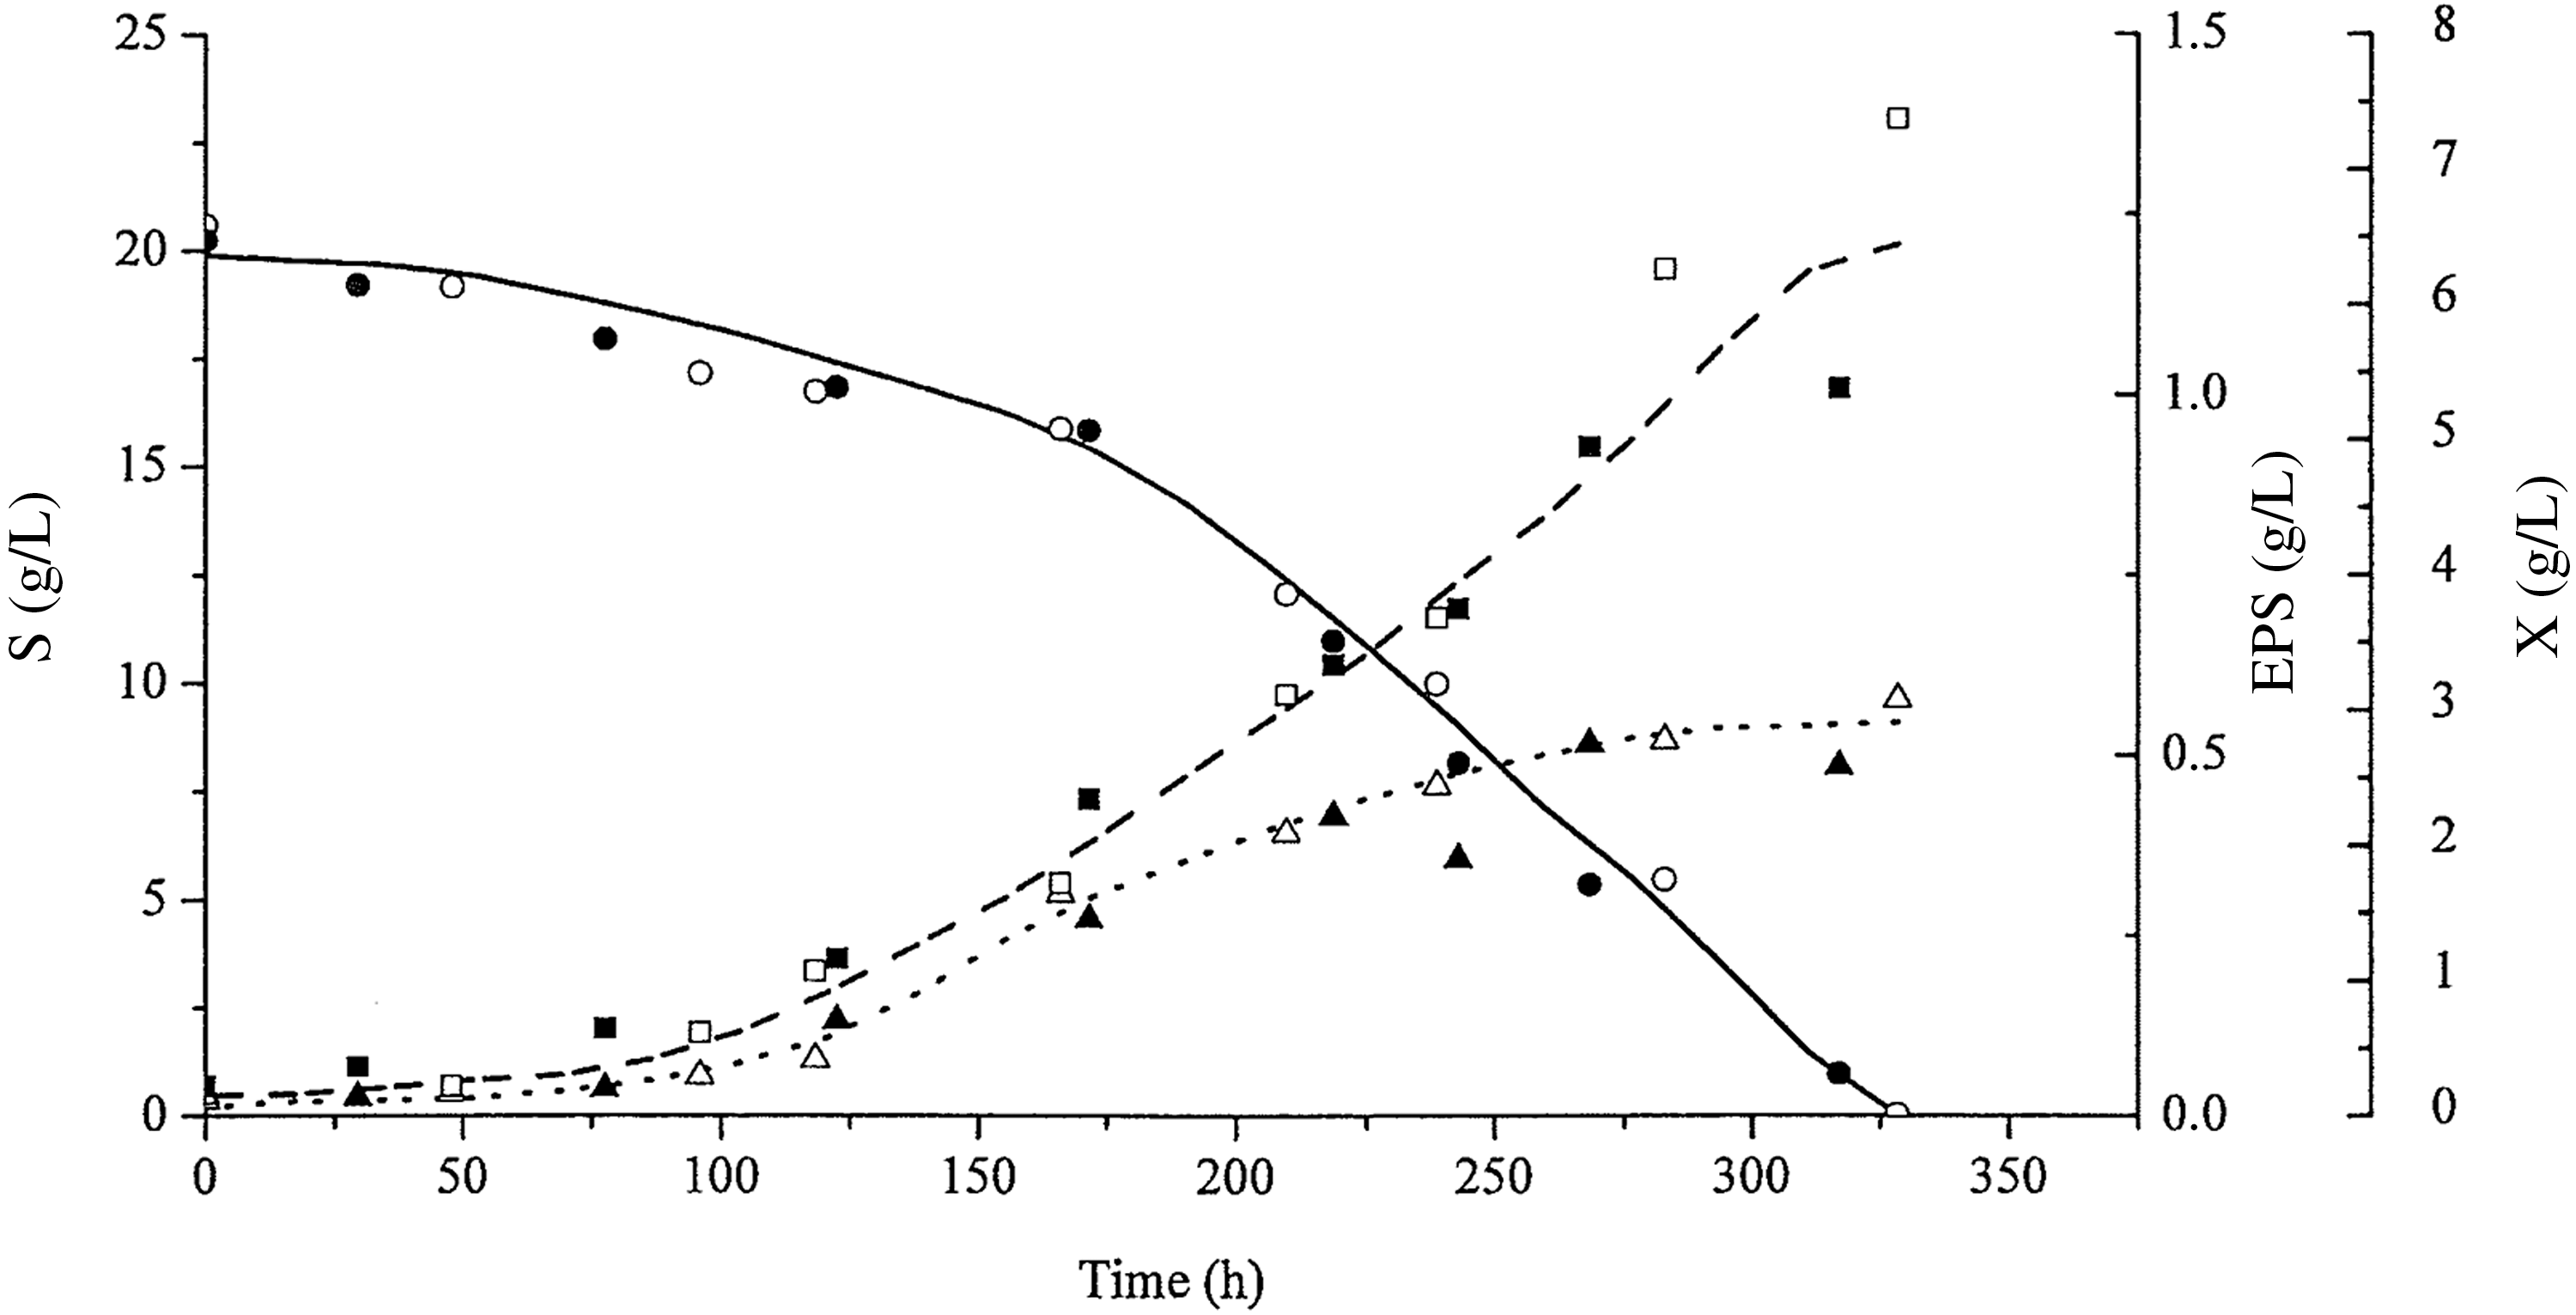
Profiles of biomass growth: X (dashed line, ■, □), glucose consumption: S (continuous line, ●, ○), and exopolysaccharide concentration: EPS (dotted line, ▲, △) with time (h) at pH 4.0. The open and closed symbols represent data from duplicate tests.
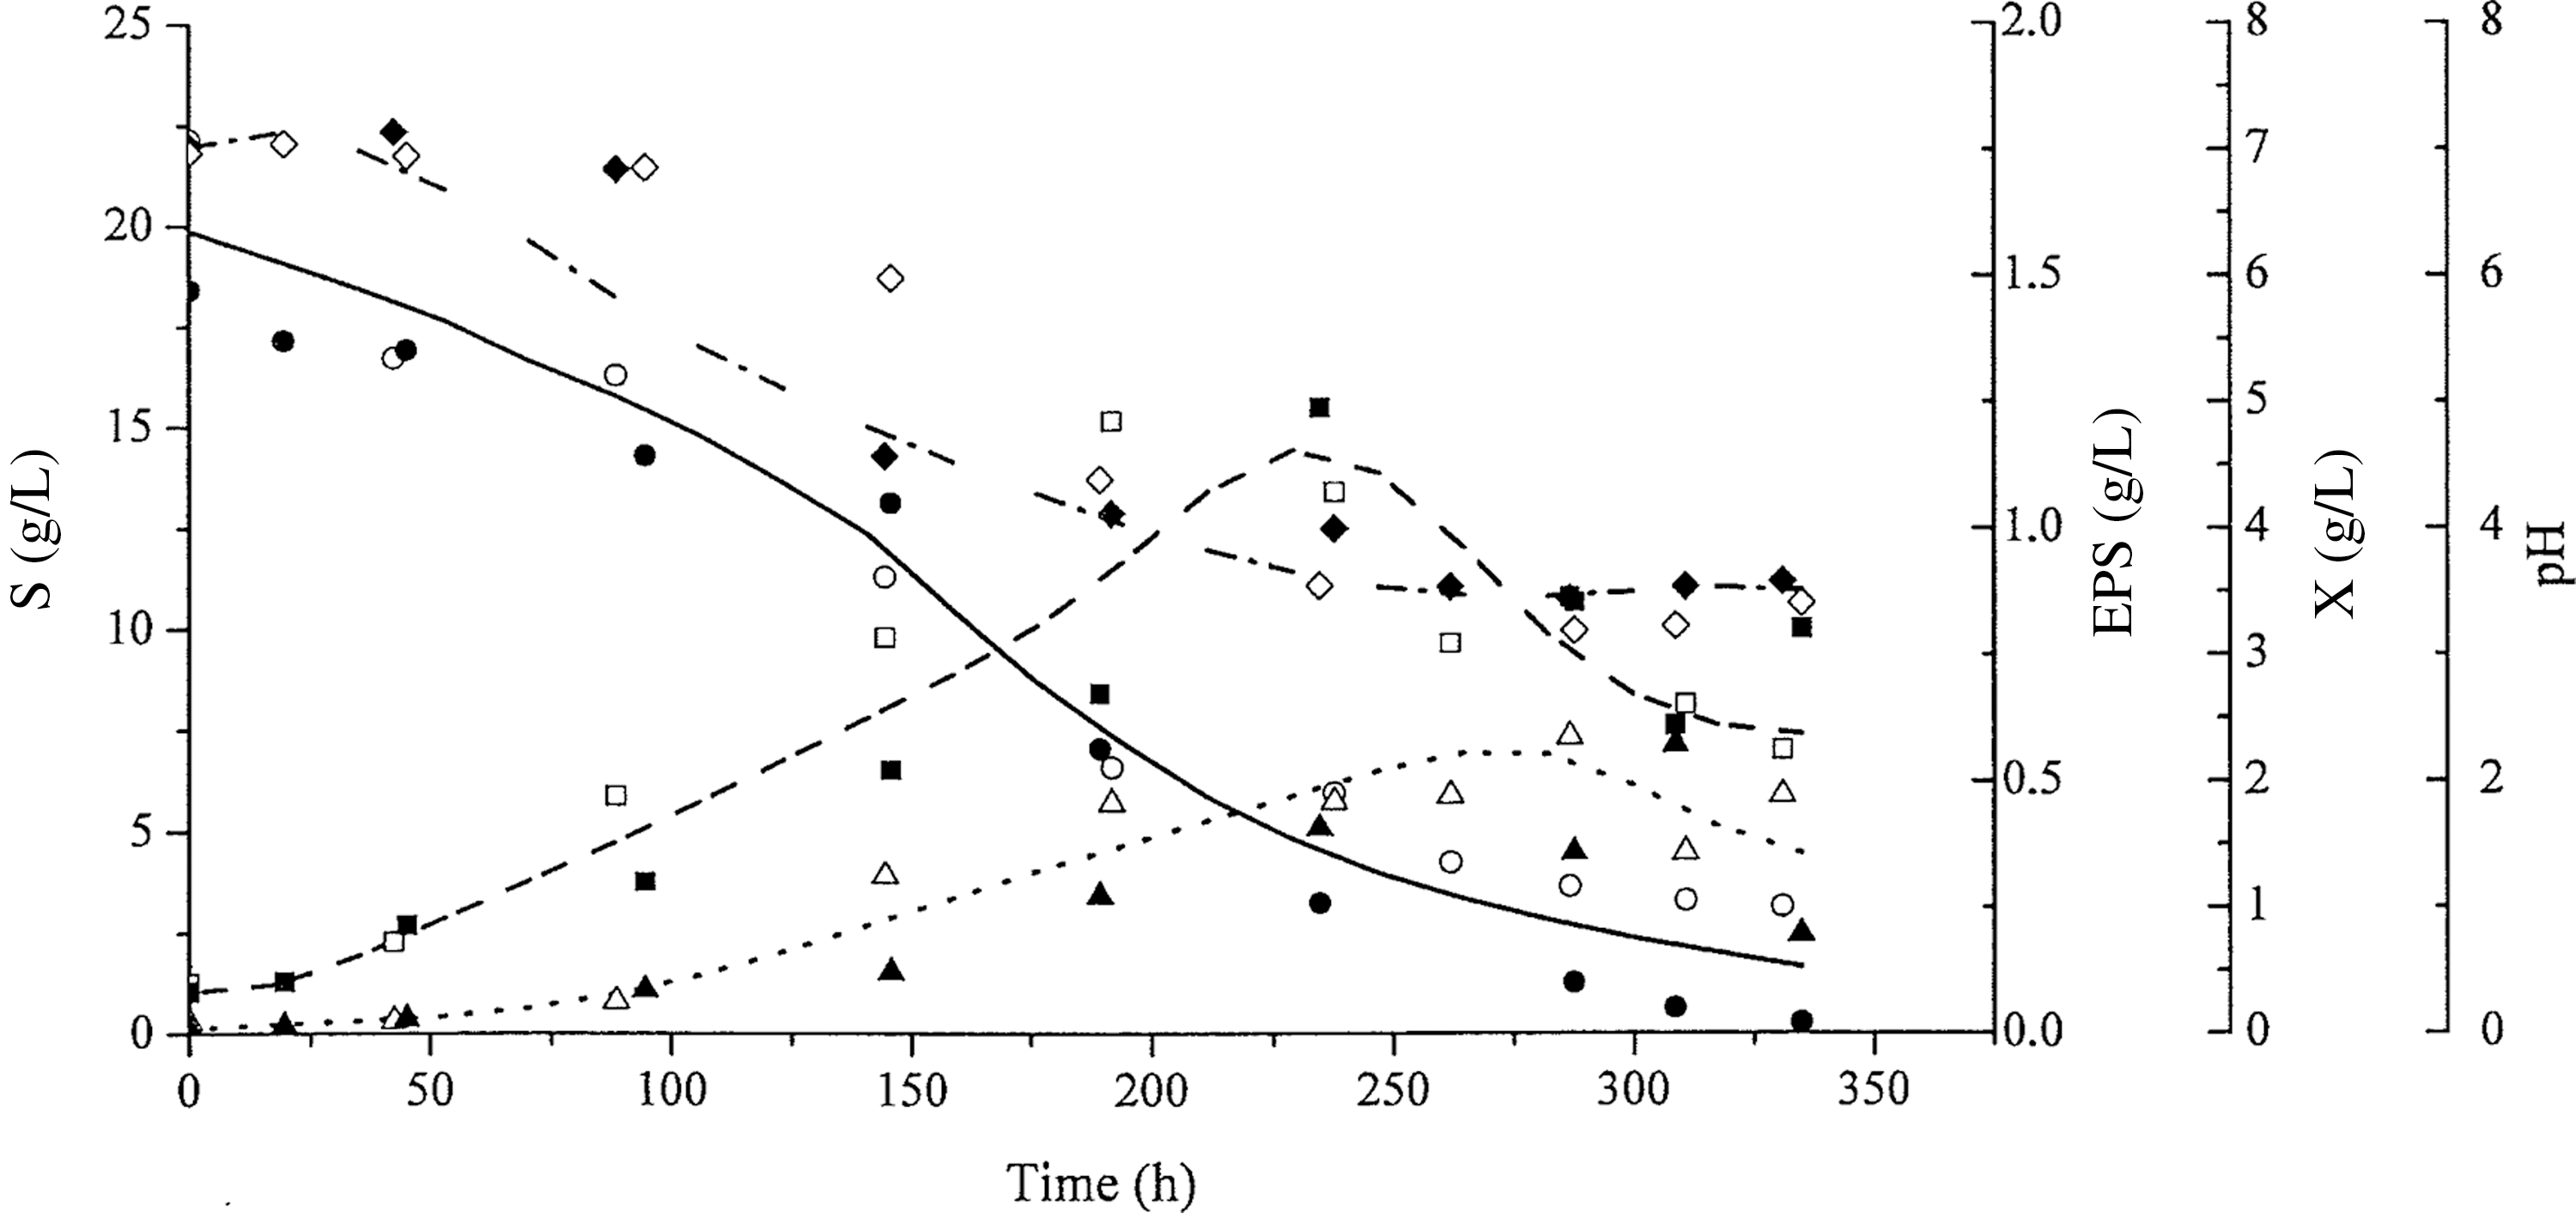
Profiles of biomass growth: X (dashed line, ■, □), glucose consumption: S (continuous line, ●, ○), and exopolysaccharide concentration: EPS (dotted line, ▲, △) with time (h) at spontaneous pH. The open and closed symbols represent data from duplicate tests.
The kinetic profiles in Figure 2 show that total glucose was consumed in 328 h of cultivation. At 293.7 h, the EPS concentration stabilized at a maximum value at 0.53 g/L, corresponding to a biomass concentration of 5.52 g/L.
Kinetic profiles in Figure 3 show that the residual glucose concentration was ∼1.6 g/L at 340 h, at which time cultivation was interrupted. During cultivation, the pH decreased from an initial value of 7.0 to a stable value of ∼3.5 in 230 h. At 264.4 h of cultivation, the maximum EPS concentration and biomass concentration were 0.55 and 3.52 g/L, respectively. However, the biomass production peaked at 230 h (4.62 g/L), followed by a drop in production soon after pH stabilization at 3.5. Similar behavior was observed for EPS production, with a peak in EPS production in 264.8 h, followed by decreased production.
Table 4 summarizes kinetic parameters obtained for P. sajor-caju cultivation at pH 4.0 and spontaneous pH. Much similarity is observed between the EPS concentration values (ΔP max), the yield factor for glucose for EPS (Y P/S) and the global (QP) and maximum productivity for EPS (QPmax) for both cultures (pH 4.0 and spontaneous pH). The Tukey's test produced no statistically significant differences in kinetic parameters described above.
Values are given as means±SD (n=2).
GC, initial glucose concentration; ΔP max, maximum EPS concentration; ΔX, biomass concentration; Y P/S, yield factor of glucose in EPS; Y X/S, yield factor of glucose in biomass; QP, global productivity of EPS; QX, global productivity of biomass; QPmax, maximum productivity of EPS; QXmax, maximum productivity of biomass.
Influence of CaCO3 on P. sajor-caju EPS synthesis
Figure 4 shows kinetic curves for P. sajor-caju cultivation at pH 4.0 with addition of CaCO3 (1.0 g/L).
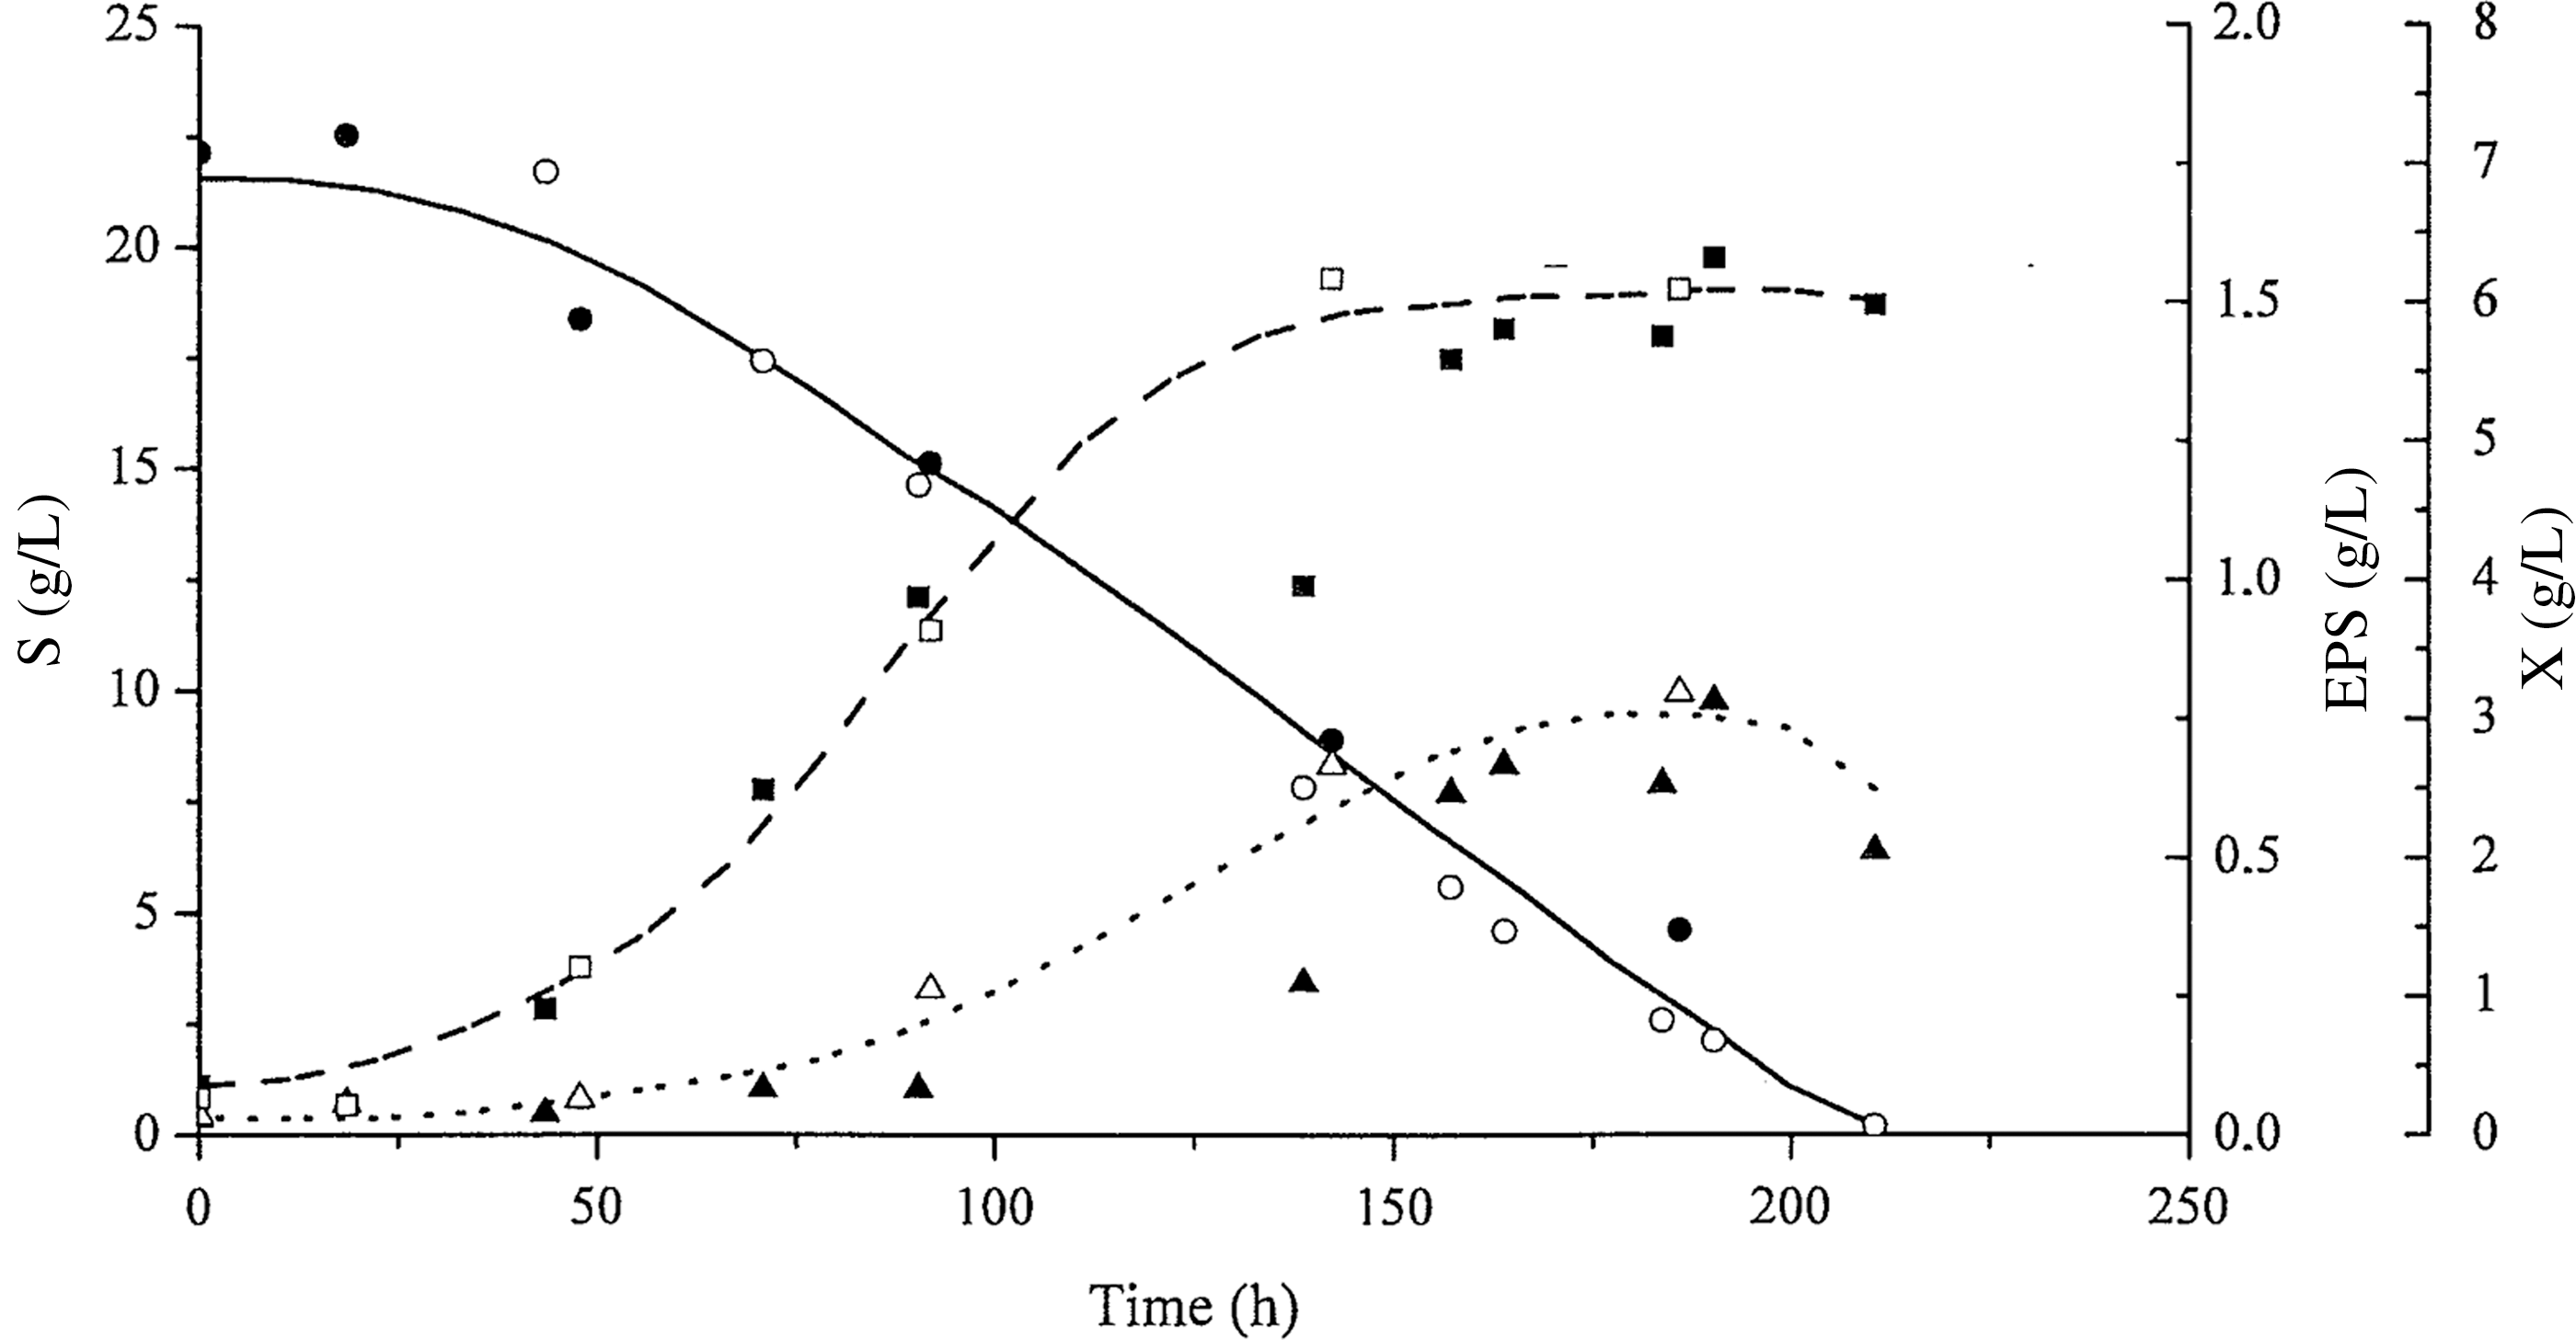
Profiles of biomass growth: X (dashed line, ■, □), glucose consumption: S (continuous line, ●, ○), and exopolysaccharide concentration: EPS (dotted line, ▲, △) with time (h) at pH 4.0 with added CaCO3 (1.0 g/L). The open and closed symbols represent data from duplicate tests.
Figure 4 shows that 210 h were required for glucose consumption when CaCO3 (1.0 g/L) is utilized, compared to 328 h when CaCO3 was not used in the culture (Fig. 2). The EPS concentration (0.72 g/L) stabilized after 188.4 h, corresponding to a biomass concentration of 5.73 g/L (Fig. 4). Table 3 gives the kinetic parameters for P. sajor-caju cultivation with and without CaCO3 (1.0 g/L). The maximum EPS concentration was 35.8% higher when calcium carbonate was used in the culture medium. The global and maximum productivity for EPS were also 114.5% and 125.7% higher, respectively, in cultures with added CaCO3 (1.0 g/L). The maximum biomass productivity (QXmax) was 113.3% higher for cultivation without calcium carbonate. The Tukey's test does not show any statistically significant differences between cultivations with and without CaCO3 for other parameters related to the biomass or for the yield factor of glucose in EPS and in biomass.
Influence of the initial glucose concentration on P. sajor-caju EPS synthesis
Figure 5 shows the kinetic curves for P. sajor-caju cultivation at pH 4.0, with added CaCO3 and an initial glucose concentration of 60 g/L.
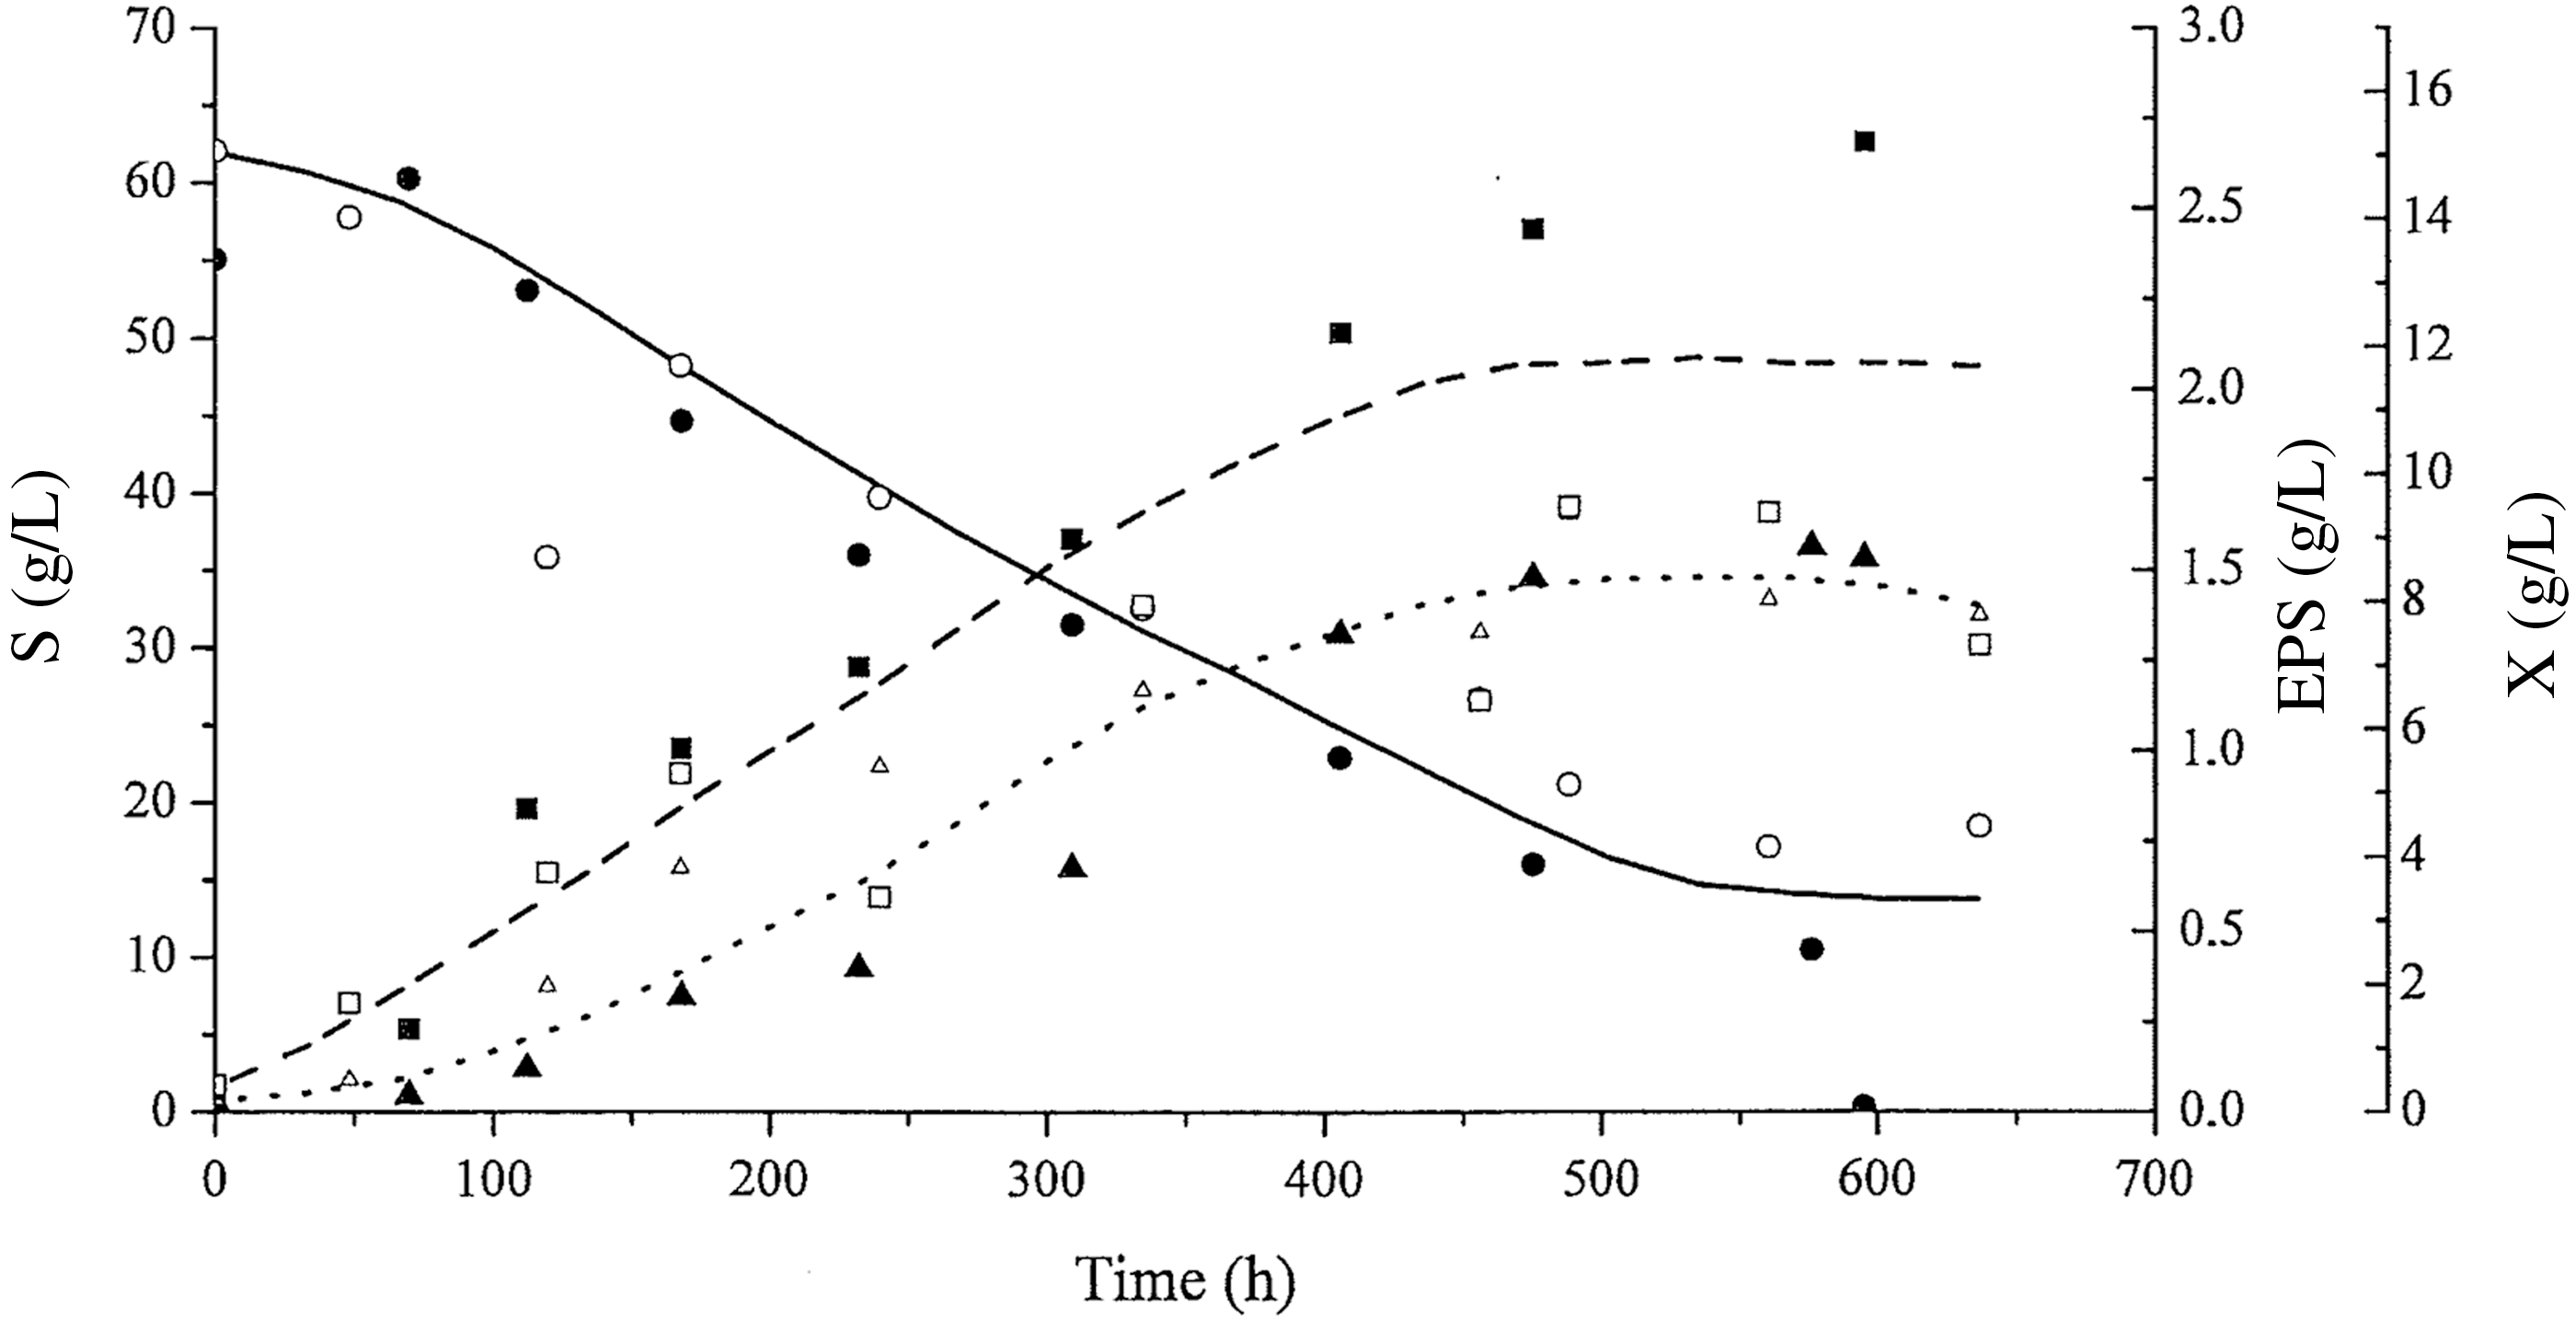
Profiles of biomass growth: X (dashed line, ■, □), glucose consumption: S (continuous line, ●, ○), and exopolysaccharide concentration: EPS (dotted line, ▲, △) with time (h) at pH 4.0 with added CaCO3 (1.0 g/L) and 60 g/L initial glucose. The open and closed symbols represent data from duplicate tests.
The kinetic profiles in Figure 5 show that the residual glucose concentration was still ∼11.4 g/L at 636 h of cultivation, at which time, cultivation was interrupted. However, for the culture at an initial glucose concentration of 20 g/L (Fig. 4), all the glucose was consumed within a 210-h period. The EPS concentration (1.45 g/L) stabilized after 535.6 h of cultivation, corresponding to a biomass concentration of 11.43 g/L.
Comparison of the kinetic data for the experiment using 60 and 20 g/L initial glucose has been mentioned in Table 4. The maximum EPS concentration in cultures with 60 g/L initial glucose was 101.4% higher than in the culture with 20 g/L initial glucose. However, the global EPS productivity with 60 g/L initial glucose was 42.2% lower than that for cultivation with 20 g/L initial glucose. No statistically significant differences were found for other kinetic parameters related to EPS and the biomass (Table 4).
In vivo antitumor test
Figure 6 shows the tumor inhibition rates obtained using PE1, PM1, and PM2. All tested doses for PE1 and for PM2 showed inhibition rates against S180 cells in relation to the positive control. A dose of 100 mg/kg of PM1 achieved 80% tumor reduction, whereas there was no statistically significant difference in tumor weight at other doses relative to the control. The PE1 precipitate achieved the highest reduction of S180 growth (86%), followed by PM2 extract (82%); the reduction for both extracts was independent of the dose. The PM1 extract caused growth reduction (80%) only at a dose of 100 mg/kg.
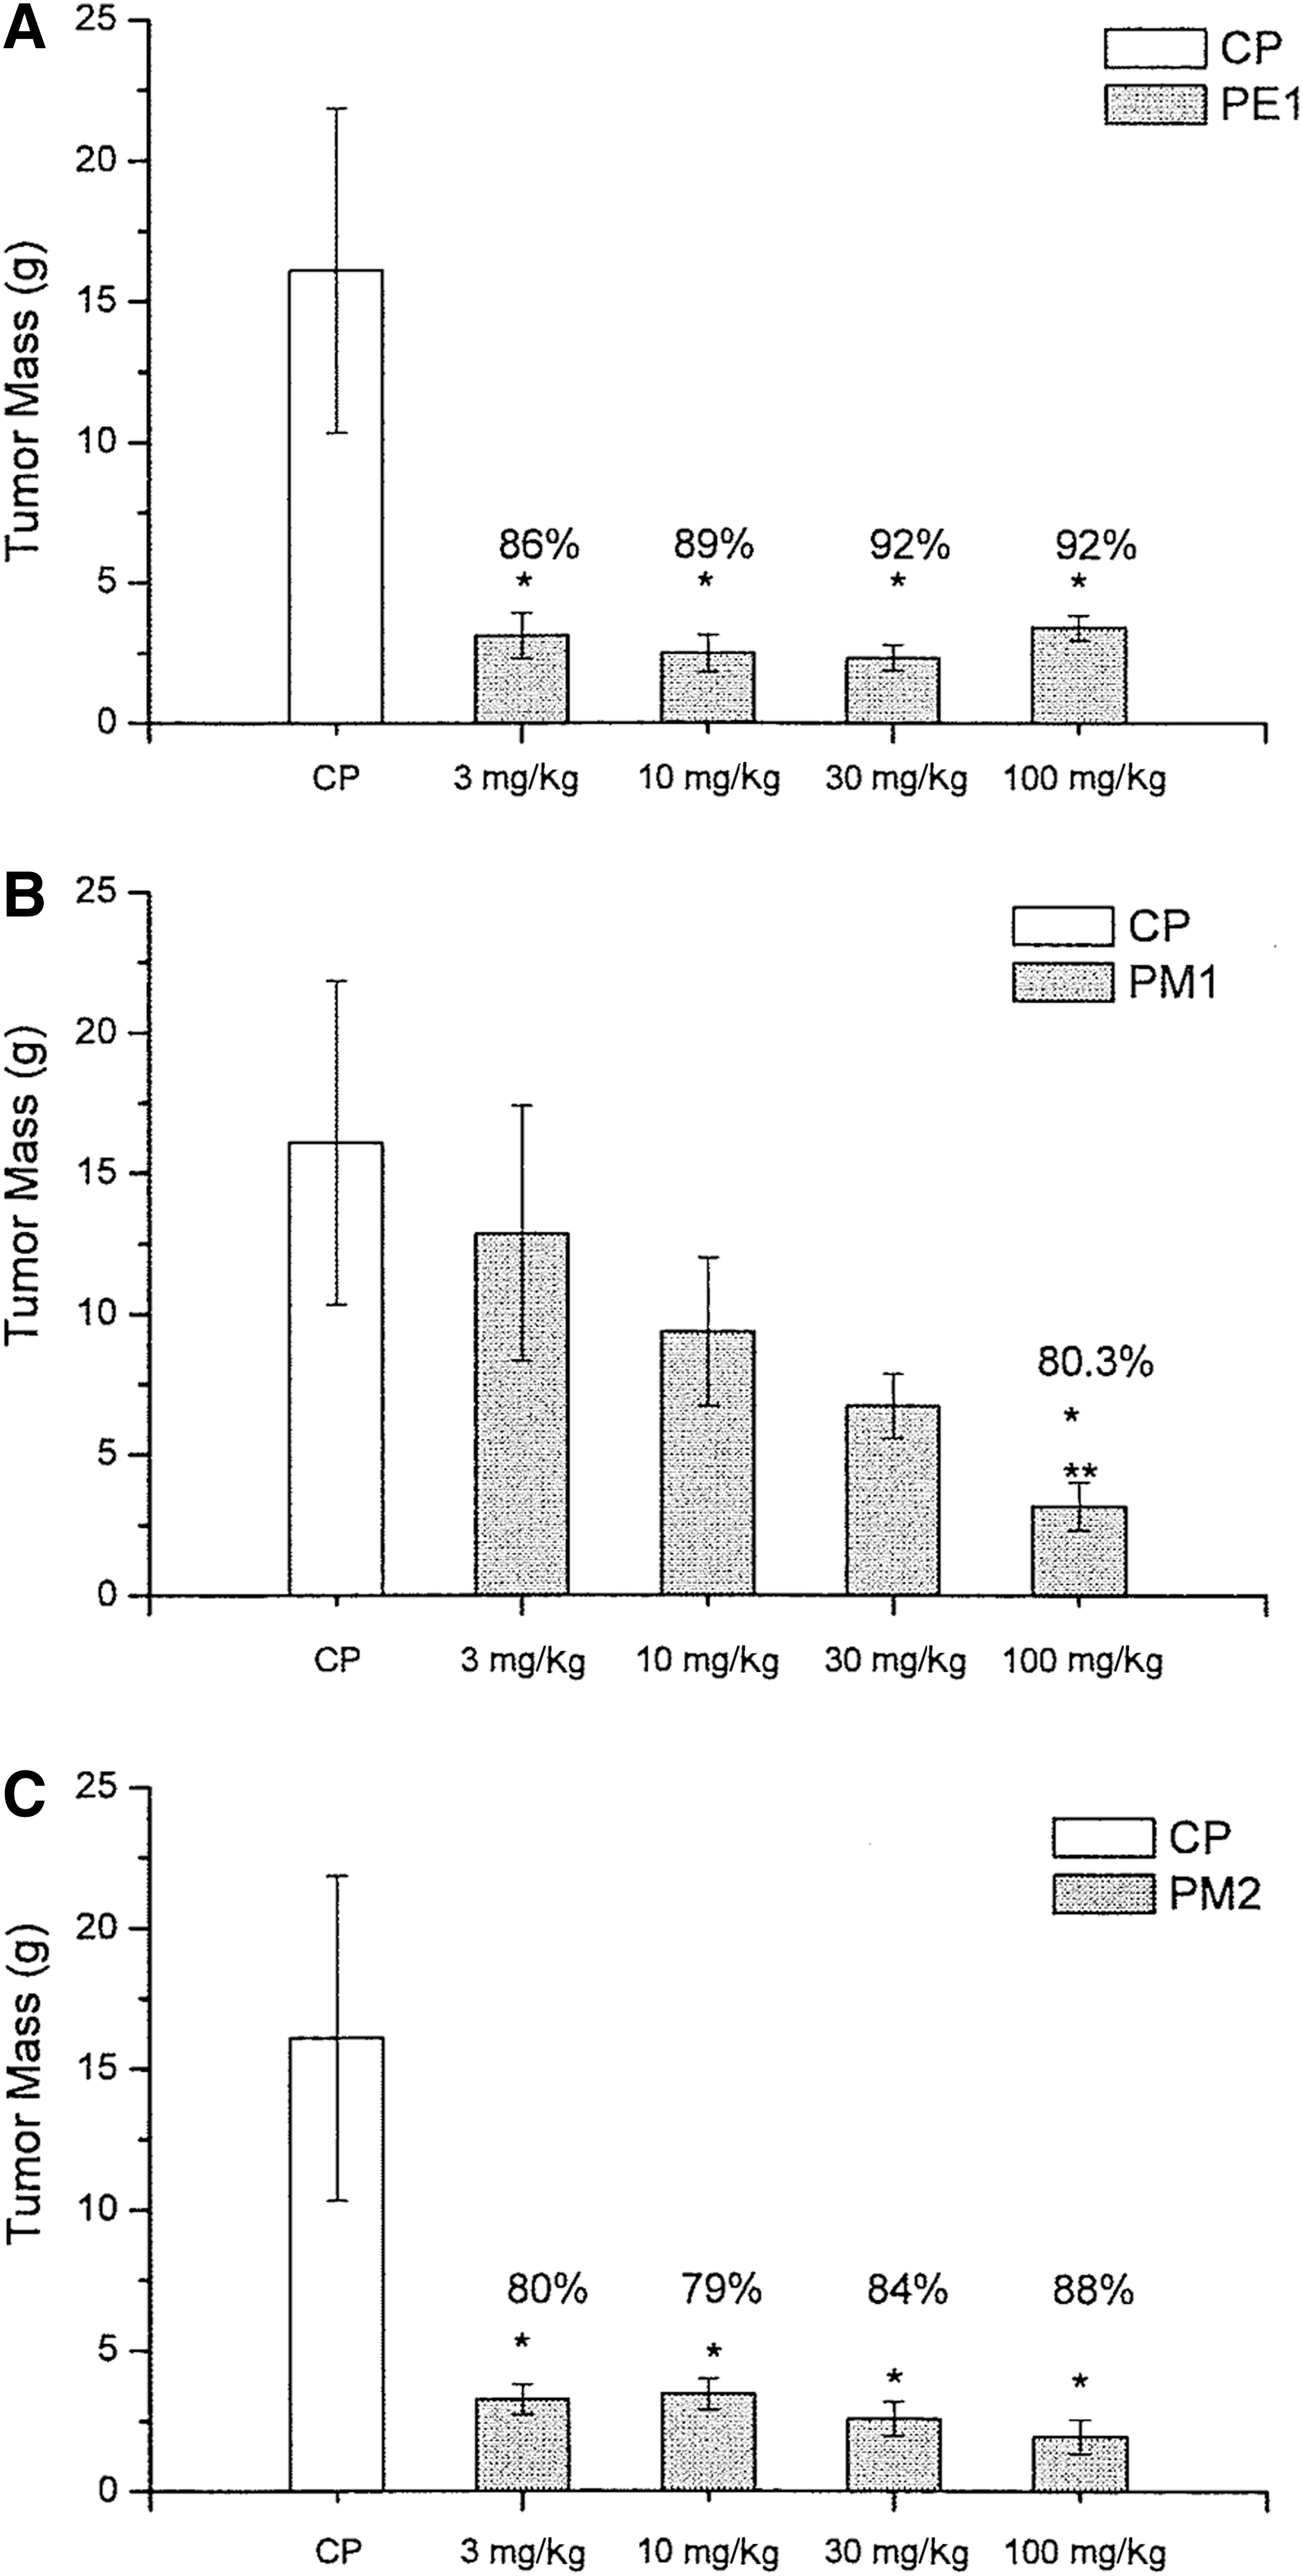
Tumor mass (g) and tumor inhibition rate (%) for animals inoculated with Sarcoma 180 and treated with the following substances:
Discussion
A culture medium containing 2.5, 1.0, and 1.0 g/L of (NH4)2SO4, yeast extract and soy peptone, respectively, increased the EPS concentration, using an initial glucose concentration of 20 g/L. These results are in agreement with results from Confortin et al., 14 who investigated the relative (NH4)2SO4, yeast extract and soy peptone concentrations in a culture medium for producing biomass and EPS by P. sajor-caju. Confortin et al. 14 used a factorial design to show that EPS production was increased by using low concentrations of (NH4)2SO4 and yeast extract together with high concentrations of soy peptone in the culture medium. Organic nitrogen sources are generally better than inorganic sources for extracellular polysaccharide production in submerged culture of mushrooms. He et al. 34 obtained relatively lower EPS production by Lentinus edodes using inorganic nitrogen sources (0.6–0.8 g/L) than organic nitrogen sources (1.0–1.4 g/L). Inorganic nitrogen sources were not effective for mycelial growth of L. edodes 35 and Pleurotus ostreatus. 15 Studies on EPS production by Pleurotus ostreatoroseus and P. ostreatus “florida” by Rosado et al., 5 showed that low concentrations of (NH4)2SO4 in the culture medium increased EPS production (5.8 g/L) by the P. ostreatoroseus species. Yeast extract has often been used to provide necessary growth factors. However, too high a concentration of yeast extract would lower the use of other carbon sources and the accumulation of metabolites. 35 Feng et al. 35 observed that the biomass and EPS production by L. edodes significantly increased upon increasing yeast extract concentration up to about 6.0 g/L, but decreased sharply beyond this. Comparing experiment 1 (where the medium used was proposed by Cavazzoni and Adami 19 ) and experiment 7 (Table 1) shows that medium modifications increased EPS production by P. sajor-caju by 54%. Medium 7 also achieved better homogenization due to the use of smaller mycelium pellets. Medium 7 was therefore, the best of the tested compositions for producing EPS in the bioreactor.
The use of pH 4.0, 1.0 g/L CaCO3 and 20 g/L initial glucose concentration increased EPS productivity (3.84 g/L per hour). The results suggest that the lowest pH of 3.5 may have a negative influence on biomass and EPS production. This hypothesis is supported by the results for cultivation at pH 3.0. Xiao et al. 36 have shown that pH affects morphology and cell structure, as well as altering the function of the fungal cell membrane. He et al. 34 investigated the effect of initial pH on EPS production by Funalia trogii also called Trametes trogii. The optimal pH for mycelial growth (3.5 g/L) was 5.0, whereas the maximum EPS production (4.0 g/L) was achieved at pH 6.0. Huang and Liu 37 optimized submerged cultures by Grifola umbellate. They reported that pH 5.0 yielded the highest EPS concentration (0.571 g/L), while pH 6.0 yielded the highest biomass concentration (6.23 g/L). Hwang et al. 38 observed that for Phellinus linteus pH 4.0 was ideal for EPS production and pH 5.0 was ideal for biomass production: the highest EPS and biomass concentrations obtained were 3.3 and ∼2.7 g/L, respectively. Wisbeck et al. 13 studied the influence of the initial pH of the cultivation medium on EPS and biomass production by P. ostreatus. They obtained the highest concentrations of EPS (1.33 g/L) and biomass (12.86 g/L) with pH 4.0, using the POL medium and 40 g/L glucose. In contrast, Papaspyridi et al. 39 obtained better results using pH 6.0 in their culture medium optimization for EPS and biomass production by P. ostreatus. Comparison of the values obtained in this study with those found in the literature shows that different cultivation conditions (specific to each fungal species) are required within the same genus Pleurotus. The controlled pH (4.0) culture was chosen in this study considering future cultivation on an industrial scale because it is known that cultivation under low pH is less susceptible to contamination by other microorganisms. In addition, the next stage of this work involves the validation of CaCO3 use in the medium, and CaCO3 is known to dissolve more easily at low pH, thereby enabling observation of culture contamination.
The presence of CaCO3 in the culture medium enhances the EPS concentration and also the global and maximum productivity for EPS. However, the maximum EPS concentration decreased after 188.2 h. The decline in EPS concentration was most likely due to the stabilization of the biomass concentration, as polysaccharides may adhere to the biomass, making the transport of glucose to the inner cell difficult, which could stimulate the fungus to excrete β-glucanase to degrade the polysaccharides and obtain glucose as proposed by Papagianni. 40 However, it was also observed that the amount of available glucose was very low at this time, suggesting that the fungus may be degrading EPS to obtain glucose. Xiao et al. 36 attribute the significance of adding a calcium source to the culture medium to the action of calcium ions on fungal growth, that is, cell membrane permeability can be changed via an internal Ca2+ gradient and by effecting the activity of some fungal enzymes involved in cell wall expansion. In addition, the internal Ca2+ gradient may inhibit biopolymer synthesis, affecting sugar and protein contents, resulting in an increase in EPS production and inhibiting the accumulation of intracellular polysaccharides (IPS), that is, stimulating the excretion of polysaccharides to the outside of the cell.
Usually, EPS concentrations can be increased by using higher carbon source concentrations in the culture medium. Huang and Liu 37 and Shih et al. 16 used higher glucose concentrations to increase EPS production by Grifola umbellata and Grifola frondosa. Increasing the glucose concentration from 2% to 4% for G. frondosa, double the EPS concentration from 0.76 to 1.49 g/L. Wisbeck et al. 13 also obtained a higher EPS concentration and global EPS productivity (1.33 g/L and 7.5 mg/L per hour, respectively) with P. ostreatus by using 40 g/L initial glucose instead of 20 g/L initial glucose. Feng et al. 35 obtained a higher EPS concentration (0.25 g/L) by L. edodes varying glucose concentration from 0.5% to 3.0%. However, higher glucose concentrations decreased the EPS concentration. In this study, 20 g/L (instead of 60 g/L) initial glucose was used in the culture medium to produce EPS by P. sajor-caju, in consideration of productivity and contamination reduction over long cultivation periods in a large scale production.
Comparing our results for P. sajor-caju with those obtained by Wisbeck et al. 13 for P. ostreatus, lower EPS concentration and productivity values are observed for P. sajor-caju. Indeed, polysaccharides obtained by the P. sajor-caju species appear to show higher antitumor activity. Experiments performed by Dalonso et al. 2 found that polysaccharides extracted from P. sajor-caju fruiting bodies had a higher reduction rate (85%) in the number of neoplasic cells (Ehrlich ascites tumor) inoculated in mice than polysaccharides extracted from P. ostreatus (72%) fruiting bodies in studies by Wolff et al. 4 These studies motivated this work on maximizing EPS production by P. sajor-caju and the in vivo validation of P. sajor-caju activity.
This study shows that the PE1 precipitate promoted the highest growth reduction in S180, followed by the PM2 extract: the reduction achieved by both these extracts was dose-independent. The PM1 extract, at a dose of 100 mg/kg, achieved the least growth reduction. Moradali et al. 41 studied the growth inhibiting effect of tumors by aqueous extracts from various macrofungal species and observed reductions in tumor growth in S180 varying from 42% to 100%. Fortes et al. 42 have suggested that substances extracted from fungi can modulate carcinogenesis mainly by stimulating the immunologic system. The results obtained in this study are in accordance with those found in literature, showing higher than 79% reduction in tumor growth. Fan et al. 43 obtained a 72.2% reduction in tumor growth in S180 by treatment with Agaricus brasiliensis culture broth extracts, which is lower than the reduction rate obtained in this study. Sarangi et al. 44 reported that three proteoglycan fractions extracted from the P. ostreatus mycelium promoted an S180 growth reduction of 48%, 76.94%, and 63.7% (Fractions I, II, and III, respectively) when using 5 mg/kg dose of extracts. Comparing the results of Sarangi et al. 44 with the results of this study, PM2 promoted a higher growth reduction than PE1 in S180, irrespective of the dose. Dalonso et al. 2 used fractions extracted from the fruiting body of the same fungus species used in this study (P. sajor-caju CCB 019) to obtain a 85% reduction in the number of Ehrlich ascites tumor cells. The extracts were administered at 10 mg/kg i.p. for six consecutive days. The chemical characterization of the bioactive compounds produced was not an objective of this study. However, there are suggestions in the literature that the composition of these bioactive compounds includes polysaccharides and proteins. 4,24
Footnotes
Acknowledgments
The authors thank Dr. A.A. Steil and Dr. D. Sato from UNIVALI for supplying the tumor strain. We also thank the Research Support Fund from Univille and the Coordination for the Improvement of Higher Level Education Personnel—CAPES/Brazil for the financial support.
Author Disclosure Statement
No competing financial interests exist.