
Abstract
Banana oligosaccharides (BOS) were extracted with water, and then separated and purified using column chromatography. Gel penetration chromatography was used to determine the molecular weights. Thin layer chromatogram and capillary electrophoresis were employed to analyze the monosaccharide composition. The indican bond and structure of the BOS molecule were determined using Fourier transform infrared spectroscopy and nuclear magnetic resonance. Results showed that BOS were probably composed of eight β-D-pyran glucose units linked with 1→6 indican bonds. The laxative effects of BOS were investigated in mice using the method described in “Handbook of Technical Standards for Testing and Assessment of Health Food in China.” The length of the small intestine over which a carbon suspension solution advanced in mice treated with low-, middle-, and high-dose BOS was significantly greater than that in the model group, suggesting that BOS are effective in accelerating the movement of the small intestine.
Introduction
C
Studies showed that bananas have certain functional benefits, such as protection of the gastric mucosa and antiulcerogenic effects. 5,6 Matsuda et al. studied the effects of dietary banana on immunocytes. 7 Guha et al. reported that the consumption of ripe bananas prevented the development of malignant ascites. 8 The antioxidant activity of banana was explored by Sun et al. 9 and Vijayakumar et al., 10 but few studies have investigated the oligosaccharides of bananas.
It is well known that bananas have a considerable laxative effect, especially in cases of functional constipation, although the mechanism is still unclear. Constipation is a common disorder among children and adults, especially in babies, the elderly, and pregnant women. Functional constipation is usually a long-term condition, which requires the use of medication, such as laxatives. Research has been undertaken on the relationship between constipation, laxative use, and the risk of colon cancer. 11,12
As bananas are a native and health-giving fruit, further research into their properties is required and particular attention should be given to their laxative effect. In the present study, banana oligosaccharides (BOS) were separated and identified and their laxative effects in mice were then investigated. BOS can be used as an ingredient of functional food, if they are effective on the prevention or treatment of constipation.
Materials and Methods
Raw material
Bananas (Musa AAB group, Plantain subgroup) with yellow peel and brown spots were purchased from a local market. All chemical reagents used were of analytical grade.
Separation and purification of BOS
The bananas were peeled, mashed to a puree, and extracted with water in a ratio of 1:2 [puree (g)/water (mL)]. The supernatant of extract was filtered and concentrated under vacuum. After removal of the protein from the concentrated supernatant using the Sevag method, 13 the oligosaccharides were recovered from the concentrated supernatant by precipitation with absolute ethanol and centrifugation. The oligosaccharide sediment was washed sequentially with ether, acetone, and absolute ethanol. The sediment was then resuspended in water and purified by column chromatography using a Sephadex G-25 column. After purification and freeze-drying, the BOS were identified and used for the experiments in mice.
Identification of BOS
Gel penetration chromatography
Gel penetration chromatography (GPC) was employed for determining the molecular weight of the BOS using Waters 515 Gel Permeation Chromatography equipment, a Waters 410 refractometer, and an Ultrahydrogel 250 Column. 14,15 The column temperature was set at 40°C. The mobile phase was 0.1 M NaCl and the flow rate was set at 0.6 mL/min. Polyethylene glycol was used as the standard sample.
Thin layer chromatogram
Ten milligrams of the BOS samples was accurately weighed into a test tube and 2 mL trifluoroacetic acid (2 M) was added. The tubes were then sealed under vacuum and the samples hydrolyzed at 130°C for 2 h. The hydrolyzed sample was allowed to cool and the supernatant was then concentrated in vacuum condition. Samples of the vacuum concentration hydrolyzed material were applied to the thin layer silica gel plates together with the monosaccharides glucose and fructose as the standards. Butyl alcohol-ethanol-water (volume ratio 10:1:2) was used as the developing agent and aniline- diphenylamine-trichloroacetic acid was used as the color developing reagent. On completion of the separation, the thin silica gel plates were air-dried at room temperature and heated at 80°C for 10 min to develop the color. 16
Capillary electrophoresis
Separations were carried out by the fused-silica capillary tubes (50 μm×60 cm, and 50-cm effective length). 17 The electrolyte solution was prepared and contained 20 mM 2,6-pyridine dicarboxylic acid (PDC) and 0.5 mM cetyltrimethyl ammonium hydroxide (CTAH); the pH was adjusted to 12.1. The separation was carried out at the parameters of 25 kV, 25°C using P/ACETMMDQ capillary electrophoresis (CE) apparatus (Beckman Co.).
Fourier transform infrared spectroscopy
A WQF-410 Fourier transformation infrared spectrometer (the 2nd Optics Apparatus Factory of Beijing) with a scan wave of 4000–400 cm−1 was used. 18
Nuclear magnetic resonance
The BOS samples were dissolved in D2O and DRX-400 NMR spectroscopy (Bruker Co.) and were used to carry out 1 H and 13 C analysis at room temperature. 18 Sodium 2,2-dimethyl-2-silapentane-5-sulfonate (DSS) was used as the external standard.
Animal experiments on the laxative effects of BOS
Animals
Male SPF-grade Kunming mice were supplied by the Medical Laboratory Animal Centre of Guangdong Province, on animal license no. SCXK 2003-0002, 2007A006.
Drugs
Diphenoxylate (H32022716) was produced by Changzhou Kangpu Medicine Industry Co., Ltd.
Methods
The method used to assess the facilitation of feces excretion was taken from the “Handbook of Technical Standards for Testing and Assessment of Health Food in China.” 19
Analysis of small intestinal movement
Fifty healthy male Kunming mice (body weight 16–19 g) were divided into five groups: control, model, high-dose, middle-dose, and low-dose groups (n=10 mice each). An activated carbon suspension solution (CSS), a diphenoxylate suspension solution, and a BOS solution were prepared. According to the species differences, mice should be treated with 10-fold concentrations of drugs relative to the concentrations used for humans. BOS was administered at a dose of 5 g/kg body weight per day for mice. This dose of BOS was administered to the middle-dose group, 10 g/kg body weight per day to the high-dose group, and 2.5 g/kg body weight per day to the low-dose group. BOS was administered orally to the mice in the high-, middle-, and low-dose test groups and the mice in the control and model groups were gavaged with distilled water during the feeding period. All mice were fed a common mouse chow. Bodyweight and the quantity of food consumed were recorded daily for each mouse.
After BOS had been administered for 7 days, each group of mice was fasted for 24 h, but allowed water ad libitum to make the intestines empty.
Diphenoxylate was applied to induce the constipation of mouse. The three test groups and the model group were then treated with diphenoxylate (5 mg/kg body weight). The control group was given distilled water.
Thirty minutes after the administration of diphenoxylate, the test groups were gavaged with CSS containing BOS (BOS concentration in the CSS was corresponding to the low-, middle-, high-dose groups). The control and model groups were given 0.2 mL CSS only.
After 25 min, the mice were anesthetized with ether, killed, and incisions made in their abdomens. The intestine was cut away from the pylorus to cecum with scissors and its length measured. The advance of the CSS was measured as the distance from the pylorus to the leading edge of the black sediment. Equation (1) was used to calculate the CSS advance ratio (ρ):
For statistical analysis, the CSS advance ratio was converted using Equation (2):
The constipation model induced by diphenoxylate is successful if the CSS advance ratio (ρ) of the model group is significant lower compared with the control group. The test result of the small intestinal movement is positive, if the CSS advance ratio (ρ) of the test group is significant higher compared with the model group, when the constipation model induced by diphenoxylate is successful.
Analysis of dejecta granules and weight
The three test groups and the model group were given diphenoxylate (10 mg/kg body weight) to induce constipation. After the mice had been administered CSS, the time until the first black feces appeared was noted and the total number and weight of dejecta granules was measured for each mouse at 3 h and at 6 h. The water content of the feces was determined for each group of mice. Other treatments were as described above.
The constipation model induced by diphenoxylate is successful, if the time appearance of the first black dejecta of mouse in the model group is significantly longer compared with the control group.
The test result of the time of the first black dejecta is positive, if the time of the appearance of the first black dejecta of mouse in the test group is significantly shorter compared with the model group, when the constipation model induced by diphenoxylate is successful.
The test result of dejecta granules is positive, if the dejecta granules of the test group are significantly more compared with the model group, when the constipation model induced by diphenoxylate is successful.
The test result of the dejecta weight is positive, if the the dejecta weight of the test group is significantly heavier compared with the model group, when the constipation model induced by diphenoxylate is successful.
Data analysis
The statistical analysis software (SAS version 8.1) was used to analyze the experimental data. Analysis of variance and multiple comparison programs were applied.
Results and Discussion
Structure analysis of BOS
Molecular weight of BOS and monosaccharide composition analysis
The molecular weight was determined using GPC and the results are shown in Figure 1a. The molecular weight of the BOS was Mp 1199, Mn 1313, Mw 1349, and Mz 1389.
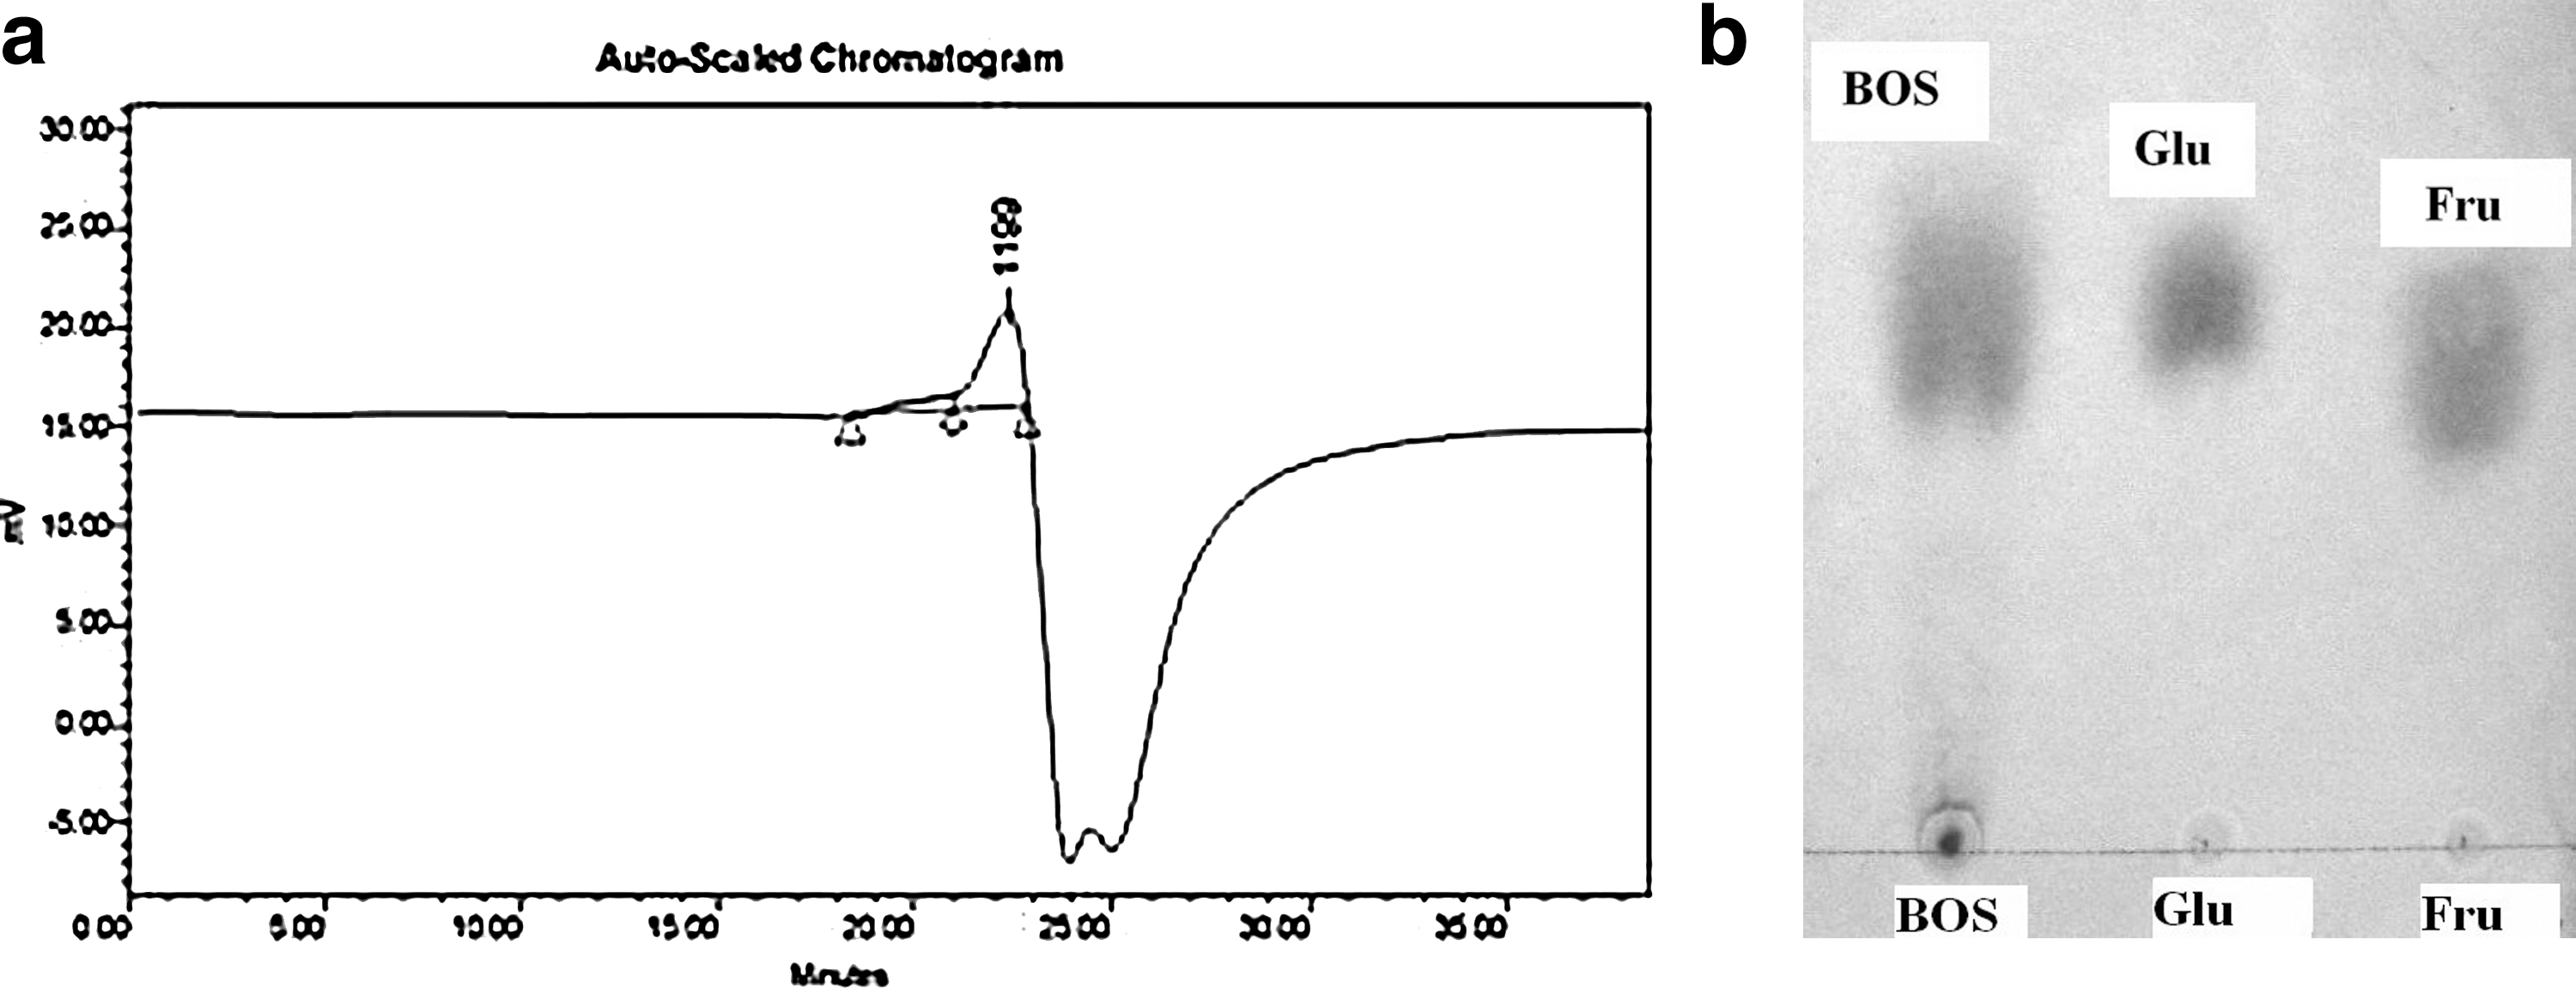
GPC chromatogram and photograph of the TLC separation of BOS.
The monosaccharide composition of the BOS was determined according to the color and R f value of the spots developed on the thin layer chromatogram (TLC) plates. It was found that the R f values for the glucose and fructose standards were very close, 0.28 and 0.24, respectively, as shown in Figure 1b; however, the color of the stain was different for the two monosaccharide standards: glucose stained cyan and fructose light brown. There was only one spot with an R f value of 0.28 and a cyan color when the products of the hydrolyzed BOS were developed on the TLC plate, suggesting that the BOS contain glucose.
Figure 2 shows the CE chromatograph of the BOS sample and the five standards, fructose, glucose, sucrose, mannitol, and sorbitol. As seen in Figure 2a, the BOS sample was found to have only one peak, which partially overlapped with glucose due to the similarity in retention time. For further identification, fructose (0.2 g/L) and glucose (0.2 g/L) were added to the BOS sample as internal standards and the sample was then subjected to CE as shown as Figure 2b. The peak representing an unidentified sample was found to overlap with the glucose peak, while the standard glucose peak broadened observably. All of these observations indicate that BOS is composed of glucose. Based on the molecular weight determined for BOS (about 1313 Da) and the molecular weight of glucose (180 Da), it has been calculated that BOS is a polymer of about eight glucose monomers.
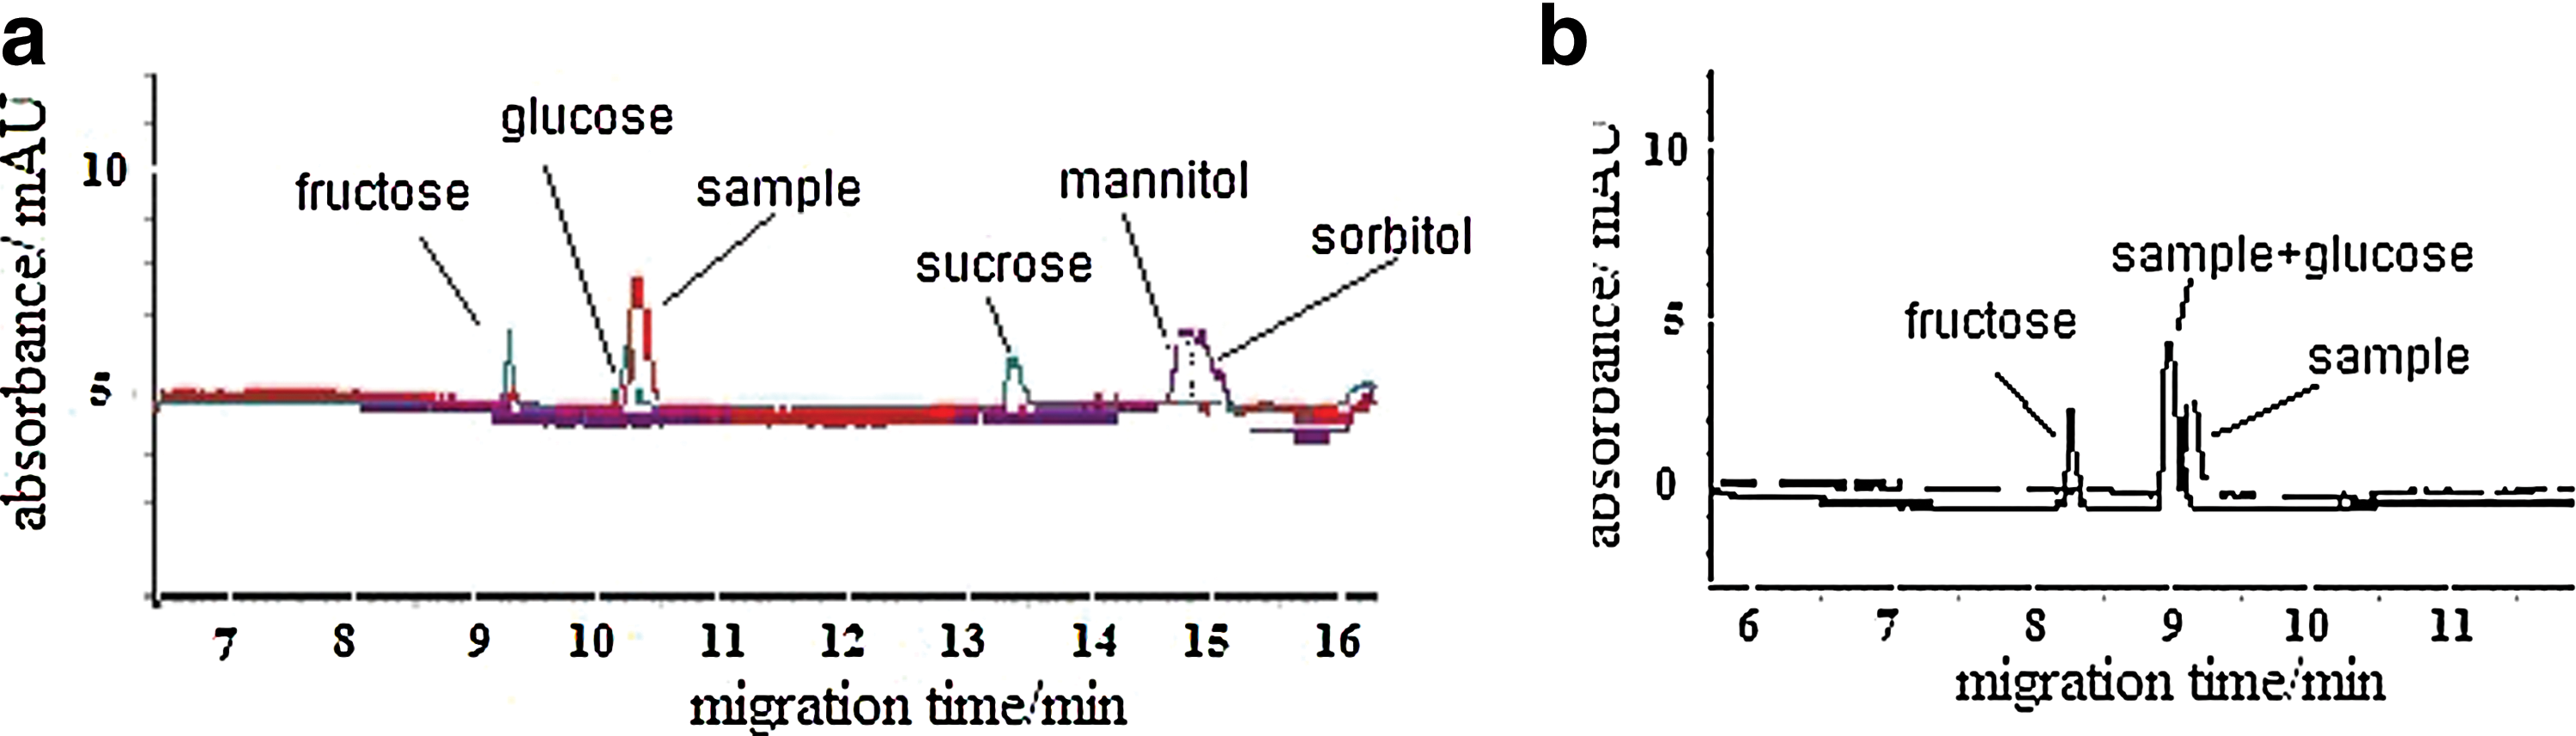
Results of capillary electrophoresis analysis of BOS and monosaccharide standards.
Analysis of indican bond type
With regard to the infrared spectra of saccharides, the absorption peak at 3000–2800 cm−1 is usually considered to be characteristic of this type of molecule. 16 The infrared spectrum of BOS is shown in Figure 3. Several typical absorption peaks can be seen. It is generally accepted that the absorption peak at 2935 cm−1 is due to the stretching vibration of the C-H bond; the peak near 1400 cm−1 results from the angular vibration of the C-H linkage; the absorption peaks between 1200 and 1000 cm−1 are characteristic of the vibration caused by the stretching of the C–O bond and the peak at 1600 cm−1 is due to the water of crystallization. The furan ring shows three characteristic absorption peaks at 937, 877, and 818 cm−1, respectively. 16 However, from Figure 3, it can be seen that there are no peaks corresponding to these three wave numbers, which suggests that the BOS molecule contains a pyran ring rather than a furan ring. A pyran ring shows one absorption peak of dissymmetrical stretching vibration at 920 cm−1 and the α-type saccharide usually shows strong absorption, while the β-type saccharide shows weak absorption at this wave number. 16 As shown in Figure 3, the BOS shows very weak absorption at 920 cm−1 and no peak at 844±8 cm−1, which results from the stretching vibration of the C-H bond in the α-anomer. From this evidence it was inferred that BOS is a β-type saccharide composed of β-D-pyran glucose.
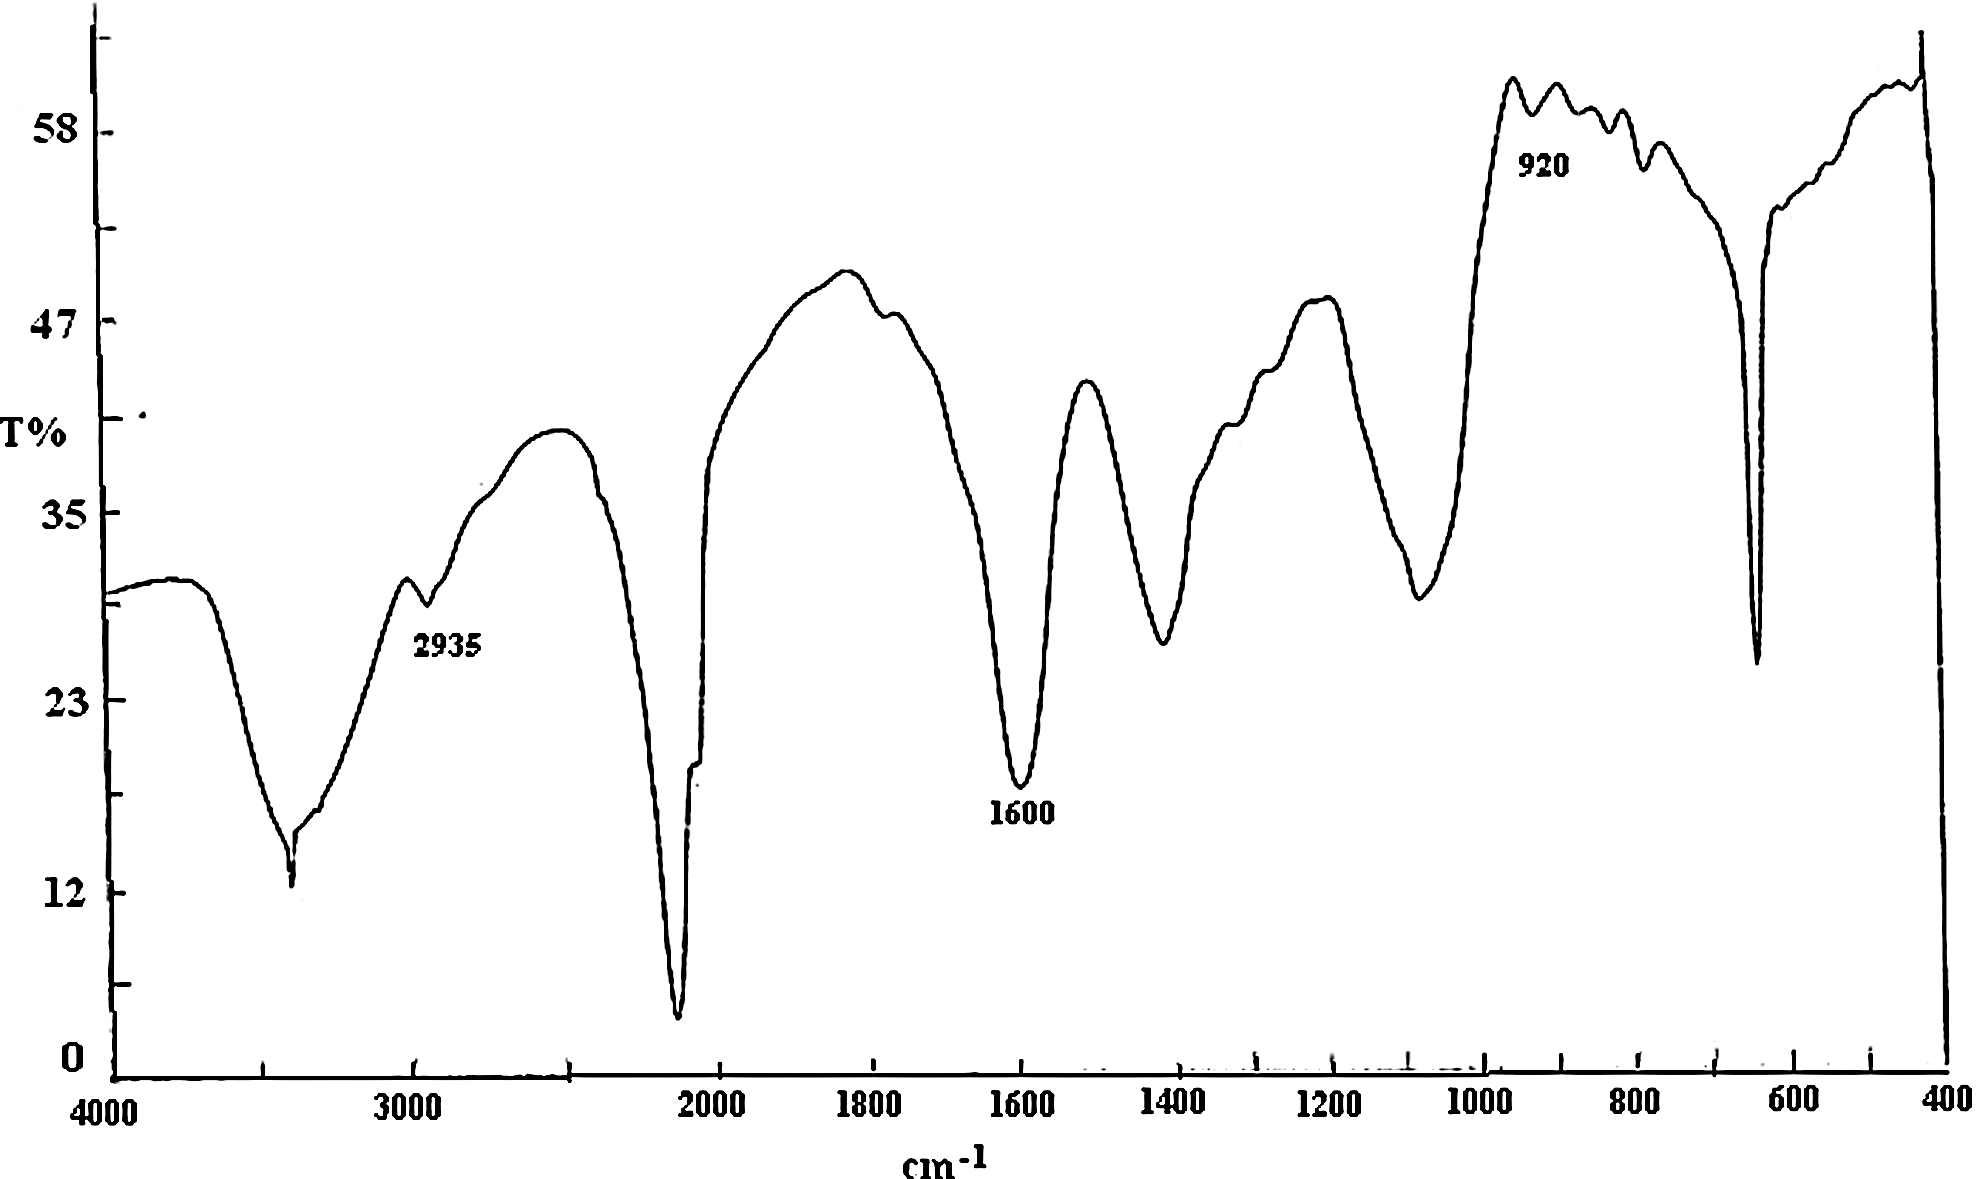
Infrared spectrum of BOS.
The nuclear magnetic resonance (NMR) spectrum of BOS is shown as Figure 4. Pretsch et al. published the 13 C NMR spectral data of β-D-glucose, which showed that the chemical shift of C1–C6 is 96.7, 75.1, 76.7, 70.6, 76.8, and 61.7, respectively. 20 Although the chemical shift of C2–C5 was also found to be similar in the 13 C NMR spectrum of BOS (Fig. 4b), the chemical shift of C1, C6 were not found in Figure 4b. When C1 is replaced in β-D-glucose, Pretsch et al. found that the chemical shift of C1 in the spectral data was 104.0, 20 and the chemical shift of 104.2 found in BOS (Fig. 4b) is similar to the Pretsch's report for C1, 104.0. This indicates that the C1, C6 replacement may occur in β-D-glucose in BOS.
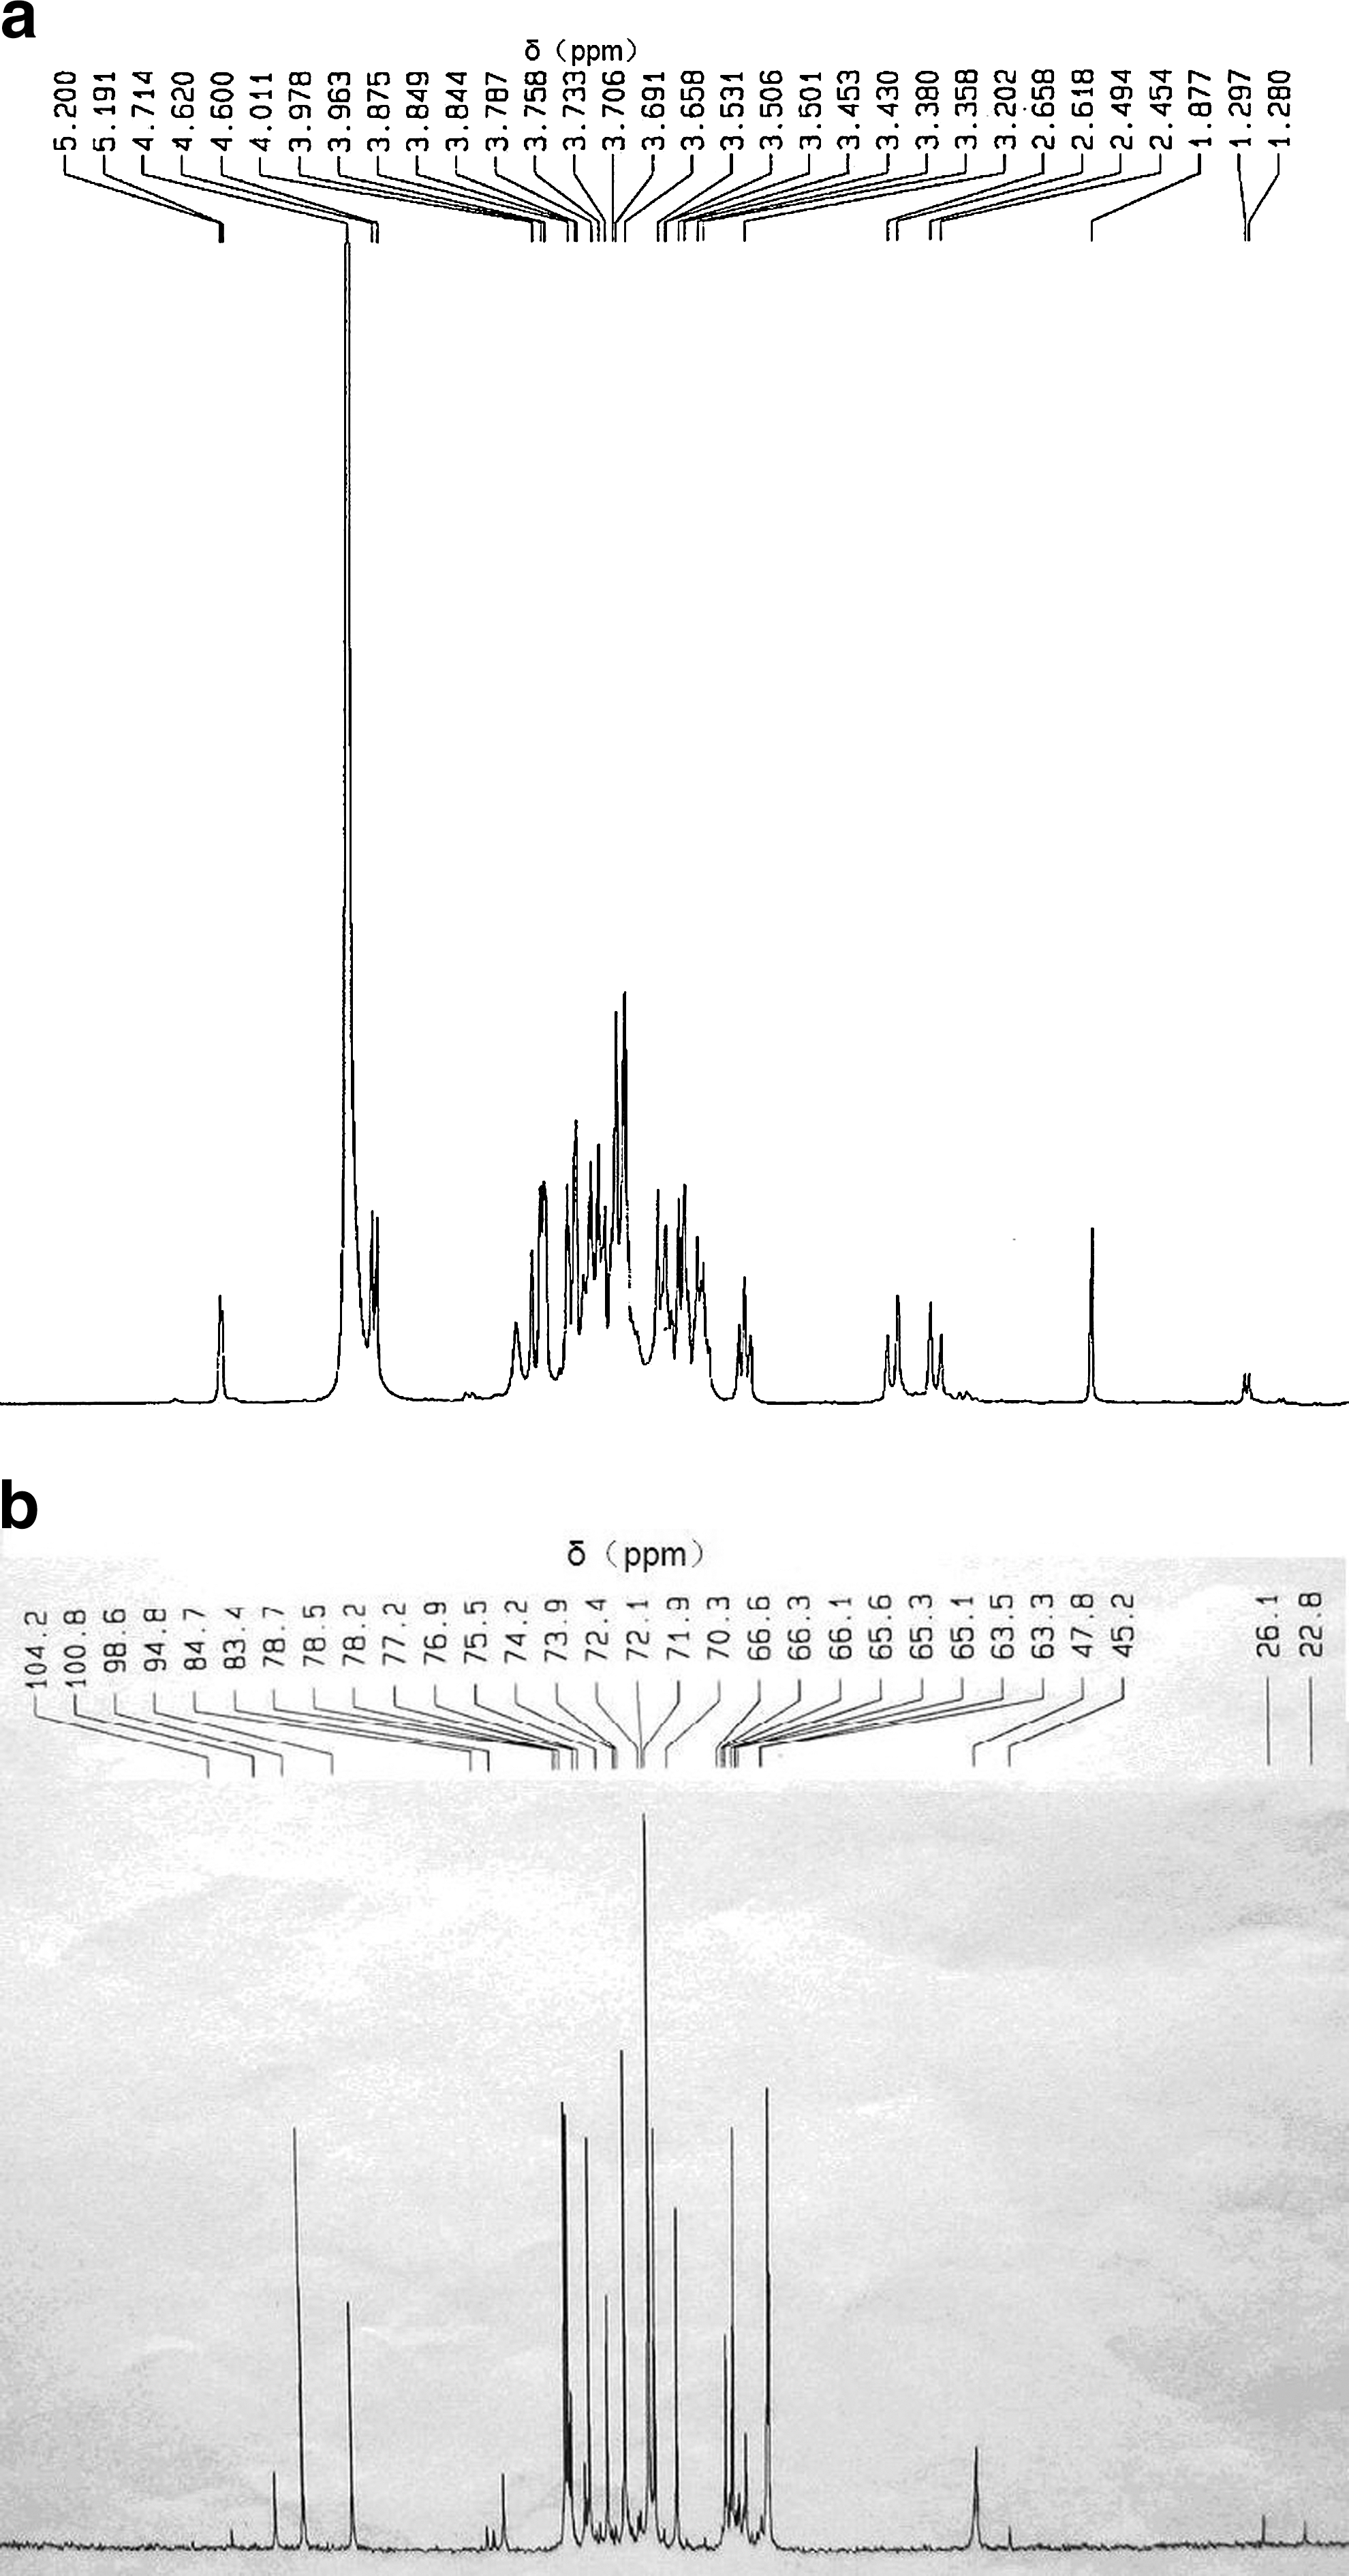
NMR spectrum of BOS.
By comparison with the 13 C NMR data for various saccharides composed of glucose reported by Zhang, 16 the spectral data for BOS suggest almost the same chemical shift data of the [β-D-Glc(1→6)]n.
Hence, BOS is probably composed of eight β-D-pyran glucose units linked with 1→6 indican bonds. The proposed structural formula is shown in Figure 5.
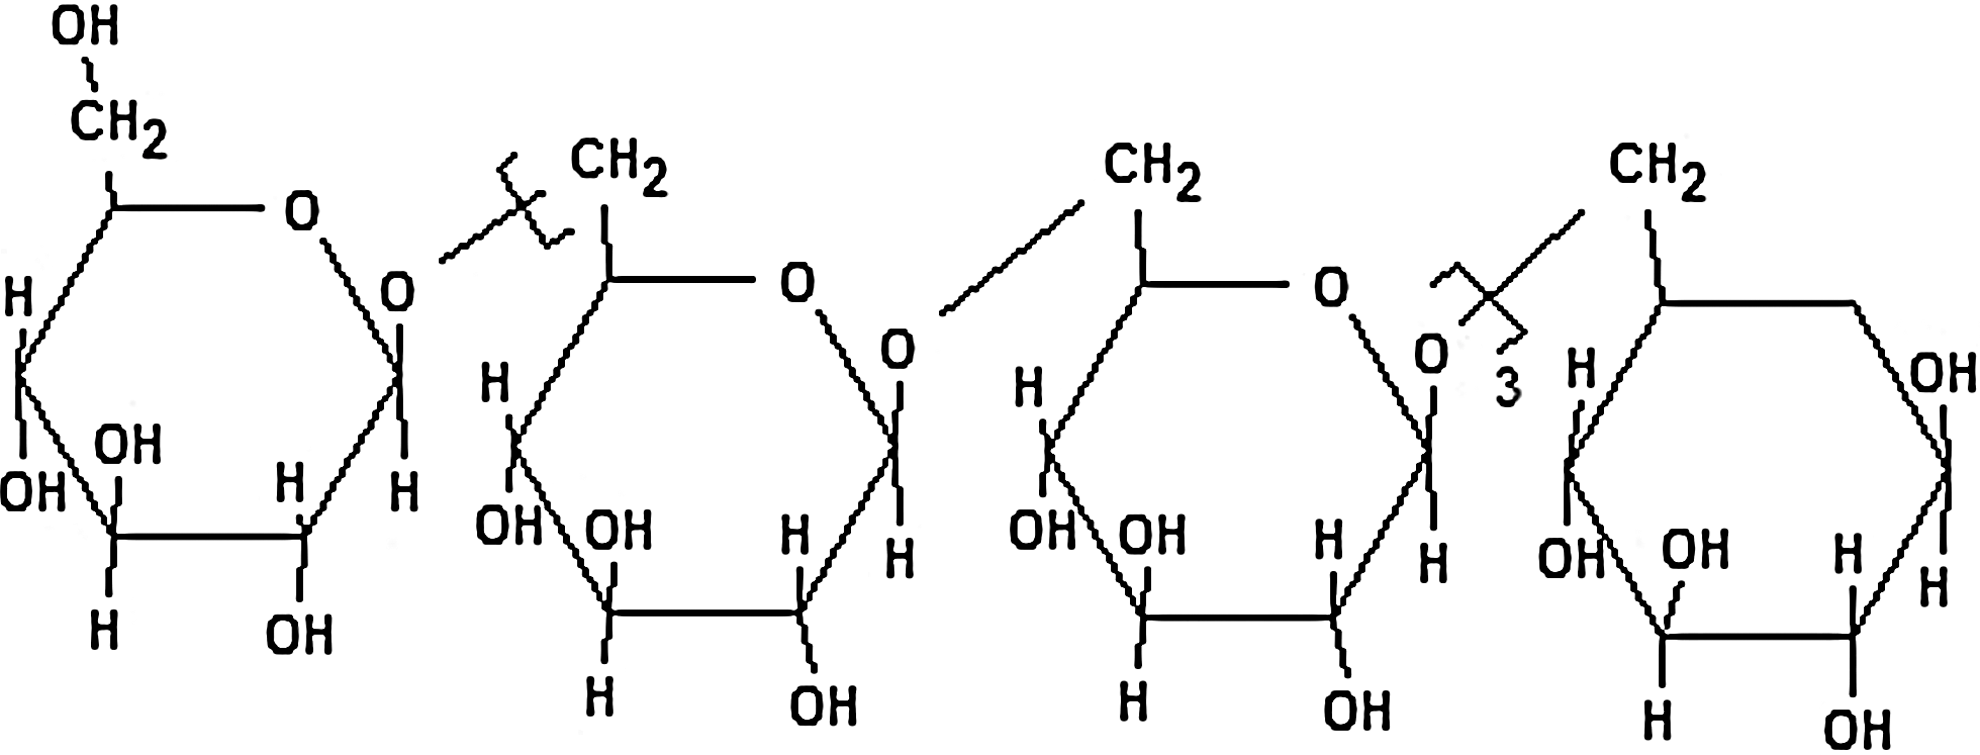
Structural formula of BOS.
Laxative effects of BOS
Analysis of small intestinal movement
As can be seen in Table 1, there were no significant differences in the original body weights, final body weights, or daily food intakes among the five groups of mice, implying that BOS have no negative effects on body weight or food intake in mice.
Data are mean±standard deviation.
Statistically significant compared with control group, * P<.05.
BOS, banana oligosaccharide.
When the value of X was calculated from the CSS advance ratio ρ, the average value for the control group was found to be significantly lower than that for the model group, indicating that the intestinal advance of the CSS was greater in the control mice (Table 2). This means that the constipation model induced by diphenoxylate was successful. The average values for the low-, middle-, and high-dose groups were also found to be lower than that of the model group, suggesting that even the low dose of BOS is effective in accelerating the movement of the small intestine.
Data are mean±standard deviation.
Statistically significant compared with model group, * P<.05.
CSS, carbon suspension solution.
Analysis of dejecta
Table 3 shows that the time to the first black dejecta in the control group was significantly shorter than that in the model group, which indicates that the constipation model induced with diphenoxylate was successful. The time to the first black dejecta in the low-dose group was significantly shorter than that in the model group. There was no significant difference in the moisture content of the dejecta between the three BOS-treated groups, the control group, and the model group, suggesting that permeation pressure caused by the oligosaccharides may not be the main cause of the laxative effect of BOS.
Data are mean±standard deviation.
Statistically significant compared with model group, * P<.05.
The control group and the three BOS-treated groups did not differ significantly from the model group in the number of dejecta granules produced at 3 h or the dejecta weight at 6 h (Table 3). However, the dejecta weight at 3 h in the high-dose group was significantly lower than that in the model group. The number of dejecta granules produced at 6 h was also significantly lower in the middle- and high-dose groups than in the model group. It is therefore proposed that increasing the dosage of BOS may not improve its laxative effects, and that the low-dose of BOS used in this study is the better dose.
Conclusions
In this article, BOS were separated, purified, and identified, then their laxative functions were investigated using animal experiments. Basing on the analysis of GPC, thin layer chromatograph, CE, Fourier transform infrared spectroscopy and NMR, it was found that BOS were likely to be composed of eight β-D-pyran glucose units linked with 1→6 indican bonds. Furthermore, the assessment results of the facilitation of feces excretion by mice experiments show that BOS have accelerated the movement of the small intestine. Therefore, bananas and their oligosaccharides are able to be utilized as health food with laxative functions. At the same time, further research should be done in the future to understand the relationship between the BOS dose and the granules and their weight of feces.
Footnotes
Acknowledgment
This research was supported by the Foundation for Distinguished Young Talents in Higher Education of Guangdong, China (no. LYM10016).
Author Disclosure Statement
No competing financial interests exist.