
Abstract
Although diagnostic criteria for metabolic syndrome (MtS) vary among various health professionals and organizations, blood glucose dysregulation and insulin resistance are common to all definitions. Red ginseng is beneficial for glucose regulation and insulin sensitivity but the mechanism is not yet elucidated. Ginsenosides Rh1 and Rg3 act as ligands of the estrogen receptor, and Rh2 and compound K act as ligands of the glucocorticoid receptors, which may influence the diabetes markers. The objective of this study was to test the hypothesis that there are significant causal relationships among diabetes-related markers and several hormones, and assess whether or not the consumption of fermented red ginseng (FRG) influences these causal relationships by multiple group path analysis and conventional statistical analyses. The 93 postmenopausal women were randomly divided into two groups for a double-blind trial. FRG powder and placebo were provided for 2 weeks. The data were analyzed by multiple group path analysis and the mean between groups were compared. The model's goodness of fit was excellent, with a root mean square error of approximation of 0.00, and comparative fit index of 1.00. The FRG group exhibited significantly increased levels of dehydroepiandrosterone sulfate (DHEAS), growth hormone (GH), and estradiol (E2), and they exhibited decreased levels of glycosylated hemoglobin (HbA1c), insulin, and homeostatic model assessment of insulin resistance. With regard to the hypothesis, the blood glucose lowering effects of FRG were due to the negative effects of aldosterone and increased GH, which was associated with DHEAS and E2. Even though the differences of variables between both groups were small, the total effects of these variables may indicate beneficial changes for the prevention of diabetes in healthy postmenopausal women.
Introduction
T
Although these diagnostic criteria include a broad spectrum of definitions and points of emphasis, 2 several major components of MtS diagnosis are shared among various professional bodies, especially, blood glucose and insulin resistance.
Studies have reported that the incidences of MtS in postmenopausal women were as high as 35.1% in Latin America, 3 35% in Portugal, 4 33% in the United States, 5 and 27.3% in China. 6 A low level of E2 is considered as a major cause of MtS, and estrogen hormone replacement therapy (HRT) decreases this risk in postmenopausal women. For example, postmenopausal women who undergo HRT show a 12.9% decrease in insulin resistance and a 35.8% reduction in the incidence of diabetes. 7 However, a study by the Women's Health Initiative reported that HRT increases the risk of gynecological cancer and obesity and has a negligible beneficial effect on cardiovascular diseases. 8 Given the severity of these HRT side effects, the study of estrogen mimics—including selective estrogen receptor modulators—has emerged as an important MtS treatment area. 9 On the other hand, many studies have shown that the rate of onset of MtS is related not only to estrogen levels, but also to the levels of other hormones, 10 which may be due to the broad and complicated interrelationships of the constituents of the endocrine system.
Ginseng is one of the most popular herbal supplements in Asia, especially Korea, China, and Japan, and records document its use back to 2000 years. 11 In modern times, the popularity of ginseng has grown in western countries as well. For example, ginseng ranked as one of the top-10 selling herbal supplements in the United States in 2003. 12 The primary pharmacological components in ginseng are known as ginsenosides, chemicals that have a steroid skeleton. Studies have shown that ginsenosides, Rh1 and Rg3 act as ligands of the estrogen receptor (ER), and that Rh2 and compound K (CK) act as ligands of the glucocorticoid receptor (GR). 13,14 Many studies have reported that red ginseng is beneficial for glucose regulation and insulin sensitivity. 15,16 One possible hypothesis would be that ginsenosides can influence the variables of diabetes, and the functioning of the endocrine system. The first objective of this study was to test the hypothesis that there are significant causal relationships among diabetes-related markers and several hormones by a path analysis. The second objective was to test the hypothesis that consumption of fermented red ginseng (FRG) influences these causal relationships by multiple group path analysis and conventional statistical analyses.
Materials And Methods
Participants and study design
This study was approved by the Institutional Review Board of Sahmyook University (Seoul, Korea). Women aged 50–73 years were recruited from several Catholic churches (Seoul, Korea). Participants with hypertension or diabetes and those taking prescription or other drugs were excluded. Dietary supplements were not allowed during the experimental period.
The 117 volunteers were randomly divided into two double-blinded groups. FRG powder was provided by Bifido Inc. (Gangwon-do, Korea). One group (the FRG group) took FRG capsules three times a day, each time taking a dose of three capsules (2.1 g/day) for 2 weeks. The other group took a placebo containing starch. The composition of the FRG capsules was crude saponin, 258.6 mg/g; Compound K, 57.05 mg/g; Rg3, 53.85 mg/g; Rh2, 11.97 mg/g; Rg2, 5.72 mg/g; Rh1, 2.99 mg/g; and Rb1, 0.023 mg/g. Blood samples, after 8 hours of fasting, were collected before and after the 2-week intake of either the FRG or the placebo capsules. The blood samples were collected between 8:00 a.m. and 10:00 a.m. Urine samples were collected 24 hours prior to collection of blood samples. All 117 women participated in the first blood sample collection, but only 93 women participated in the second blood sample collection (Fig. 1). Ninety of the 93 participants were postmenopausal, and three were perimenopausal.
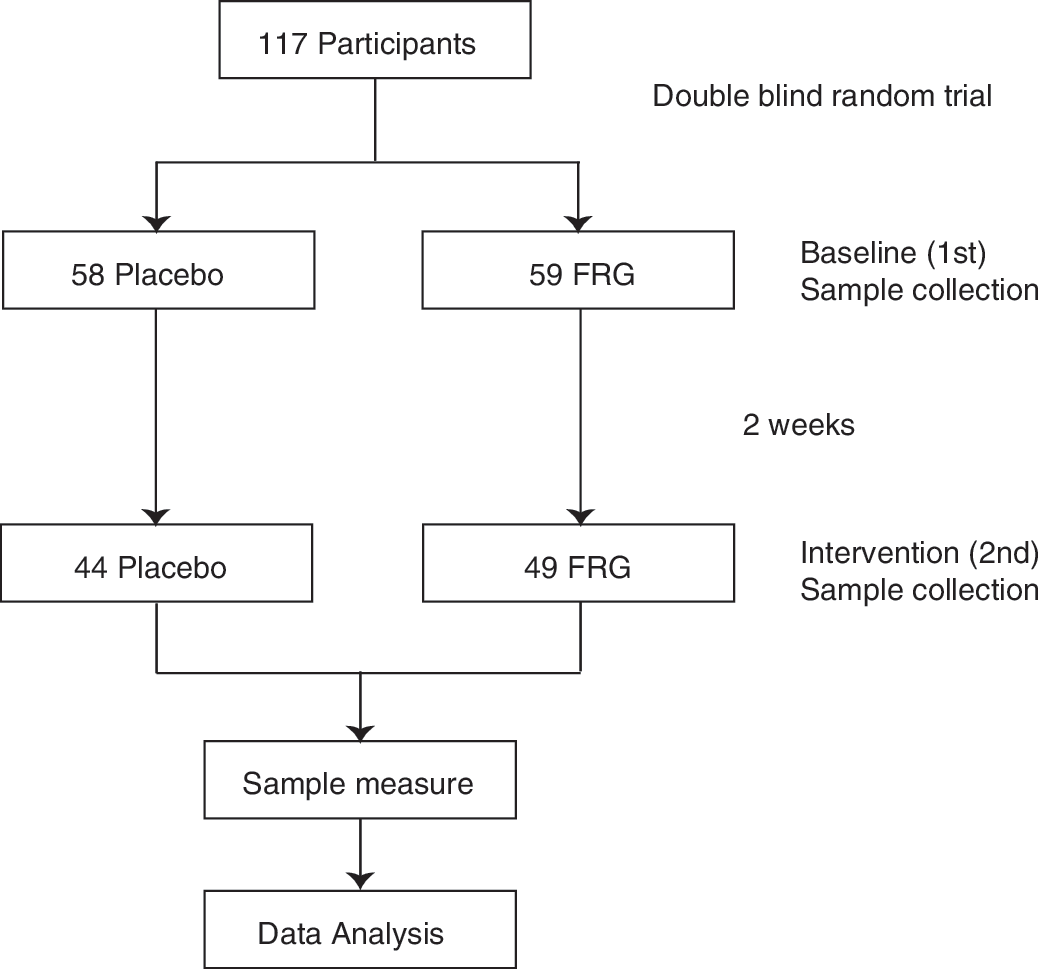
Flowchart of this study.
Forty subjects were selected from both groups (20 subjects per group) after matching age, height, weight, and BMI and were further analyzed for several hormones (Table 1). All biochemical components were measured by the Green Cross Reference Lab (Gyeonggi-do, Korea). The analytical methods are shown in Appendix Table A1.
Data expressed as a mean SD.
Values are significantly different as indicated (* P<.1, ** P<.05, *** P<.01) by aanalysis of covariance or bindependent t-test.
ACTH, adrenocorticotropic hormone; ADH, antidiuretic hormone; CBG, cortisol-binding globulin; CRH, corticotropin-releasing hormone; DHEAS, dehydroepiandrosterone sulfate; E2, estradiol; FRG, fermented red ginseng; FSH, follicle stimulating hormone; GH, growth hormone; HbA1c, glycosylated hemoglobin; HOMA-IR, homeostasis model of insulin resistance; HPA axis, hypothalamic–pituitary–adrenal axis; HPG axis, hypothalamic–pituitary–gonadal axis; HPS axis, hypothalamic–pituitary–somatotroph axis; IGF-1, insulin-like growth factor-1; LH, luteinizing hormone.
Statistical analyses
Given that the production of the estrogen hormone slowly decreases during the first five postmenopausal years, the three perimenopausal women were included in this analysis. The baseline comparisons of both groups between the first baseline sample and the second postintervention values were compared by independent t-test. The means of the postintervention samples were also compared between the FRG group and the placebo group, with an analysis of covariance (ANCOVA) by SPSS 18.0 (SPSS, Inc., Chicago, IL, USA). The level of statistical significance was P<.05 and a statistical tendency was considered as P<.1. The outliers that were over three times the standard deviation were excluded in the estrogen, insulin, and homeostasis model of insulin resistance (HOMA-IR) variables. The HOMA-IR index was calculated as follows:
The unmeasured hormones of 53 participants, and some data that could not be measured due to the detection limitation of the instruments, were considered as random missing values. Following this, 10 data sets were generated using the multiple imputation method and then were analyzed by Mplus 6.11 (Muthén & Muthén, Los Angeles, CA, USA).
Results
Anthropometric data
Table 2 shows the anthropometric variables of the participants. There was no significant difference between the FRG and the placebo groups in the mean values of age, weight, height, BMI, waist, and hip circumsference.
Data are mean±SD values.
BMI, body mass index.
Mean
Table 1 shows the means of the variables from the intervention samples taken after 2 weeks, and the difference between the first baseline sample and the week 2 intervention sample. The results from the week 2 intervention sample show that the level of growth hormone (GH, 1.8 vs. 0.9 ng/mL), estradiol (E2, 18.3 vs. 14.5 pg/mL), and dehydroepiandrosteronesulphate (DHEAS, 66.2 vs. 65.2 μg/dL) were significantly higher in the FRG group than in the placebo group, at P<.1. The mean values of insulin (6.2 vs. 6.4 μU/mL), HbA1c (5.70 vs. 5.77%), and the HOMA-IR (1.36 vs. 1.42) indexes were significantly lower in the FRG group than in the placebo group.
When the first and second sample were compared, the values of E2 (1.0 vs. −7.4 pg/mL) and DHEAS (0.6 vs.−6.2 μg/dL) were higher in the FRG group than in the placebo group, and the values of insulin (−0.2 vs. 1.0 μU/mL), glycosylated hemoglobin (HbA1c, 0.06 vs. 0.09%), and HOMA-IR (−0.09 vs. 0.17) were significantly lower in the FRG group than in the placebo group, but the values of GH were not significantly different (Table 1).
Path model
In this model, all paths were established based on the results of precedents, which can be found in previously published studies, but these paths were not based on a strict statistical correlation. 17 The studies that established the precedents for these path models are presented in Table 3, 1,18 –33 and the correlations are presented in Appendix Table A2.
Path analysis is a useful statistical analysis method, one that can analyze several causal relationships among several variables at the same time. Further, multiple group path analysis allows for the comparison of the path coefficients between two groups, followed by identifying statistical significances of the differences between two path coefficients. Therefore, the multiple group path analysis may be a useful tool for the analysis of the complicated interrelationship between hormonal and diabetes variables. One of the major purposes of this multiple group path model was to analyze whether there was invariance of path coefficients across two groups. The testing of equivalence was conducted in two steps. First, a baseline model was established, followed by equality constraints of the path coefficients of the two groups. The path coefficients of the baseline model are presented in Table 4, and the final path model after equality constraints test presented in Figure 2.
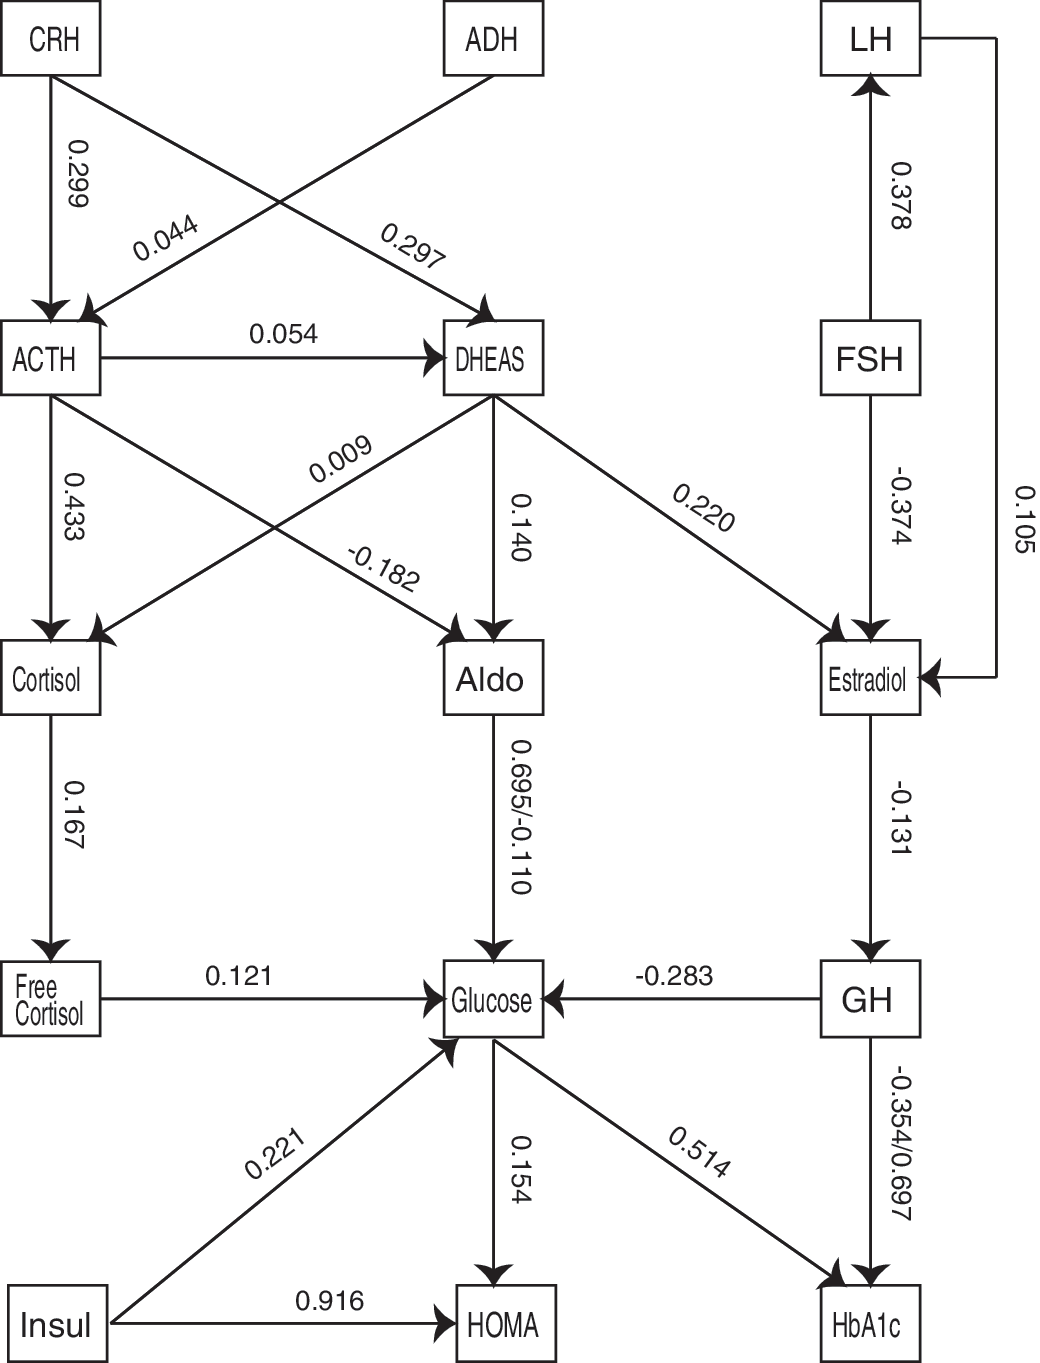
The final path model of hormones and diabetes markers. Two paths showed the significant differences in the present path model. First, the path coefficient of aldosterone (Aldo) on blood glucose was significantly different across two groups (P=.005). Second, the path coefficient of growth hormone (GH) on blood glucose was significantly different across two groups (P=.009). These invariance tests were conducted by the Wald test, and the numbers in parenthesis present the unstandardized path coefficients.
Data expressed as a mean±SD. Values presented in boldface indicate significant difference (P<.05) between FRG and control groups by the Wald test.
Wald test was performed using one unstandardized path coefficient.
Values are significantly different (* P<.1, ** P<.05, *** P<.01) by analysis of covariance.
An unstandardized path coefficient shows that when a causative variable increases by a value of one unit, the resultant variable changes in value. In the baseline model (Table 4), when E2 increased by 1 pg/mL, GH increased to 0.160 ng/mL in the FRG group; whereas GH decreased to 0.301 ng/mL (P=.02) in the placebo group. To compare the several causative variables with the one resultant variable, standardized path coefficients were used. When a causative variable changed by one standard deviation, the resultant variable changed by the same value of the standardized path coefficient. In the FRG group, when aldosterone increased to one standard deviation (3.6 ng/dL), blood glucose significantly decreased to 0.147 of one standard deviation (7.1 mg/dL×0.147=1.00 mg/dL), whereas free cortisol increased to one standard deviation (14.0 μg/day), and blood glucose increased to 0.032 of one standard deviation of blood glucose (7.1 mg/dL×0.032=0.227 mg/dL) (Table 4).
To assess whether or not the difference in a path between groups was significant, the Wald test with cross-group equality constraints was employed. When the difference between the original chi-square value and the cross-group equality constrained chi-square value was higher than 3.84, the hypothesis of cross-group equality was rejected, which meant the differences were statistically significant. In the path of aldosterone to blood glucose, when the path coefficients between the FRG group and the placebo group were constrained for cross-group equality, the value of the Wald test was 6.90 and the P value was 0.009. Therefore, the path coefficients between both groups were significantly different. (Table 4).
Based on the results listed above, the final model was made and presented in Figure 2. The model's goodness of fit was excellent, as accounted for by the measures root mean square error of approximation (0.00) and comparative fit index (1.00). The chi-square of the model was 146.5; the degree of freedom value was 198.
Discussion
Hormones
The highest percentages of ginsenosides in this FRG capsule were Rg3 and compound K, which are the ligands of ER and GR, respectively. Therefore, the hormones evaluated in this study were those on the hypothalamic–pituitary–adrenal (HPA) axis and those on the hypothalamic–pituitary–gonadal (HPG) axis; the central variables for diabetes were blood glucose, HbA1c, insulin, and HOMA-IR.
The peak period of DHEAS production is between the ages of 20–30 years, followed by a decrease of 2% every year, until the rate of release is finally only 10–20% of the peak levels at 70 years of age. 34 Studies reported that DHEAS, E2, and GH have serial causative relationships. Pluchino and colleagues reported that when DHEAS was administered to postmenopausal women, the level of estrogen increased, 35 which is consistent with the path coefficient of DHEAS to E2 (0.307) in the equality constraint state (Fig. 2). When the level of estrogen increases during the menstrual cycle, the level of GH also increases, 27 which is consistent with the path coefficient of E2 to GH (0.160) in the FRG group, but not consistent with the path coefficient of E2 to GH in the placebo group (−0.301; Table 4). Studies have reported that the level of GH is negatively correlated with the incidence of insulin resistance. Colao et al. reported that after administration of GH, subjects showed a significant decrease in insulin resistance, 36 which is consistent with the path coefficient of GH to blood glucose (−0.358) in this study. Nam et al. reported that there was no difference in the levels of GH between a red ginseng group and a placebo group, whereas red ginseng consumption with aerobic exercise was found to significantly increase the level of GH, 37 which is consistent with the higher GH level in the FRG group. Salpeter and colleagues reported in a meta-analysis that HRT decreases insulin resistance (HOMA-IR) by 12.9%, and reduces the risk of diabetes by 35.8% in postmenopausal women. 38 Considering the report of Salpeter et al., 38 in this study, the higher level of E2 in the FRG group should be beneficial for glucose management.
Since the levels of E2, GH, and DHEAS gradually decrease along with ageing and the postmenopausal period, even though the mean differences between groups were small, the cumulative effects of these hormonal increments in the FRG group can be interpreted as having the potential to affect the progress of diabetes.
Vuksan and colleagues reported that the consumption of red ginseng improved glucose and insulin regulation in 19 participants with well-controlled type 2 diabetes. Red ginseng consumption decreased fasting plasma insulin by 8 pM, plasma glucose during a 75 g oral glucose tolerance test (OGTT) by 8–11%, and it increased the fasting-HOMA-insulin sensitive index by 33%. 15 In this study, the insulin levels and HOMA-IRs of the second sample, and the gap between the second and first sample, were both significantly lower in the FRG group than in the placebo group (Table 1). Vogeser et al. 39 reported that the distribution of HOMA-IR results was mainly determined by fasting serum levels rather than fasting glucose levels, because of the high variability of fasting serum insulin concentrations. In this path model, the contribution ratios in HOMA-IR of insulin and blood glucose were 0.918 and 0.157 respectively in the standardized path coefficients (Table 4).
Clinically, the HbA1c level reflects the average concentration of blood glucose for 2 or 3 months. The American Diabetes Association considers HbA1c as a criterion for the diagnosis of diabetes. Normally, HbA1c increases 0.1% every decade after 40 years of age. 40 In the difference between the second and first sample in this study, the level of HbA1c was significantly lower in the FRG group than in the placebo group.
In the path analysis, aldosterone was the largest single factor in the decreased blood glucose of the FRG group. Aldosterone regulates blood glucose through a mineral corticoid receptor (MR)-dependent mechanism with GLUT4 and GLUT2, and an MR-nondependent mechanism with an insulin receptor. 41 GLUT4 is a glucose transporter that is highly expressed in skeletal muscle and adipose tissue. 42 When insulin stimulates the cells, GLUT4 in the cytosol translocates to the cell membranes, and transports glucose across the cell membrane. Therefore, the impairment of GLUT4 functionality is an important cause of insulin resistance, as seen in type 2 diabetes patients. 43 When aldosterone is administrated to rats, the level of GLUT4 protein drops remarkably in muscle cells, whereas glucocorticoid treatments increase the expression of GLUT4. 44 Since the effects of aldosterone on GLUT4 are related to MR-MR homodimer and MR-GR heterodimer, and it is well known that cortisol is a ligand of GRs, cortisol levels can also related to the GLUT4 mechanism. Huang et al. reported that when CK or Rg1 was administered to adipocyte cell lines, GLUT4 mRNA and glucose uptake increased. This increase implicated GLUT4 movement from intracellular vesicles to the plasma membrane. 45 The MR-nondependent mechanism in glucose regulation of aldosterone is related to the gene expression of the insulin receptor. GREs on the promoter of insulin receptor are regulated by an MR-MR homodimer or an MR-GR heterodimer. When aldosterone was administered to MIN6 beta cells, a pancreas cell line, insulin release was suppressed. 46 Since the aldosterone and glucocorticoid share the GR and MR, 47 it is possible that ginsenosides, especially compound K, may interact with aldosterone functions.
In conclusion, in the conventional average comparison, the FRG group significantly increased the levels of DHEAS, GH, and E2, and decreased the levels of HbA1c, insulin, and HOMA-IR. In the hypothesis of this path model, DHEAS, E2, GH, blood glucose, and HbA1c established a causal relationship. The blood glucose lowering effects of the FRG group came from two causal effects. One line was the negative effects of aldosterone and the other line was GH, which was connected with DHEAS and E2. Considering the participants were healthy postmenopausal women who may be assumed to have a healthy level of homeostasis, the small difference of several variables may be reasonable and somewhat desirable, and the cumulated summation of these variable changes in the FRG group cannot be ignored as a potential preventive effect for postmenopausal women at risk of developing diabetes.
The fermentation process of ginseng transforms the inactive state of the ginsenosides, Rb1, Rc, Rb2, Rb3, and Rd, to a bioactive state, rendering the ginsenosides into an easily absorbable structure such as CK. 48 The effect of red ginseng can vary depending on the type, ratio, period, and ginsenoside dose. Therefore, for a better understanding of the effects of ginseng, a study with a single type of ginsenoside and unhealthy participants, including those with diabetes or cardiovascular disease, may prove instructive.
Footnotes
Acknowledgments
We thank Mr. John Mensing (PhD Candidate, Department of Pali and Buddhist Studies, University of Peradeniya, Peradeniya, Sri Lanka), who assisted with the proofreading of the article. This work was supported by the Next-Generation BioGreen 21 Program (No. PJ009543), Rural Development Administration, and by the Small and Medium Business Administration (SA114187), Republic of Korea.
Author Disclosure Statement
No competing financial interests exist.
| Test name [units of measurement] | ||||||||
|---|---|---|---|---|---|---|---|---|
| ACTH [pg/mL] | ADH (RIA) [pg/mL] | Aldosterone [ng/dL] | Cortisol [μg/dL] | Cortisol, free [μg/dL] | CRH [ng/dL] | DHEA-S [μg/dL] | Estrogen (E1) [pg/mL] | |
| Test code | E416 | E418 | E436 | E435 | E439 | — | E431 | E010 |
| Test method | IRMA | RIA | RIA | RIA | RIA | EIA | RIA | RIA |
| Storage method of sample | Cold storage | Cold storage | Cold storage | Cold storage | Cold storage | Cold storage | Cold storage | Cold storage |
| Reagent | ||||||||
| Kit name | ACTH IRMA | Vasopressin 1251 RIA kit | Coat-A-Count Aldosterone | Coat-A-Count Cortisol | Coat-A-Count Cortisol | CRH EIA kit | Coat-A-Count DHEA-Sulfate | Total Estrogen |
| Kit company, nationality | Brahms, Germany | DiaSorin, USA | Siemens, USA | Siemens, USA | Siemens, USA | Phoenix, USA | Siemens, USA | ICN, USA |
| Analytical instrument | ||||||||
| Instrument name | R-counter | R-counter | R-counter | R-counter | R-counter | EIA reader | R-counter | R-counter |
| Model name | Cobra 5010 series Quantum | Cobra 5010 series Quantum | Cobra 5010 series Quantum | Cobra 5010 series Quantum | Cobra 5010 series Quantum | E max presion | Cobra 5010 series Quantum | Cobra 5010 series Quantum |
| Company, nationality | Packard, USA | Packard, USA | Packard, USA | Packard, USA | Packard, USA | Molecular Devices, USA | Packard, USA | Packard, USA |
| Reference range | 8–10 a.m.: 10–60 8–10 p.m.: 6–30 |
≤4.7 | Supine: 1.0–16.0 Standing: 4.0–31.0 |
a.m.: 5–25 p.m.: half of a.m. values |
20–90 | Standard range in kit: 0.04–25 | M: 80–560 F: 35–430 |
M, adult: 40–115 M or F, prepubertal: ≤40 F, follicular: 61–394 midcycle: 122–437 luteal: 156–350 postmenopausal: ≤40 |
| Test name | ||||||||
|---|---|---|---|---|---|---|---|---|
| Estrogen (E2) [pg/mL] | FSH [mU/mL] | Glucose (S) [mg/dL] | HbA1c [%] | HGH (S) [ng/mL] | IGF-1 [ng/mL] | Insulin [μU/mL] | LH [mU/mL] | |
| Test code | C001 | E421 | C123 | C431 | E417 | E455 | E441 | E422 |
| Test method | CLIA | CLIA | Enzymatic method | HPLC | CLIA | CLIA | ECLIA | CLIA |
| Storage method of sample | Refrigeration | Cold storage | Refrigeration | Refrigeration | Cold storage | Cold storage | Cold storage | Cold storage |
| Reagent | ||||||||
| Kit name | Advia Centaur Estradiol | Advia Centaur FSH | Glucose Hexokinase | Variant II HbA1c T. | Immulite 2000 GH | IGF-1 | Insulin | Advia Centaur FSH |
| Kit company, nationality | Bayer, USA | Siemens, USA | Bayer, USA | Bio-Rad, Germany | DPC, USA | DPC, USA | Roche, Germany | Siemens, USA |
| Analytical instrument | ||||||||
| Instrument name | Centaur | Advia Centaur | Advia | Variant | Immulite | Immulite 2000 | Modular Analytics | Advia Centaur |
| Model name | Advia Centaur | Advia Centaur | Advia 1650 | Variant II Turbo | Immulite 2000 | Immulite 2000 | E170 | Advia Centaur |
| Company, nationality | Bayer, USA | Siemens, USA | Bayer, Japan | Bio-Rad, Germany | DPC, USA | DPC, USA | Roche, Germany | Siemens, USA |
| Reference | M: <52 F, follicular: 11–165 midcycle: 146–526 luteal: 33–196 postmenopausal: <37 |
M, 13–70 years: 1.4–18.1 F, follicular: 2.5–10.2 midcycle: 3.4–33.4 luteal: 1.5–9.1 pregnant: <0.3 postmenopausal: 23.0–116.3 |
70–110 | 3.5–6.5 | M, adult: ≤1.0 F, adult: ≤10.0 |
1–5 years: 49–327 6–8 years: 52–345 9–11 years: 74–551 12–13 years: 143–850 14–17 years: 193–996 18–25 years: 116–584 26–40 years: 109–329 41–55 years: 87–267 >55 years: 55–225 |
2.6–24.9 | M, 20–70 years: 1.5–9.3 >70 years: 3.1–34.6 F, follicular: 1.9–12.5 midcycle: 8.7–76.3 luteal: 0.5–16.9 pregnant: <1.5 postmenopausal:15.9–54.0 |
CLIA, chemiluminescence immunoassay; ECLIA, electrochemiluminescence immunoassay; EIA, enzyme immunoassay; HPLC, high-performance liquid chromatography; IRMA, immunoradiometric assay; RIA, radioimmunoassay.
| ACTH | ADH | Aldosterone | CRH | DHEAS | E2 | FSH | GCs | fGCs | GH | Glucose | HbA1c | IGF1 | Insulin | LH | |
|---|---|---|---|---|---|---|---|---|---|---|---|---|---|---|---|
| ACTH | |||||||||||||||
| Pearson coefficient | 1 | −0.051 | −0.368 ** | 0.008 | 0.119 | −0.093 | −0.304 | 0.513 *** | −0.022 | −0.366 ** | 0.050 | −0.040 | 0.022 | 0.140 | −0.357 ** |
| Significance (two tail) | 0.754 | 0.020 | 0.959 | 0.255 | 0.568 | 0.057 | 0.000 | 0.837 | 0.020 | 0.637 | 0.707 | 0.833 | 0.187 | 0.024 | |
| Sum of square | 11,165.430 | −3.661 | −543.483 | 0.407 | 3625.281 | −278.712 | −2640.150 | 1892.192 | −325.209 | −201.538 | 353.358 | −391.634 | 1522.510 | 325.886 | −1847.679 |
| Covariance | 121.363 | −0.094 | −13.935 | 0.011 | 39.405 | −7.146 | −67.696 | 20.567 | −3.654 | −5.168 | 3.841 | −4.257 | 16.549 | 3.662 | −47.376 |
| n | 93 | 40 | 40 | 39 | 93 | 40 | 40 | 93 | 90 | 40 | 93 | 93 | 93 | 90 | 40 |
| ADH | |||||||||||||||
| Pearson coefficient | −0.051 | 1 | −0.111 | −0.388 ** | −0.330 ** | 0.026 | −0.152 | 0.043 | −0.023 | −0.031 | −0.078 | 0.041 | −0.022 | 0.048 | −0.138 |
| Significance (two tail) | 0.754 | 0.497 | 0.015 | 0.037 | 0.873 | 0.350 | 0.794 | 0.894 | 0.850 | 0.632 | 0.801 | 0.893 | 0.772 | 0.397 | |
| Sum of square | −3.661 | 1.229 | −2.805 | −0.323 | −72.670 | 1.345 | −22.663 | 1.011 | −2.605 | −0.291 | −3.446 | 2.492 | −8.888 | 0.818 | −12.254 |
| Covariance | −0.094 | 0.032 | −0.072 | −0.009 | −1.863 | 0.034 | −0.581 | 0.026 | −0.072 | −0.007 | −0.088 | 0.064 | −0.228 | 0.022 | −0.314 |
| n | 40 | 40 | 40 | 39 | 40 | 40 | 40 | 40 | 37 | 40 | 40 | 40 | 40 | 39 | 40 |
| Aldosterone | |||||||||||||||
| Pearson coefficient | −0.368 ** | −0.111 | 1 | 0.248 | 0.229 | 0.269 | −0.017 | −0.159 | −0.141 | 0.369 ** | 0.230 | 0.118 | −0.210 | 0.153 | 0.126 |
| Significance (two tail) | 0.020 | 0.497 | 0.129 | 0.155 | 0.093 | 0.919 | 0.326 | 0.404 | 0.019 | 0.153 | 0.468 | 0.194 | 0.352 | 0.437 | |
| Sum of square | −543.483 | −2.805 | 524.054 | 4.256 | 1040.763 | 285.357 | −51.440 | −77.965 | −329.270 | 72.127 | 209.888 | 147.518 | −1750.614 | 54.235 | 232.321 |
| Covariance | −13.935 | −0.072 | 13.437 | 0.112 | 26.686 | 7.317 | −1.319 | −1.999 | −9.146 | 1.849 | 5.382 | 3.783 | −44.888 | 1.427 | 5.957 |
| n | 40 | 40 | 40 | 39 | 40 | 40 | 40 | 40 | 37 | 40 | 40 | 40 | 40 | 39 | 40 |
| CRH | |||||||||||||||
| Pearson coefficient | 0.008 | −0.388 ** | 0.248 | 1 | 0.188 | −0.117 | −0.047 | −0.212 | −0.035 | 0.303 | 0.133 | 0.239 | 0.018 | 0.166 | 0.028 |
| Significance (two tail) | 0.959 | 0.015 | 0.129 | 0.251 | 0.477 | 0.775 | 0.195 | 0.838 | 0.061 | 0.418 | 0.143 | 0.915 | 0.318 | 0.864 | |
| Sum of square | 0.407 | −0.323 | 4.256 | 0.567 | 25.750 | −4.044 | −4.731 | −3.405 | −2.738 | 1.916 | 3.944 | 9.819 | 4.825 | 1.884 | 1.705 |
| Covariance | 0.011 | −0.009 | 0.112 | 0.015 | 0.678 | −0.106 | −0.124 | −0.090 | −0.078 | 0.050 | 0.104 | 0.258 | 0.127 | 0.051 | 0.045 |
| n | 39 | 39 | 39 | 39 | 39 | 39 | 39 | 39 | 36 | 39 | 39 | 39 | 39 | 38 | 39 |
| DHEAS | |||||||||||||||
| Pearson coefficient | 0.119 | −0.330 ** | 0.229 | 0.188 | 1 | 0.142 | 0.230 | 0.067 | −0.077 | −0.049 | 0.183 | 0.133 | 0.169 | 0.125 | 0.162 |
| Significance (two tail) | 0.255 | 0.037 | 0.155 | 0.251 | 0.381 | 0.154 | 0.522 | 0.469 | 0.764 | 0.080 | 0.203 | 0.106 | 0.241 | 0.318 | |
| Sum of square | 3625.281 | −72.670 | 1040.763 | 25.750 | 82918.040 | 1309.486 | 6135.009 | 676.283 | −3082.100 | −83.025 | 3551.608 | 3596.090 | 31,632.259 | 788.628 | 2578.632 |
| Covariance | 39.405 | −1.863 | 26.686 | 0.678 | 901.283 | 33.577 | 157.308 | 7.351 | −34.630 | −2.129 | 38.604 | 39.088 | 343.829 | 8.861 | 66.119 |
| n | 93 | 40 | 40 | 39 | 93 | 40 | 40 | 93 | 90 | 40 | 93 | 93 | 93 | 90 | 40 |
| E2 | |||||||||||||||
| Pearson coefficient | −0.093 | 0.026 | 0.269 | −0.117 | 0.142 | 1 | −0.320 ** | −0.178 | −0.171 | −0.025 | 0.184 | 0.071 | 0.164 | 0.247 | −0.179 |
| Significance (two tail) | 0.568 | 0.873 | 0.093 | 0.477 | 0.381 | 0.044 | 0.273 | 0.311 | 0.879 | 0.256 | 0.664 | 0.311 | 0.130 | 0.269 | |
| Sum of square | −278.712 | 1.345 | 285.357 | −4.044 | 1309.486 | 2149.515 | −2000.403 | −175.953 | −801.559 | −9.824 | 339.385 | 179.371 | 2775.361 | 175.552 | −665.779 |
| Covariance | −7.146 | 0.034 | 7.317 | −0.106 | 33.577 | 55.116 | −51.292 | −4.512 | −22.266 | −0.252 | 8.702 | 4.599 | 71.163 | 4.620 | −17.071 |
| n | 40 | 40 | 40 | 39 | 40 | 40 | 40 | 40 | 37 | 40 | 40 | 40 | 40 | 39 | 40 |
| FSH | |||||||||||||||
| Pearson coefficient | −0.304 | −0.152 | −0.017 | −0.047 | 0.230 | −0.320 ** | 1 | 0.032 | 0.387 ** | 0.075 | 0.027 | −0.224 | −0.048 | −0.238 | 0.618 *** |
| Significance (two tail) | 0.057 | 0.350 | 0.919 | 0.775 | 0.154 | 0.044 | 0.845 | 0.018 | 0.646 | 0.868 | 0.164 | 0.770 | 0.145 | 0.000 | |
| Sum of square | −2640.150 | −22.663 | −51.440 | −4.731 | 6135.009 | −2000.403 | 18,129.884 | 91.615 | 4626.337 | 85.990 | 145.429 | −1648.293 | −2344.634 | −494.963 | 6675.971 |
| Covariance | −67.696 | −0.581 | −1.319 | −0.124 | 157.308 | −51.292 | 464.869 | 2.349 | 128.509 | 2.205 | 3.729 | −42.264 | −60.119 | −13.025 | 171.179 |
| n | 40 | 40 | 40 | 39 | 40 | 40 | 40 | 40 | 37 | 40 | 40 | 40 | 40 | 39 | 40 |
| GCs | |||||||||||||||
| Pearson coefficient | 0.513 *** | 0.043 | −0.159 | −0.212 | 0.067 | −0.178 | 0.032 | 1 | 0.179 | −0.086 | 0.089 | −0.146 | −0.046 | 0.122 | 0.089 |
| Significance (two tail) | 0.000 | 0.794 | 0.326 | 0.195 | 0.522 | 0.273 | 0.845 | 0.091 | 0.598 | 0.396 | 0.163 | 0.665 | 0.252 | 0.583 | |
| Sum of square | 1892.192 | 1.011 | −77.965 | −3.405 | 676.283 | −175.953 | 91.615 | 1217.652 | 887.288 | −15.674 | 209.940 | −477.044 | −1034.772 | 92.957 | 153.336 |
| Covariance | 20.567 | 0.026 | −1.999 | −0.090 | 7.351 | −4.512 | 2.349 | 13.235 | 9.970 | −0.402 | 2.282 | −5.185 | −11.248 | 1.044 | 3.932 |
| n | 93 | 40 | 40 | 39 | 93 | 40 | 40 | 93 | 90 | 40 | 93 | 93 | 93 | 90 | 40 |
| fGCs | |||||||||||||||
| Pearson coefficient | −0.022 | −0.023 | −0.141 | −0.035 | −0.077 | −0.171 | 0.387 ** | 0.179 | 1 | 0.088 | 0.210 ** | −0.033 | 0.010 | 0.136 | 0.462 *** |
| Significance (two tail) | 0.837 | 0.894 | 0.404 | 0.838 | 0.469 | 0.311 | 0.018 | 0.091 | 0.604 | 0.047 | 0.754 | 0.922 | 0.210 | 0.004 | |
| Sum of square | −325.209 | −2.605 | −329.270 | −2.738 | −3082.100 | −801.559 | 4626.337 | 887.288 | 20,332.205 | 78.186 | 2000.389 | −442.690 | 960.588 | 421.727 | 3834.771 |
| Covariance | −3.654 | −0.072 | −9.146 | −0.078 | −34.630 | −22.266 | 128.509 | 9.970 | 228.452 | 2.172 | 22.476 | −4.974 | 10.793 | 4.904 | 106.521 |
| n | 90 | 37 | 37 | 36 | 90 | 37 | 37 | 90 | 90 | 37 | 90 | 90 | 90 | 87 | 37 |
| GH | |||||||||||||||
| Pearson coefficient | −0.366 ** | −0.031 | 0.369 ** | 0.303 | −0.049 | −0.025 | 0.075 | −0.086 | 0.088 | 1 | −0.139 | 0.181 | 0.203 | −0.171 | 0.265 |
| Significance (two tail) | 0.020 | 0.850 | 0.019 | 0.061 | 0.764 | 0.879 | 0.646 | 0.598 | 0.604 | 0.391 | 0.265 | 0.209 | 0.298 | 0.098 | |
| Sum of square | −201.538 | −0.291 | 72.127 | 1.916 | −83.025 | −9.824 | 85.990 | −15.674 | 78.186 | 72.841 | −47.288 | 84.225 | 632.069 | −22.672 | 181.619 |
| Covariance | −5.168 | −0.007 | 1.849 | 0.050 | −2.129 | −0.252 | 2.205 | −0.402 | 2.172 | 1.868 | −1.213 | 2.160 | 16.207 | −0.597 | 4.657 |
| n | 40 | 40 | 40 | 39 | 40 | 40 | 40 | 40 | 37 | 40 | 40 | 40 | 40 | 39 | 40 |
| Glucose | |||||||||||||||
| Pearson coefficient | 0.050 | −0.078 | 0.230 | 0.133 | 0.183 | 0.184 | 0.027 | 0.089 | 0.210 ** | −0.139 | 1 | 0.445 *** | 0.068 | 0.194 | 0.121 |
| Significance (two tail) | 0.637 | 0.632 | 0.153 | 0.418 | 0.080 | 0.256 | 0.868 | 0.396 | 0.047 | 0.391 | 0.000 | 0.519 | 0.067 | 0.457 | |
| Sum of square | 353.358 | −3.446 | 209.888 | 3.944 | 3551.608 | 339.385 | 145.429 | 209.940 | 2000.389 | −47.288 | 4557.118 | 2818.065 | 2978.642 | 286.648 | 386.082 |
| Covariance | 3.841 | −0.088 | 5.382 | 0.104 | 38.604 | 8.702 | 3.729 | 2.282 | 22.476 | −1.213 | 49.534 | 30.631 | 32.377 | 3.221 | 9.900 |
| n | 93 | 40 | 40 | 39 | 93 | 40 | 40 | 93 | 90 | 40 | 93 | 93 | 93 | 90 | 40 |
| HbA1c | |||||||||||||||
| Pearson coefficient | −0.040 | 0.041 | 0.118 | 0.239 | 0.133 | 0.071 | −0.224 | −0.146 | −0.033 | 0.181 | 0.445 *** | 1 | 0.076 | 0.119 | −0.019 |
| Significance (two tail) | 0.707 | 0.801 | 0.468 | 0.143 | 0.203 | 0.664 | 0.164 | 0.163 | 0.754 | 0.265 | 0.000 | 0.471 | 0.266 | 0.907 | |
| Sum of square | −391.634 | 2.492 | 147.518 | 9.819 | 3596.090 | 179.371 | −1648.293 | −477.044 | −442.690 | 84.225 | 2818.065 | 8794.933 | 4615.574 | 238.352 | −83.798 |
| Covariance | −4.257 | 0.064 | 3.783 | 0.258 | 39.088 | 4.599 | −42.264 | −5.185 | −4.974 | 2.160 | 30.631 | 95.597 | 50.169 | 2.678 | −2.149 |
| n | 93 | 40 | 40 | 39 | 93 | 40 | 40 | 93 | 90 | 40 | 93 | 93 | 93 | 90 | 40 |
| IGF1 | |||||||||||||||
| Pearson coefficient | 0.022 | −0.022 | −0.210 | 0.018 | 0.169 | 0.164 | −0.048 | −0.046 | 0.010 | 0.203 | 0.068 | 0.076 | 1 | 0.015 | −0.001 |
| Significance (two tail) | 0.833 | 0.893 | 0.194 | 0.915 | 0.106 | 0.311 | 0.770 | 0.665 | 0.922 | 0.209 | 0.519 | 0.471 | 0.885 | 0.997 | |
| Sum of square | 1522.510 | −8.888 | −1750.614 | 4.825 | 31,632.259 | 2775.361 | −2344.634 | −1034.772 | 960.588 | 632.069 | 2978.642 | 4615.574 | 423,959.630 | 222.087 | −17.970 |
| Covariance | 16.549 | −0.228 | −44.888 | 0.127 | 343.829 | 71.163 | −60.119 | −11.248 | 10.793 | 16.207 | 32.377 | 50.169 | 4608.257 | 2.495 | −0.461 |
| n | 93 | 40 | 40 | 39 | 93 | 40 | 40 | 93 | 90 | 40 | 93 | 93 | 93 | 90 | 40 |
| Insulin | |||||||||||||||
| Pearson coefficient | 0.140 | 0.048 | 0.153 | 0.166 | 0.125 | 0.247 | −0.238 | 0.122 | 0.136 | −0.171 | 0.194 | 0.119 | 0.015 | 1 | −0.156 |
| Significance (two tail) | 0.187 | 0.772 | 0.352 | 0.318 | 0.241 | 0.130 | 0.145 | 0.252 | 0.210 | 0.298 | 0.067 | 0.266 | 0.885 | 0.344 | |
| Sum of square | 325.886 | 0.818 | 54.235 | 1.884 | 788.628 | 175.552 | −494.963 | 92.957 | 421.727 | −22.672 | 286.648 | 238.352 | 222.087 | 492.369 | −193.254 |
| Covariance | 3.662 | 0.022 | 1.427 | 0.051 | 8.861 | 4.620 | −13.025 | 1.044 | 4.904 | −0.597 | 3.221 | 2.678 | 2.495 | 5.532 | −5.086 |
| n | 90 | 39 | 39 | 38 | 90 | 39 | 39 | 90 | 87 | 39 | 90 | 90 | 90 | 90 | 39 |
| LH | |||||||||||||||
| Pearson coefficient | −0.357 ** | −0.138 | 0.126 | 0.028 | 0.162 | −0.179 | 0.618 *** | 0.089 | 0.462 *** | 0.265 | 0.121 | −0.019 | −0.001 | −0.156 | 1 |
| Significance (two tail) | 0.024 | 0.397 | 0.437 | 0.864 | 0.318 | 0.269 | 0.000 | 0.583 | 0.004 | 0.098 | 0.457 | 0.907 | 0.997 | 0.344 | |
| Sum of square | −1847.679 | −12.254 | 232.321 | 1.705 | 2578.632 | −665.779 | 6675.971 | 153.336 | 3834.771 | 181.619 | 386.082 | −83.798 | −17.970 | −193.254 | 6440.390 |
| Covariance | −47.376 | −0.314 | 5.957 | 0.045 | 66.119 | −17.071 | 171.179 | 3.932 | 106.521 | 4.657 | 9.900 | −2.149 | −0.461 | −5.086 | 165.138 |
| n | 40 | 40 | 40 | 39 | 40 | 40 | 40 | 40 | 37 | 40 | 40 | 40 | 40 | 39 | 40 |
Values are significantly different as indicated (** P<.05, *** P<.01) by analysis of covariance (SPSS v. 18).