
Abstract
We have previously reported that dietary gromwell (Lithospermum erythrorhizon; LE) prevents the development of atopic dermatitis (AD) with increased epidermal levels of total ceramide (Cer), the major lipid maintaining epidermal barrier. In this study, we investigated whether the increased level of total Cer induced by dietary LE would be related to the altered metabolism of glucosylceramide (GlcCer) and sphingomyelin (SM), two major precursor lipids in Cer generation. NC/Nga mice, an animal model of AD, were fed a control diet (group CA: atopic control) or a diet with 70% ethanol LE extracts (1% in diet; group LE) for 10 weeks. Individual species of Cer, GlcCer, and SM were analyzed by high-performance thin layer chromatography. In the epidermis of group CA, total Cer (including Cer2 and Cer5–7) and total GlcCer (including GlcCer-B/C/D) were significantly reduced; these levels in group LE were increased to levels similar to the normal control group of BALB/c mice (group C). In addition, protein expressions and activities of β-glucocerebrosidase (β-GlcCer'ase) and acidic sphingomyelinase (aSMase), enzymes for GlcCer or SM hydrolysis, respectively, were increased in group LE. However, alterations of Cer1, Cer3/4, GlcCer-A, and all SM species (including SM1–3) were not significant among groups C, CA, and LE. Dietary gromwell increases GlcCer-B/C/D, and further enhances the generation of Cer2 and Cer5–7 with high protein expressions and activities of β-GlcCer'ase and aSMase.
Introduction
G
Regarding the systemic efficacy of LE, it has been reported that dietary supplementation of organic or water extracts of LE inhibits epidermal hyperproliferation with a marked increase of ceramide (Cer), the major lipid maintaining the multilamellae structure of the epidermal barrier. 8 Furthermore, we have also previously reported that dietary supplementation of 70% ethanol extracts of LE prevents the development of atopic dermatitis (AD) in parallel with increased Cer levels, which is inversely associated with the decreased protein expression of ceramidase (CDase), a Cer degradative enzyme, but serine palmitoyl transferase (SPT), the rate-limiting enzyme in de novo Cer synthesis, is not altered in NC/Nga mice, an animal model of AD. 9 Cer in the epidermal barrier is generated mainly from glucosylceramide (GlcCer) hydrolysis by β-glucocerebrosidase (β-GlcCer'ase) or, in part, from sphingomyelin (SM) hydrolysis by sphingomyelinase (SMase). 10 –12 To investigate the systemic modulation of LE on Cer metabolism in depth, and to determine the contributions of GlcCer and SM hydrolysis for the marked increase of Cer in the epidermis of NC/Nga mice, epidermal levels of individual species of Cer, GlcCer, and SM as well as activities and protein expressions of β-GlcCer'ase and SMase were evaluated in the epidermis of NC/Nga mice fed 70% ethanol extracts of LE.
Materials and Methods
Materials
Lipid standards (Cer1/2/3–4/5/6–7; GlcCer-A/B/C/D; SM1/2/3) were purchased from Avanti Polar Lipids, Inc (Alabaster, AL, USA). 4-Methylumbelliferone (4-MU), 4-methylumbelliferyl-β-D-glucopyranoside (4-MUG), and sodium taurodeoxycholate were obtained from Sigma Chemical Co. (St. Louis, MO, USA). N-methyl-[14C] sphingomyelin (0.2 μCi/mL, specific activity 40–60 mCi/mmol), labeled at the choline, was purchased from PerkinElmer (Waltham, MA, USA). An antibody against β-GlcCer'ase (G4171) was purchased from Sigma Chemical Co., and an antibody against acidic sphingomyelinase (aSMase; SC-9817) was purchased from Santa Cruz (Santa Cruz, CA, USA). An antibody against keratin 5 (loading control; ab53121) was purchased from Abcam (Cambridge, MA, USA). High-performance thin layer chromatography (HPTLC) plates (silica gel 60) were obtained from Merck (Darmstadt, Germany). All other chemicals and solvents used were of the highest analytical grade.
Preparation of LE extract
Dried LE root was purchased from Fushun, Liaoning province in China (September 2010). LE (100 g) was cut into small pieces and extracted with 500 mL 70% ethanol at 85–90°C for 12 h with stirring. The extraction procedure was repeated twice. The combined extract was filtered through a Whatman no. 2 paper, and lyophilized to yield 34.92 g of LE extract. The powdered 70% ethanol extracts of LE contained 2.6% moisture, 7.3% crude protein, 1.4% crude fat, 0.9% sodium, and 87.6% carbohydrate as well as 0.2% lithospermic acid (2.0 mg/g), as standardized for the major bioactive component. 9 Nutritional and bioactive component concentrations were determined by the Amorepacific Corporation R&D Center (Gyeonggi-do, Korea).
Mice and diet
Five-week-old male BALB/c mice (n=10) and 5-week-old NC/Nga mice (n=20) were purchased from SLC Japan (Shizuoka, Japan). The NC/Nga mice were assigned into two groups of 10 mice each: an atopic control (group CA) fed a control diet, and group LE fed a diet supplemented with 1.0% powdered extracts of LE for 10 weeks. A normal control group (group C), which consisted of BALB/c mice, was fed the control diet for 10 weeks. The compositions of experimental diets are shown in Table 1.
Group C, Balb/c mice; Group CA, NC/Nga mice fed a control diet; Group LE, NC/Nga mice fed a diet containing 70% ethanol extracts of Lithospermum erythrorhizon (LE).
During the entire 10-week feeding period, all the NC/Nga mice in groups CA and LE were maintained under conventional laboratory conditions without air filtration to induce AD spontaneously as previously described. 9 AD induction was noticed as scratching, eczema, alopecia, and hemorrhage were developed on the face, neck, ears, and dorsal skin of group CA, with onset at 4 weeks and severed by 10 weeks. AD induction in group CA was further verified by the elevation of serum IgE at 10 weeks, but AD induction was not apparent in group LE, as previously described. 9 All mice were housed under conditions of controlled temperature (22–24°C), humidity (55–60%), and light (lights on from 7:00 a.m. to 7:00 p.m.). Food intake and body weight of all groups were monitored weekly over the 10-week feeding period and no significant differences between groups were observed as previously described. 9 Animal care and handling conformed to the accepted NIH guidelines (NIH publication No. 80-23, 1978), and all aspects of the protocol were approved by the Animal Care and Use Review Committee of Kyung Hee University. At the end of the 10th week, mice were sacrificed by cervical dislocation, and epidermis was isolated after a 4-h incubation of dorsal skin strips in phosphate-buffered saline (PBS) (pH 7.4) containing 10 mM EDTA at 37°C. 13
Analysis of Cer, GlcCer, and SM
Epidermal strips were homogenized and a portion of epidermal homogenates was used to measure the protein concentration as previously described. 9 The remaining epidermal homogenates were extracted with chloroform (CHCl3):methanol (MeOH; 2:1, v/v) to obtain total lipids, and fractionations of Cer, GlcCer, and SM were achieved by HPTLC as previously described. 14 Specifically, each sample was applied to the plate with a Linomat 5 autosampler (CAMAG, Muttenz, Switzerland) and each fractionation step was carried out by an automatic multiple development apparatus (CAMAG) after the plates were completely air-dried. The fractions containing Cer, GlcCer, and SM that had comigrated with the respective external standards were scanned by a TCL III scanner (DigiStore2; CAMAG) after treatment with cupric acetate-phosphoric acid, and heating to 160°C for 15 min as previously described. 14 The levels of Cer, GlcCer, and SM were quantified in each sample using calibration curves with the various concentrations of each respective external standard, and expressed as μg/μg protein. Calibration curves of each standard in the range of 5–50 μg/mL revealed good linearity with R2 values exceeding 0.996 (density vs. concentration). The limit of detection was 30 ng for Cer and GlcCer, and 50 ng for SM.
In vitro assay of β-GlcCer'ase activity
The in vitro assay of β-GlcCer'ase activity used in this study was modified from those previously described by Takagi et al. 15 and Holleran et al. 16 Epidermal strips were homogenized in ten volumes by weight of PBS containing 0.1 mM phenylmethylsulfonyl fluoride on ice and centrifuged at 420 g for 10 min at 0°C. After measuring the protein concentration, 14 50 μL of supernatant in an assay buffer (0.1 M citric acid, 0.2 M sodium phosphate, and 0.5 mM sodium taurodeoxycholate at pH 5.6) was preheated at 37°C for 60 min and the reaction was initiated by adding 50 μL of the substrate solution (0.5 mM 4-MUG in assay buffer). After 1 h, the reaction was stopped by adding 1.25 mL of 200 mM carbonate–bicarbonate buffer (pH 10.5). The enzyme activity was determined as fluorescence of 4-MU, the hydrolysate from the β-GlcCer'ase assay was measured by a fluorescence spectrophotometer at excitation=360 nm and emission=450 nm (I-4500; Hitachi Ltd., Tokyo, Japan). A standard 4-MU solution (0–300 nM) in 200 mM carbonate–bicarbonate buffer was used for calibration of each assay. The results were expressed as nmole/μg protein.
In vitro assay of aSMase activity
After epidermis was homogenized in ten volumes by weight of water containing 0.2% TritonX-100 and centrifuged at 420 g for 10 min at 0°C as described previously, 13 the resulting supernatant (20 μg protein) was incubated for 2 h at 37°C in a reaction buffer (250 mM sodium acetate and 1 mM EDTA at pH 5.0) containing 2.25 μL N-methyl-[14C] sphingomyelin (0.2 μCi/mL, specific activity 40–60 mCi/mmol) as the substrate (final volume 400 μL). The reaction was stopped by adding 800 μL CHCl3: MeOH (2:1, v/v) and 200 μL H2O. After a brief centrifugation at 300 g, the supernatant fraction containing [14C] phosphorylcholine, the hydrolysate of aSMase assay, was extracted, and the radioactivity was determined by liquid scintillation counting. The results were expressed as cpm/μg protein.
Western blotting analysis of β-GlcCer'ase and aSMase proteins
The epidermal protein extract (35 μg/each) was separated electrophoretically on 10% SDS-polyacrylamide gels (SDS-PAGE) and then blotted to a nitrocellulose membrane. 9 The membranes were incubated with primary antibodies against β-GlcCer'ase (60 kDa), aSMase (55–90 kDa), or keratin 5 (62 kDa), followed by incubation with IgG-HRP secondary antibodies. Immunoreactive proteins were visualized with an enhanced ECL detection system (GE Healthcare, Buckinghamshire, United Kingdom), and the band density was quantified by densitometry.
Statistical analysis
Data are expressed as mean±SEM (n=10). All data were analyzed by one-way ANOVA using SPSS for Windows (SPSS 18.0; SPSS, Inc., Chicago, IL, USA), and the differences among the groups (C, CA, and LE) were determined by the Duncan's multiple comparison test. Differences with P<.05 were considered significant.
Results and Discussion
Epidermal levels of Cer species
Compared to the normal control group C, the HPTLC analysis of epidermal lipids of group CA demonstrated a marked decrease in total Cer (Fig. 1A), as extensively reported previously. 9,17,18 The total Cer in group LE was higher than that in group CA, and was similar to that in group C, which is consistent with our previous reports. 9 Cer bearing structural moieties of amide-linked non-hydroxy acid, α-hydroxy acid, or ω-hydroxy acid as well as ester-linked fatty acid (FA) on sphingoid bases are critical to maintaining the lamellar integrity of the epidermal barrier, and the distinct composition of these structural moieties in each Cer comprises a heterogeneous family of seven species (Cer1–7) in the epidermis. 10 Further analysis of individual Cer species revealed that Cer1, the most hydrophobic Cer species with amide-linked ω-hydroxy acid and ester-linked FA on sphingosine, 19 and the more hydrophilic Cer species such as Cer2–7 (Cer7: the most hydrophilic Cer) were separated, as reported in the epidermis previously. 10,11 In group CA, Cer2, a major Cer species accounted for >50% of epidermal Cer, 10 and Cer5 and Cer6/7 were significantly less than in group C. After dietary supplementation of LE, the levels of Cer2, Cer5, and Cer6/7 were significantly higher than in group CA. Furthermore, these levels increased to values similar to group C, reflecting the increased level of total Cer. The epidermal level of Cer1 and Cer3/4 did not differ among groups C, CA, and LE.
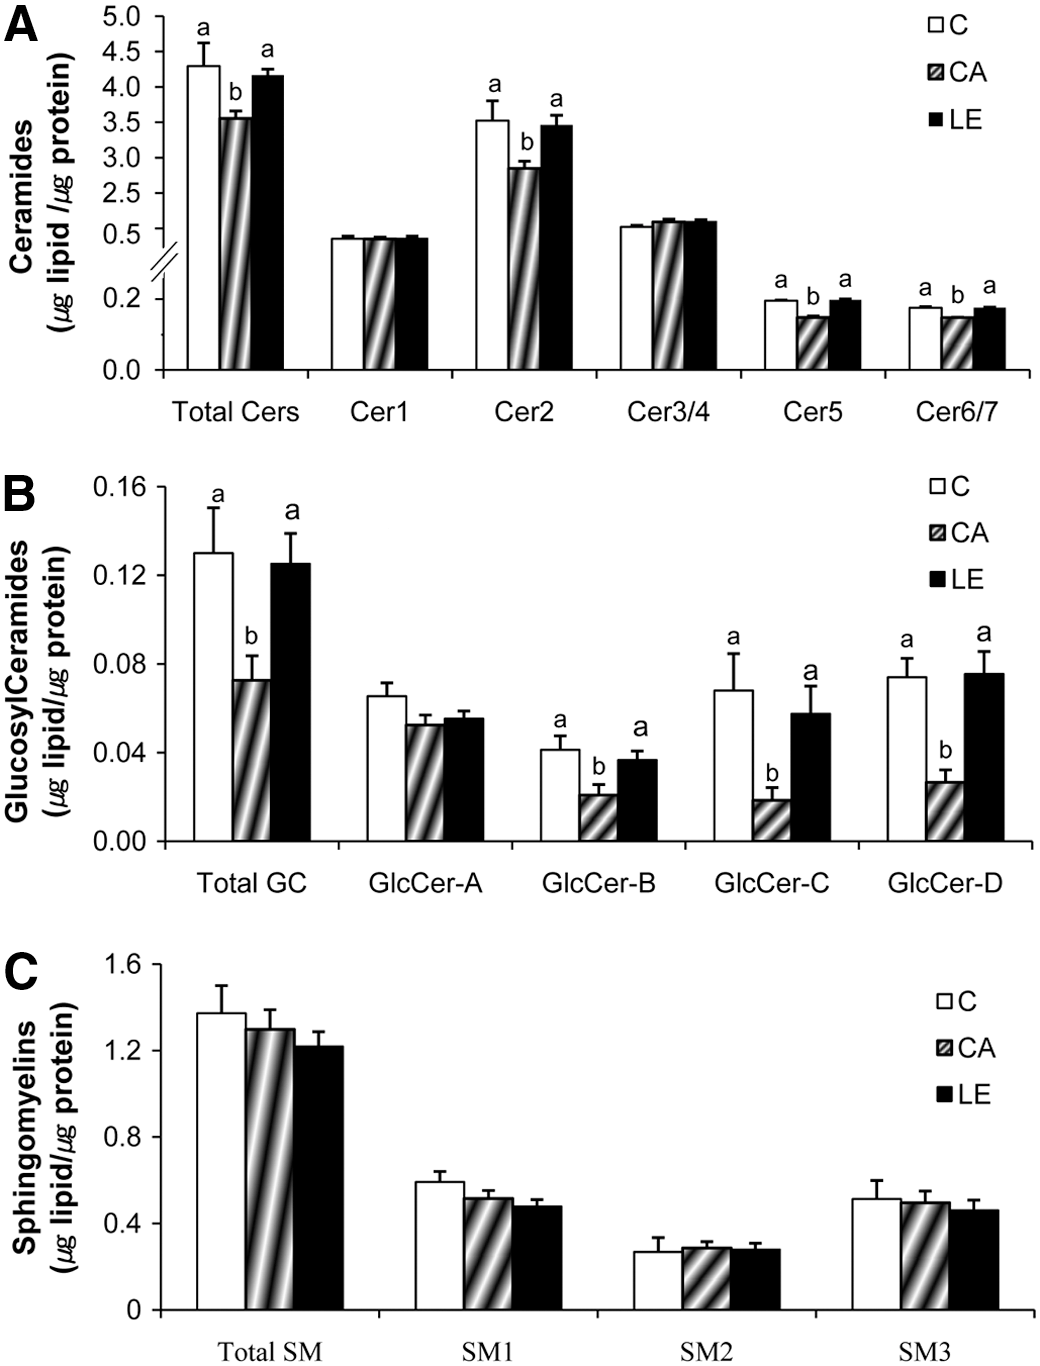
Epidermal levels of ceramide (Cer), glucosylceramide (GlcCer), and sphingomyelin (SM) in Balb/c mice fed a control diet (group C) and NC/Nga mice fed either a control diet (group CA) or Lithospermum erythrorhizon (LE) diet (group LE) for 10 weeks. Total lipids were fractionated into total Cer, total GlcCer, and total SM, of which individual species were further separated into
Epidermal levels of GlcCer and SM species
Since Cer species in the lamellar structure of the epidermal barrier is mostly generated from GlcCer and SM, 10 –12 altered levels of GlcCer and SM are likely related to Cer metabolism. Total GlcCer in group CA was significantly less than in group C (Fig. 1B). In contrast, the epidermal level of total GlcCer in group LE was higher than that in group CA, and was similar to that in group C, which resembles the alteration of total Cer as well as of Cer2, Cer5, and Cer6/7. GlcCer is able to be separated into four major subfractions by HPTLC; GlcCer-A (acylGlcCer, the most hydrophobic component), GlcCer-B, GlcCer-C, and GlcCer-D (the most hydrophilic components). 11 Further analysis of individual GlcCer species revealed that GlcCer-B, GlcCer-C, and GlcCer-D, but not GlcCer-A, in group LE were increased to similar levels of group C. However, the analysis of SM species revealed that total SM, including three major subfractions with distinctive amide-linked (N-acyl) FA compositions: individual species contained either long-chain FA (SM1; C22–26), shorter chain FA (SM2; primarily C16), or short-chain α-hydroxy FA (SM3; C16–18), 12 did not significantly differ among groups C, CA, and LE (Fig. 1C), suggesting that the SM is not altered by AD induction or dietary supplementation of LE extracts.
Activities and protein expressions of β-GlcCer'ase and aSMase in the epidermis
Cer1–7 is primarily generated from GlcCer hydrolysis by β-GlcCer'ase. 10 –12 Specifically, Cer1and Cer4 are generated from GlcCer-A. 10 –12 Cer2 and the more hydrophilic Cer species such as Cer3, Cer5, and Cer6/7 are generated from GlcCer-B/C/D. 11 Additionally, Cer2 and Cer5 are generated from other precursors, SM1 and SM3, respectively by SMases, although SM2 is not believed to affect the Cer generation. 12 β-GlcCer'ase deficiency has been suggested to be a critical factor in the accumulation of GlcCer, which could result in depletion of epidermal Cer, thereby leading to barrier defects. 20 SMases are also important in maintaining the barrier function, and of various SMases, deficiency of aSMase has been reported to lead to epidermal barrier defects. 21,22
To further determine the contributions of GlcCer and SM hydrolysis in altering levels of Cer species, the activity of β-GlcCer'ase and aSMase was evaluated (Fig. 2). Activities of β-GlcCer'ase and aSMase in the epidermis of group CA were significantly less than those of group C. In contrast, activities of β-GlcCer'ase and aSMase in group LE were similar to those in group C, in parallel with the increased levels of Cer2, Cer5, and Cer6/7. Consistent with the activities (Fig. 2), protein expressions of β-GlcCer'ase and aSMase in group CA were less than those in group C (Fig. 3), suggesting that the decreased activities of β-GlcCer'ase and aSMase may result from the decreased protein expression of these two enzymes. Similarly, the increased activities of β-GlcCer'ase and aSMase with LE supplementation resulted from changes in protein expressions. The protein expressions of β-GlcCer'ase and aSMase in group LE were significantly higher than those in group CA and similar to those of group C.
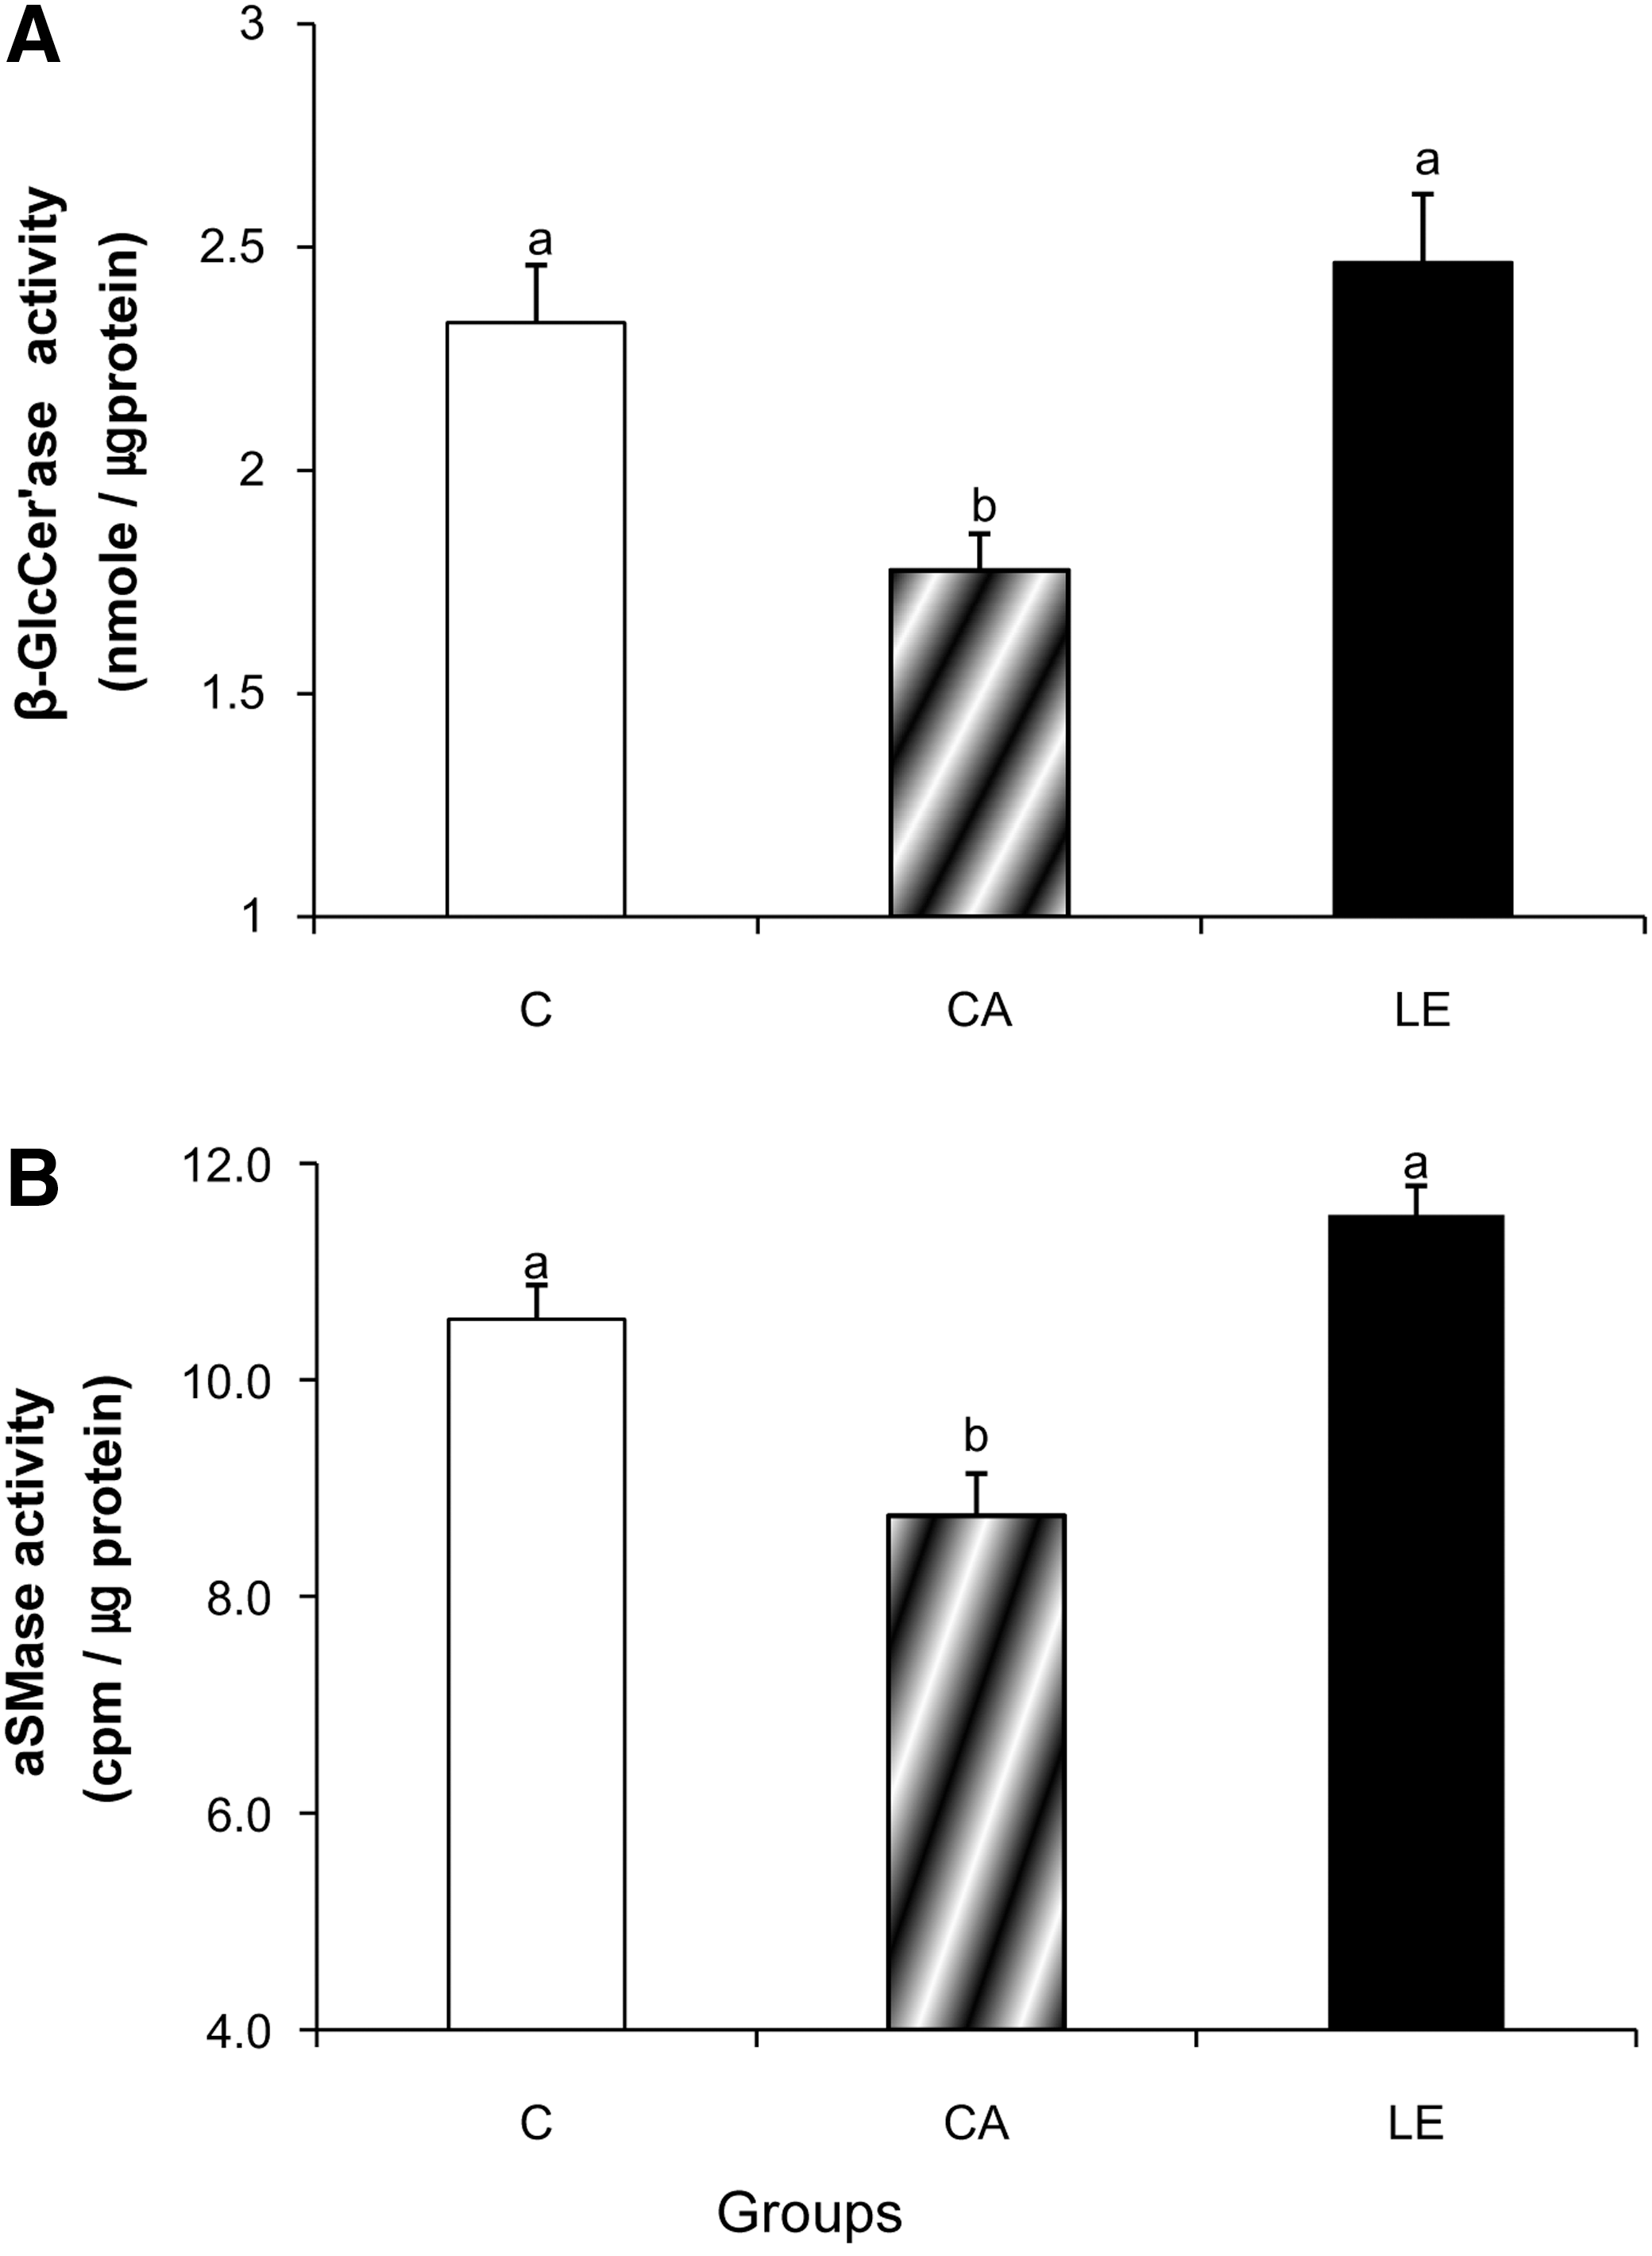
Activities of β-glucocerebrosidase (β-GlcCer'ase) and acidic sphingomyelinase (aSMase) in the epidermis of Balb/c mice fed a control diet (group C) and NC/Nga mice fed either a control diet (group CA) or LE diet (group GW) for 10 weeks.
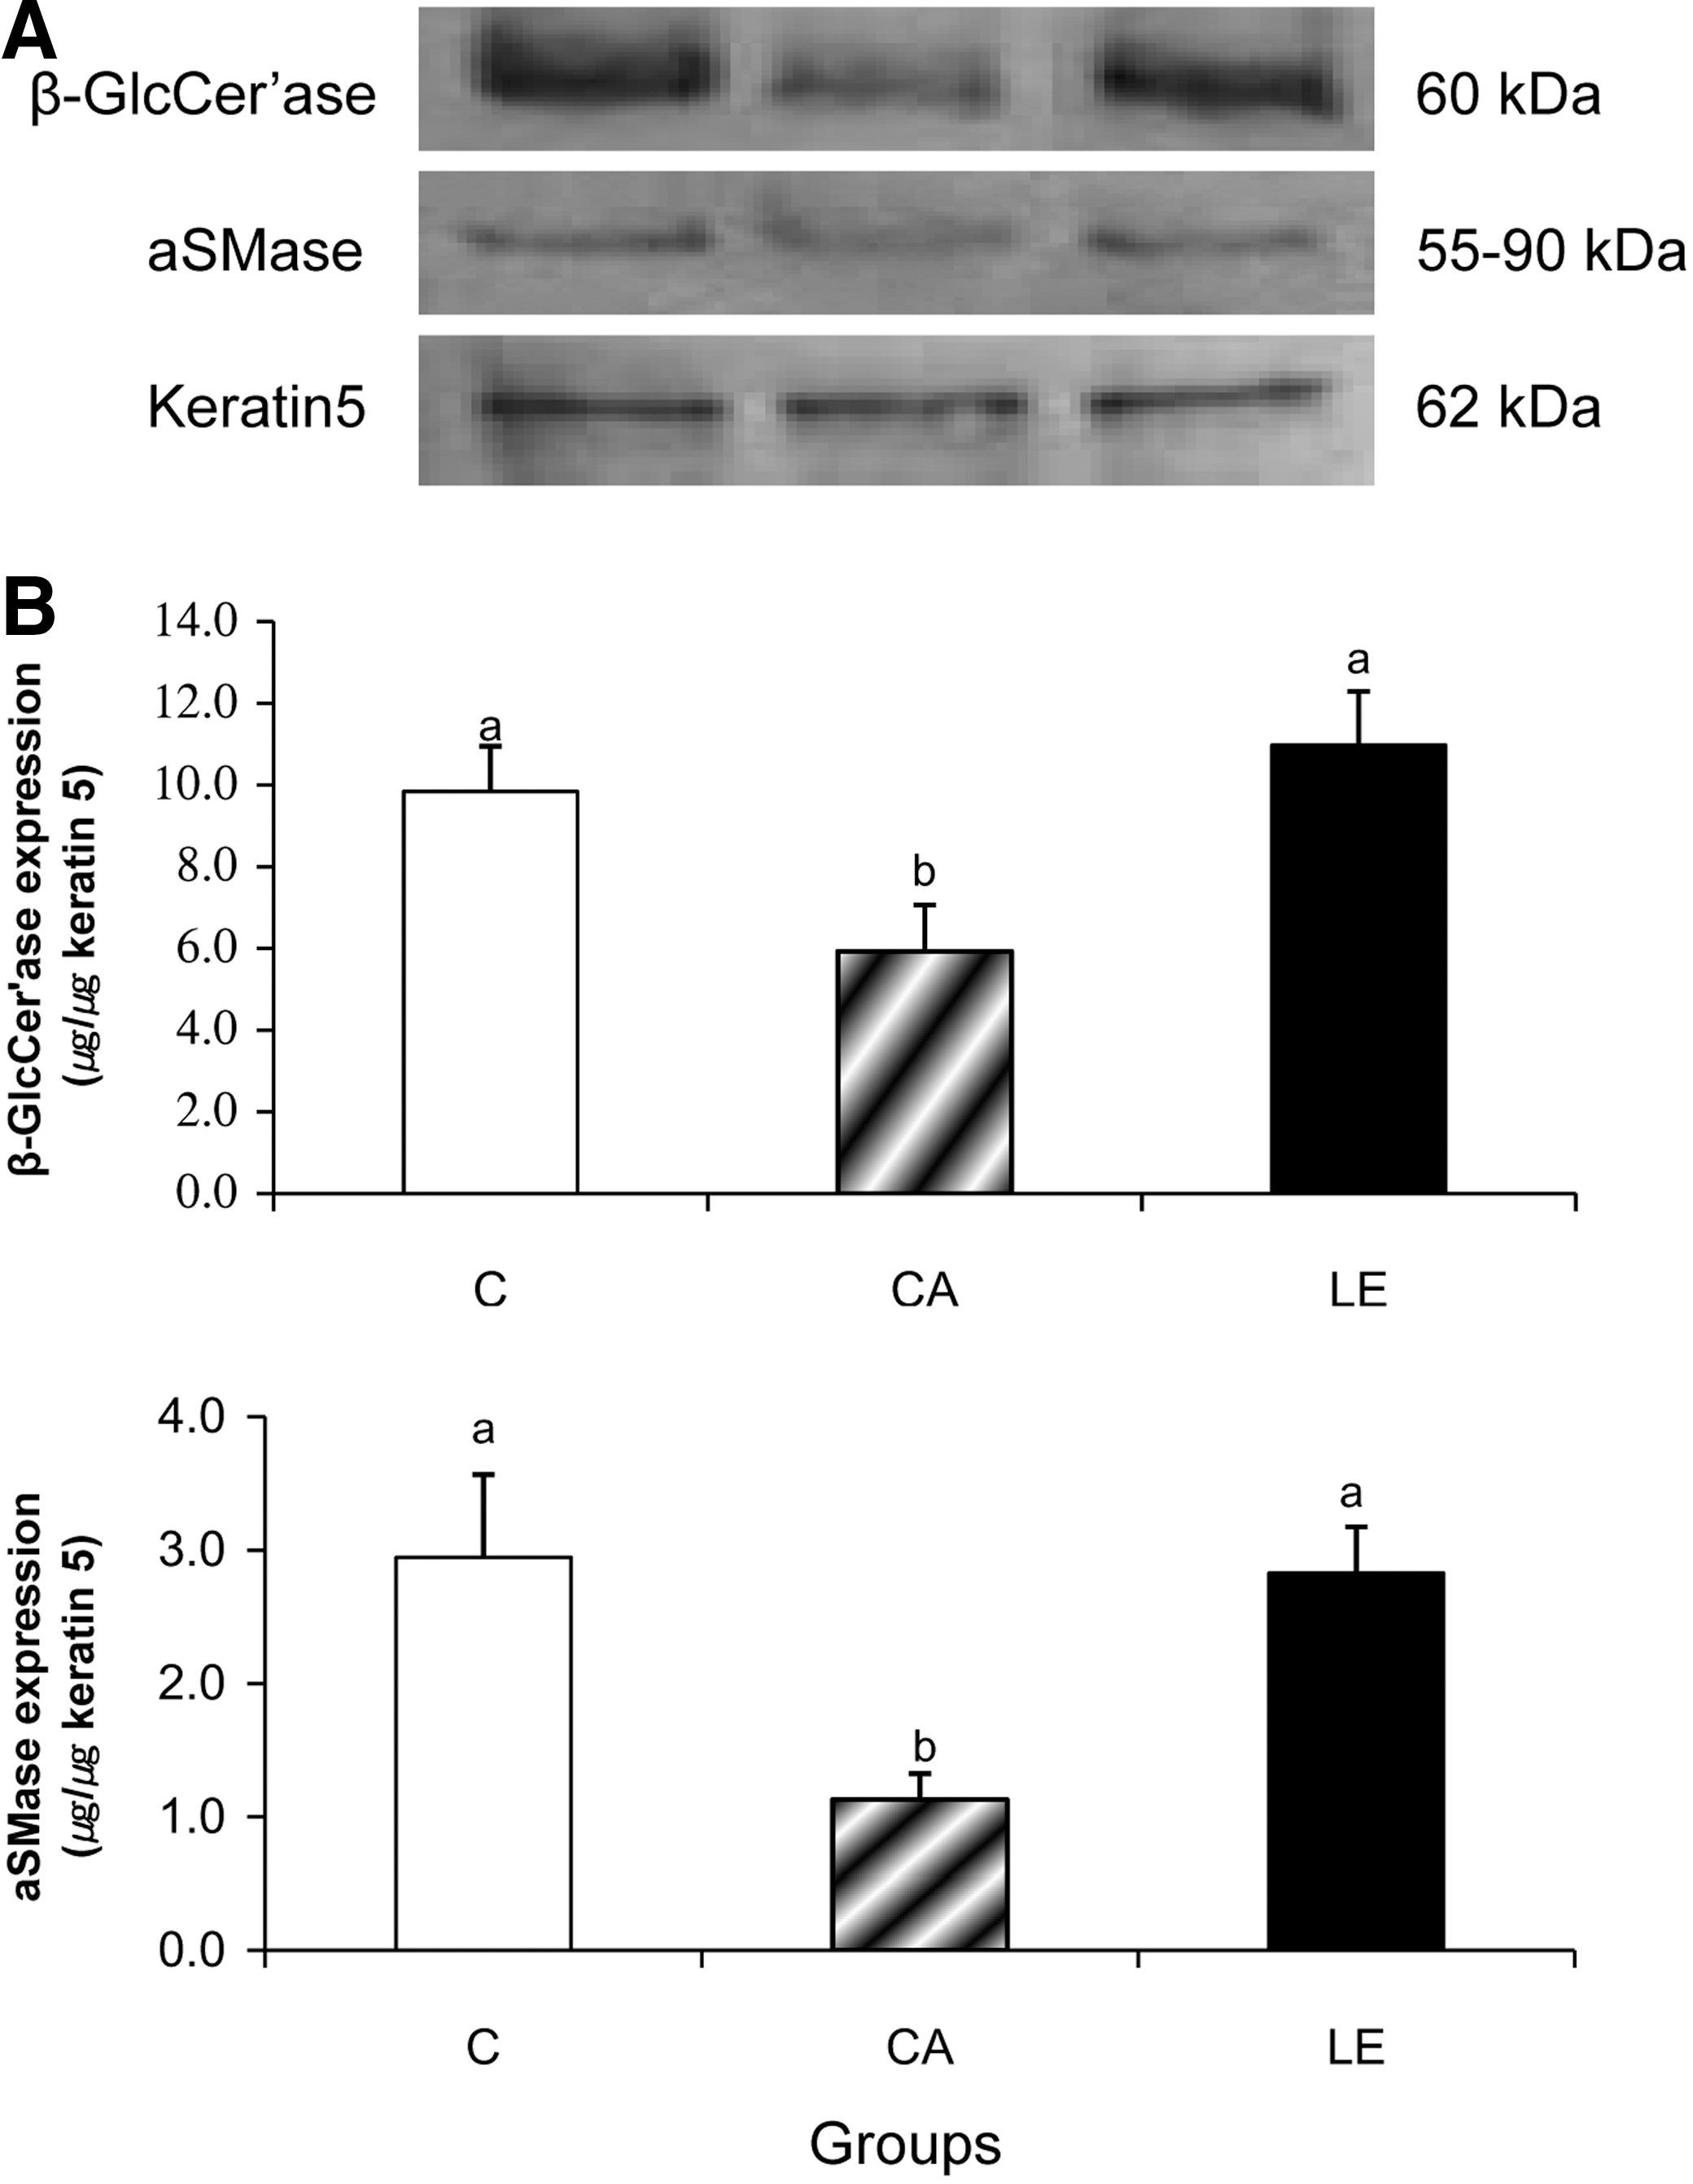
Protein expressions of β-glucocerebrosidase (β-GlcCer'ase) and aSMase in the epidermis of BALB/c mice fed a control diet (group C) and NC/Nga mice fed either a control diet (group CA) or LE diet (group LE) for 10 weeks.
A balance between the activity and expression of Cer metabolizing enzymes regulates Cer levels in the epidermis. In AD, the decreased levels of Cer, GlcCer, or SM parallel the reductions in de novo Cer synthesis, the SMase activity, and/or the ceramidase activity. 18,23,24 Moreover, a deficiency of GlcCer synthase or SM synthase, enzymes involved in GlcCer or SM synthesis, respectively, results in significant reductions of GlcCer and/or SM, ultimately decreasing Cer levels. 10,25 Alternatively, unusual expression of SM deacylase, which metabolizes SM to sphingosyl phosphorylcholine, could also underlie the decreased levels of Cer in the epidermal lesions of AD patients. 26 However, the expression of SM deacylase has not been detected in NC/Nga mice, an animal model of AD. 17 In NC/Nga mice, while neither AD induction nor dietary LE supplementation alters the mRNA and protein expressions of SPT in de novo Cer synthesis, the protein expression of ceramidase is increased with AD induction, as reported in our previous studies. 9 Furthermore, the epidermal levels of GlcCer, specifically polar GlcCer-B/C/D, as well as protein expressions and activities of both β-GlcCer'ase and aSMase were decreased in group CA. Taken together, these data demonstrate that in addition to reducing the levels of polar GlcCer, AD induction in NC/Nga mice also reduces epidermal levels of total Cer (including Cer2, Cer5, and Cer6/7) by decreasing the generation and/or by enhancing the degradation of Cer.
The protein expression of ceramidase in group LE was significantly less than in group CA. 9 Moreover, epidermal levels of GlcCer-B/C/D levels as well as of activities and protein expression of β-GlcCer'ase and aSMase in group LE were significantly higher than in group CA and comparable to those of group C, indicating that dietary supplementation of 70% ethanol extracts of LE enhances polar GlcCer, and also increases protein expression and activities of β-GlcCer'ase and aSMase, ultimately resulting in the enhanced generation of Cer2, a major Cer of epidermis, as well as of other more polar α-hydroxyacyl Cer species, including Cer5 and cer6/7, which is further maintained with a low protein expression of CDase.
In preliminary dose–response experiments with the 70% ethanol extracts of LE, no dietary effect was evident at the level of 0.5%, whereas 1% and 2% improved the clinical manifestation of AD in parallel with increased Cer levels in NC/Nga mice, and therefore 1% was used in the present study. As employed the average of daily food intake and body weight of group LE in the 10-week feeding period (i.e., 0.93 g/30 g), the human equivalent dose (HED) of 1% LE extracts is interpreted to 1.5 g/60 kg (body weight) based on the body surface area normalization method. 27 This interpretation of HED, along with our previous human report, 28 in which AD patients received 1.5 g of the 70% ethanol extracts of LE for 10 weeks with no significant abnormalities in anthropometric and blood analyses, and in which hepatotoxicity parameters of serum bilirubin, alanine aminotransferase, and aspartate aminotransferase 29 were associated with the clinical improvement of AD, indicates that 1% LE in diet was an adequate dose with long-term safety for skin efficacy in this animal study.
Identified bioactive compounds included napthaquinones such as shikonin and its derivatives, which were extensively characterized mostly in the organic extracts of LE. 3,4 However, in the 70% ethanol extracts of LE, which were used in this study, lithospermic acid, a caffeic acid oligomer has been identified as a standardized major bioactive component at a concentration of 2 mg/g, as previously reported. 9 On the other hand, polysaccharides such as lithosperman A, B, and C have also been identified, 5 but little is known about the effects of lithospermic acid or lithospermans on altering epidermal levels of Cer, GlcCer, and SM species or of protein expression and activities of Cer metabolizing enzymes. Among the increased Cer and GlcCer levels in the epidermis of group LE, which were fed 1% LE extracts in diet, Cer or GlcCer could be expected to be significant components of LE extracts. In fact, dietary GlcCer and SM improve clinical symptoms and epidermal barrier function of AD, 30,31 implying the direct reutilization of dietary GlcCer and SM for Cer generation in epidermis. However, with extremely low absorption of dietary GlcCer in the intestine, 32 the beneficial effects of dietary GlcCer and SM in AD skin is explained rather by the selective upregulation of Cer synthase 3 and 4 mRNAs. 30 On the other hand, ingested LE extracts decrease the serum levels of insulin and leptin, which indirectly mediate a decreased expression of lipogenic genes in the liver. 33 The methanol extracts of LE, in which lithospermic acid and two derivative esters are isolated as main components, have been found to increase mRNA and protein expressions of SPT in human keratinocyte HaCaT cells. 34 Furthermore, in our previous 9 and present studies, dietary LE extracts altered the protein expressions and/or activities of β-GlcCer'ase, aSMase, and CDase. Together, these data with no report of Cer, GlcCer, or SM as nutritional and bioactive components of LE extracts, suggest that ingested LE extracts could indirectly promote systemic responses, which in turn may then affect the expression and/or activities of target enzymes in the epidermal Cer metabolism. The systemic responses of LE extracts could be due to complex mechanisms; these remain to be elucidated in future studies.
In summary, this in vivo study demonstrated that dietary supplementation of 70% ethanol extracts of LE increase epidermal levels of Cer2, 5–7 and GlcCer-B/C/D species as well as the protein expressions and activities of β-GlcCer'ase and aSMase. The 70% ethanol extracts of LE could be an effective dietary supplement for improving skin barrier function in AD.
Footnotes
Acknowledgment
This study was funded by Nutrex Technology Co., Seongnam, Korea.
Author Disclosure Statement
The authors declare that there are no conflicts of interest.