




Abstract
Maintaining “gut health” is a goal for scientists throughout the world. Therefore, microbiota management models for testing probiotics, prebiotics, and synbiotics have been developed. The SHIME® model was used to study the effect of fructooligosaccharide (FOS) on the fermentation pattern of the colon microbiota. Initially, an inoculum prepared from human feces was introduced into the reactor vessels and stabilized over 2 weeks using a culture medium. This stabilization period was followed by a 2-week control period during which the microbiota was monitored. The microbiota was then subjected to a 4-week treatment period by adding 5 g/day-1 FOS to vessel one (the “stomach” compartment). Plate counts, Denaturing Gradient Gel Electrophoresis (DGGE), short-chain fatty acid (SCFA), and ammonium analyses were used to observe the influence of FOS treatment in simulated colon compartments. A significant increase (P<.01) in the Lactobacillus spp. and Bifidobacterium spp. populations was observed during the treatment period. The DGGE obtained showed the overall microbial community was changed in the ascending colon compartment of the SHIME reactor. FOS induced increase of the SCFA concentration (P<.05) during the treatment period, mainly due to significant increased levels of acetic and butyric acids. However, ammonium concentrations increased during the same period (P<.01). This study indicates the usefulness of in vitro methods that simulate the colon region as part of research towards the improvement of human health.
Introduction
T
A prebiotic was first defined as a nondigestible food ingredient that beneficially affects the host by selectively stimulating the growth and/or activity of one or a limited number of bacteria in the colon, and thus improves host health. 1,2
Fructan is a general name used for any carbohydrate in which one or more fructosyl fructose links constitutes the majority of glycosidic bonds. They are synthesized in plants from sucrose by repeated fructosyl transfer and therefore usually exhibit a terminal glucose unit. 3,4 They are composed of 1-kestose (GF2), nystose (GF3), and 1F-fructofuranosylnystose (GF4) in which fructosyl units (F) are bound at the −2,1 position of sucrose (GF). 5 FOS is bifidogenic and is a well-established prebiotic. 6
Several studies have shown that the majority of Bifidobacterium species are capable of utilizing short-chain FOS and inulin. 1,7,8 The prebiotic effectiveness of inulin-type fructans not only depends on the dietary dosage, but also on the degree of polymerization (DP). Inulin-type fructans have a DP varying between 2 and 70. 9 FOS have a lower molecular weight than inulin (DP >30). 10 As fructans have a longer chain length and higher molecular weight, they are less easily fermented by intestinal microbiota. 11
The SHIME® is a simulator of the human intestinal microbial ecosystem in which environmental conditions (pH, residence time, inoculum, and temperature) are controlled to resemble those of in vivo experiments. 1,12 A SHIME system consists of five double-jacketed vessels, simulating the stomach, the small intestine, and the ascending, transverse, and descending colon, with a total retention time of 72 hours. SHIME is an in vitro system proven to be a very useful model for nutrition studies in terms of analysis of the intestinal microbial community composition. 11,13,14
This study aimed to evaluate the interactions of fructooligosaccharide (FOS) with native microbiota after passing through simulated stomach and small intestine conditions using the SHIME reactor.
Materials and Methods
Long-term SHIME run
The SHIME reactor was developed by Ghent University. The reactor setup and the composition of the liquid feed (Table 1), which entered the system three times per day, were previously described by Possemiers et al. 15
q.s.p., quantity sufficient for L.
The three-colon vessels of the SHIME reactor (Fig. 1) were inoculated with bacteria from a fecal sample of a healthy, 26-year-old adult female with no history of antibiotic treatment 6 months prior to the study. Aliquots (10 g) of freshly fecal samples were diluted and homogenized with 100 mL of sterilized phosphate buffer (0.1 mol/L, pH 7), containing 1 g/L sodium thioglycolate as the reducing agent. After removal of the particulate material by centrifugation, the supernatants were pooled and 50 mL were introduced into each of the colon simulation vessels.

Schematic representation of the Simulator of the Human Intestinal Microbial Ecosystem (SHIME®). Possemiers et al. 27 Vessel 1: stomach; Vessel 2: small intestine; Vessel 3: ascending colon; Vessel 4: transverse colon; Vessel 5: descending colon.
The microbial inoculum was stabilized over a period of 2 weeks on a carbohydrate-based medium and allowed to adapt to the specific environmental conditions of the ascending, transverse, and descending colon, in terms of pH range, retention time, and available carbon sources. 15 An initial stabilization period of 2 weeks after inoculation was applied to allow the intestinal bacteria to adapt to the environmental conditions present in the colon vessels and to form a stable microbial community, representative of that found in the gastrointestinal tract. 13 Upon stabilization, the SHIME run included a 2-week basal period (to quantify all steady-state bacterial parameters which were used as a starting point to evaluate the effect of a specific treatment), and a 4-week treatment period, 5 g FOS (Fagron, Waregem, Belgium) were added once per day to the stomach compartment.
Microbiological analysis
At weekly intervals throughout the entire experimental period, (basal, treatment, and washout), 5 mL samples were collected from the reactors for microbiological examinations. The analysis of the intestinal microbiota composition was based on the enumeration of total aerobic and anaerobic bacteria, Enterococcus ssp., Lactobacillus ssp., Bifidobacterium ssp., Enterobacterium spp., and Clostridium spp. One mL of a sample taken from each reactor was suspended in 99 mL of peptone water. Serial dilutions were prepared and inoculated into selective culture media as follows: Total aerobic and anaerobic counts: Standard Methods agar (Acumedia, Baltimore, Maryland, USA), 37°C/48 hours; Enterococcus spp.: KF Streptococcus agar (Acumedia), 37°C/48 hours; 14 Lactobacillus spp.: MRS agar (Merck, Darmstadt, Germany), 37°C/48 hours; Bifidobacterium spp.: Bifidobacterium formulated medium BIM-25 (Difco, Strasbourg, France), 37°C/72 hours; 20 Enterobacteria: MacConkey agar (Acumedia), 37°C/48 hours; and Clostridium spp.: RCA Agar (Difco), 37°C/48 hours. 16 Anaerobic incubation of plates was performed in jars with a gas atmosphere (84% N2, 8% CO2, and 8% H2) adjusted by the Anaerobac (Probac, São Paulo, Brasil).
Prebiotic index
The prebiotic index (PI) equation assumes that an increase in the populations of bifidobacteria and/or lactobacilli is a positive effect while an increase in bacteroides and clostridia (histolyticum subgroup) are negative. Population changes in these groups are entered into the equation as related to their starting levels. This proportion is then expressed as a proportion of the total bacterial counts in real numbers as opposed to log values. 17
The PI equation, PI=(Bif/Total) – (Bac/Total)+(Lac/Total) – (Clos-Total), is described as such: “Bif” is bifidobacterial numbers at sample time/numbers at inoculation; “Bac” is bacteroides numbers at sample time/numbers at inoculation; “Lac” is lactobacilli numbers at sample time/numbers at inoculation; “Clos” is clostridia numbers at sample time/numbers at inoculation; and “Total” is total bacteria numbers at sample time/numbers at inoculation.
Microbial community analysis
DNA was extracted from 2 mL of sample using the QIAamp DNA Stool Mini Kit (Qiagen, Hilden, Germany) according the manufacturer's protocol. DNA yield was quantified using a NanoDrop ND-1000 spectrophotometer (NanoDrop Technologies, Willmington, Deleware, USA).
DGGE analysis
The diversity of the bacterial community in samples taken throughout model operation was assessed by DGGE, using primers GC-968F (5′- CGCCCGGGGCGCGCCCCGGGCGGGGCGGGGGCACGGGGGGAACGCGAAGAACCTTAC −3′) and 1401R (5′- CGGTGTGTACAAGACCC -3′). 18 PCR was performed using the GoTaq® Green Master Mix kit (Promega, Madison, Wisconsin, USA). Samples were amplified in a Veriti® 96-Well Thermal Cycler (Applied Biosystems, Carlsbad, California, USA) by using the following program: initial denaturation at 94°C for 2 minutes; 35 cycles of denaturation at 94°C for 30 seconds; annealing at primer-specific temperature for 40 seconds; elongation at 72°C for primer-specific time and extension at 72°C for 5 minutes, followed by a final cooling to 4°C.
DGGE analysis of PCR amplicons was based on the protocol described by Muyzer et al. 19 by using the DCode System (Bio-Rad Laboratories, Hercules, California, USA). Electrophoresis was done as described previously 19 in 8% polyacrylamide gels with a denaturant gradient of 40–55% (100% was defined as 40% formamide and 7 M urea) for 16 hours at 85 V in a 0.5× TAE buffer at a constant temperature of 60°C. Gels were stained with silver nitrate following the method described by Sanguinetti et al., 20 scanned at 400 d.p.i., and further analyzed through the BioNumerics 6.0 software (Applied Maths).The distance matrices of each DGGE based on the Pearson correlation similarity coefficient to cluster the samples was also analyzed using the BioNumerics software (Applied Maths).
Bands of interest in the community fingerprint were excised from the gel and transferred into 25 μl of TE buffer and incubated overnight at 37°C to allow diffusion of the DNA. Two microliters of the eluted DNA was used for reamplification, and the PCR products generated with the GC-clamped primer were checked by DGGE. Only products that migrated as a single band were amplified with the primer without the GC clamp, purified by the QIAprep spin miniprep kit (Qiagen, Valencia, California, USA) and were subjected to DNA-sequence analysis at the genomic facilities of The Human Genome Research Center (HGRC), at the University of São Paulo. BLAST searches were performed to determine the closest known relatives of the partial rRNA gene sequence obtained in GenBank.
Fingerprint ecological interpretation (range-weighted richness, dynamics, and functional organization) was conducted as suggested by Marzorati. 21 The range-weighted richness (Rr) is correlated with the distribution of the bands in the DGGE pattern and the percentage denaturant gradient of the gel needed to represent the sample's total diversity (within the limits of the technique). This concept can be mathematically expressed by defining an index Rr=(N2×Dg), where N represents the total number of bands in the pattern, and Dg the denaturant gradient comprised between the first and the last band of the pattern. Moving window analysis and the microbial community rate of change (dynamics) average the degree of change between consecutive DGGE profiles of the same community, thus estimating the number of species that come to significant dominance over a fixed-time interval. 15 Pareto–Lorenz evenness distribution curves for functional organization were constructed based on the DGGE profiles as previously described. 21
Analysis of short-chain fatty acids and ammonium
Once a week, throughout the entire experimental period (basal, treatment, and washout), samples were collected from the reactors for analysis SCFA and ammonium. The analysis was carried out in triplicates.
Every week, the levels of short-chain fatty acids (SCFA) were determined from samples collected from the reactors and frozen to −20°C. The SCFA were extracted with diethyl ether and determined using a gas chromatograph equipped with a flame-ionization gas detector, a capillary split/splitless injector and an HP-INNOWAX column with a 30 m×0.25 mm×0.25 μm inlet (Shimadzu GC2010), using hydrogen as the carrier gas at a flow rate of 1.56 mL/minute. The temperatures of the column, injector, and detector were 170, 250 and 280°C, respectively. 22
The ammonia content was determined using a selective ion meter (710A model, Orion-USA) coupled to an ammonia selective-ion electrode (Orion 95-12). The apparatus was calibrated using 0.1M standard ammonium chloride solutions, at the concentrations of 10, 100, and 1000 mg/L of ammonia. To every 25 mL of sample, 0.5 mL of ISA solution (Ionic Strength Adjuster, Orion–a pH-adjusting and ionic force solution) was added. All measurements were carried out at 25°C. 23
Statistical analysis
Significance of all results was investigated using the statistical software Sigma Stat 5.0 with one-way ANOVA, and individual means were compared using the Tukey's test.
Results
Microbiological analysis
Using traditional selective growth media, the microbiological analysis revealed that the administration of FOS influenced the composition of the intestinal microbial community. Table 2 shows the microbial counts obtained for the compartments that simulated the ascending, transverse, and descending colon of the SHIME reactor.
Different letters indicate significantly different results (P<.01) within the same microbial group and same compartment (ascending, transverse, and descending colon).
As reflected in the plate count data (Table 2), the administration of FOS to the system induced a significant increase (P<.01) in bifidobacteria, lactobacilli, and facultative anaerobes counts, with a concentration increase of at least 1 log CFU in all “colon” compartments. However, for others groups there were no significant changes during the treatment period.
Prebiotic index
Table 3 shows the PI obtained for the vessels that simulated the ascending, transverse, and descending colon of the SHIME reactor. During the treatment with FOS, the PI was increased in all SHIME reactor compartments. However, in the washout period these values decreased.
Prebiotic index, (Bif/Total) – (Bac/Total)+(Lac/Total) – (Clos-Total), where Bif is bifidobacterial numbers at sample time/numbers at inoculation, Bac is bacteroides numbers at sample time/numbers at inoculation, Lac is lactobacilli numbers at sample time/numbers at inoculation, Clos is clostridia numbers at sample time/numbers at inoculation and Total is total bacteria numbers at sample time/numbers at inoculation.
Different letters in same column indicate significantly different results (P<.01) in same compartment.
Effects of the long-term treatment on the total microbial community structure
DGGE analysis was used to monitor qualitative changes in the composition and structure of the microbial communities in the three compartments simulating the colon conditions. The global fingerprint for general bacteria were found in the “ascending colon” showed that most samples from the treatment period clustered in a separate group and that most samples from the basal and washout period clustered together in another group (Fig. 2). Similar results were found in the “descending colon” (Fig. 3).

DGGE fingerprint patterns for general bacteria in the ascending colon of the SHIME® compartment supplemented with the FOS
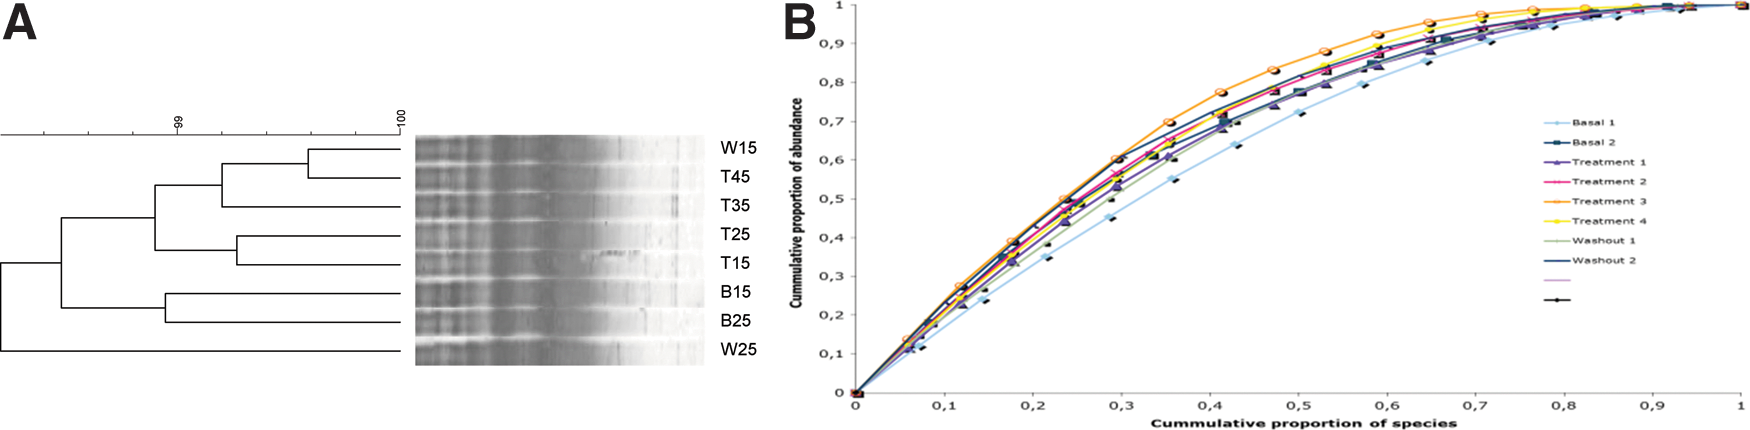
DGGE fingerprint patterns for general bacteria in the descending colon of the SHIME® compartment supplemented with the FOS
After four weeks, the treatment period was finished and the highest similar values (>98%) were found in the “ascending” and “descending colon” between the last week of treatment and the washout period (Fig. 2 and 3). Regarding the “transverse colon,” the treatment did not influence the “colon” microbial community (data not shown).
Based on the DGGE fingerprint analysis of the “colon” microbial community, several shifts in bands or changes in band intensity were observed. To identify the bacterial species that were responsible for those changes, DNA fragments from bands of interest were excised from the DGGE gel, isolated, and finally sequenced. All bands sequenced revealed similarity (99%) with uncultured organism (Fig. 2, 3 and 4).
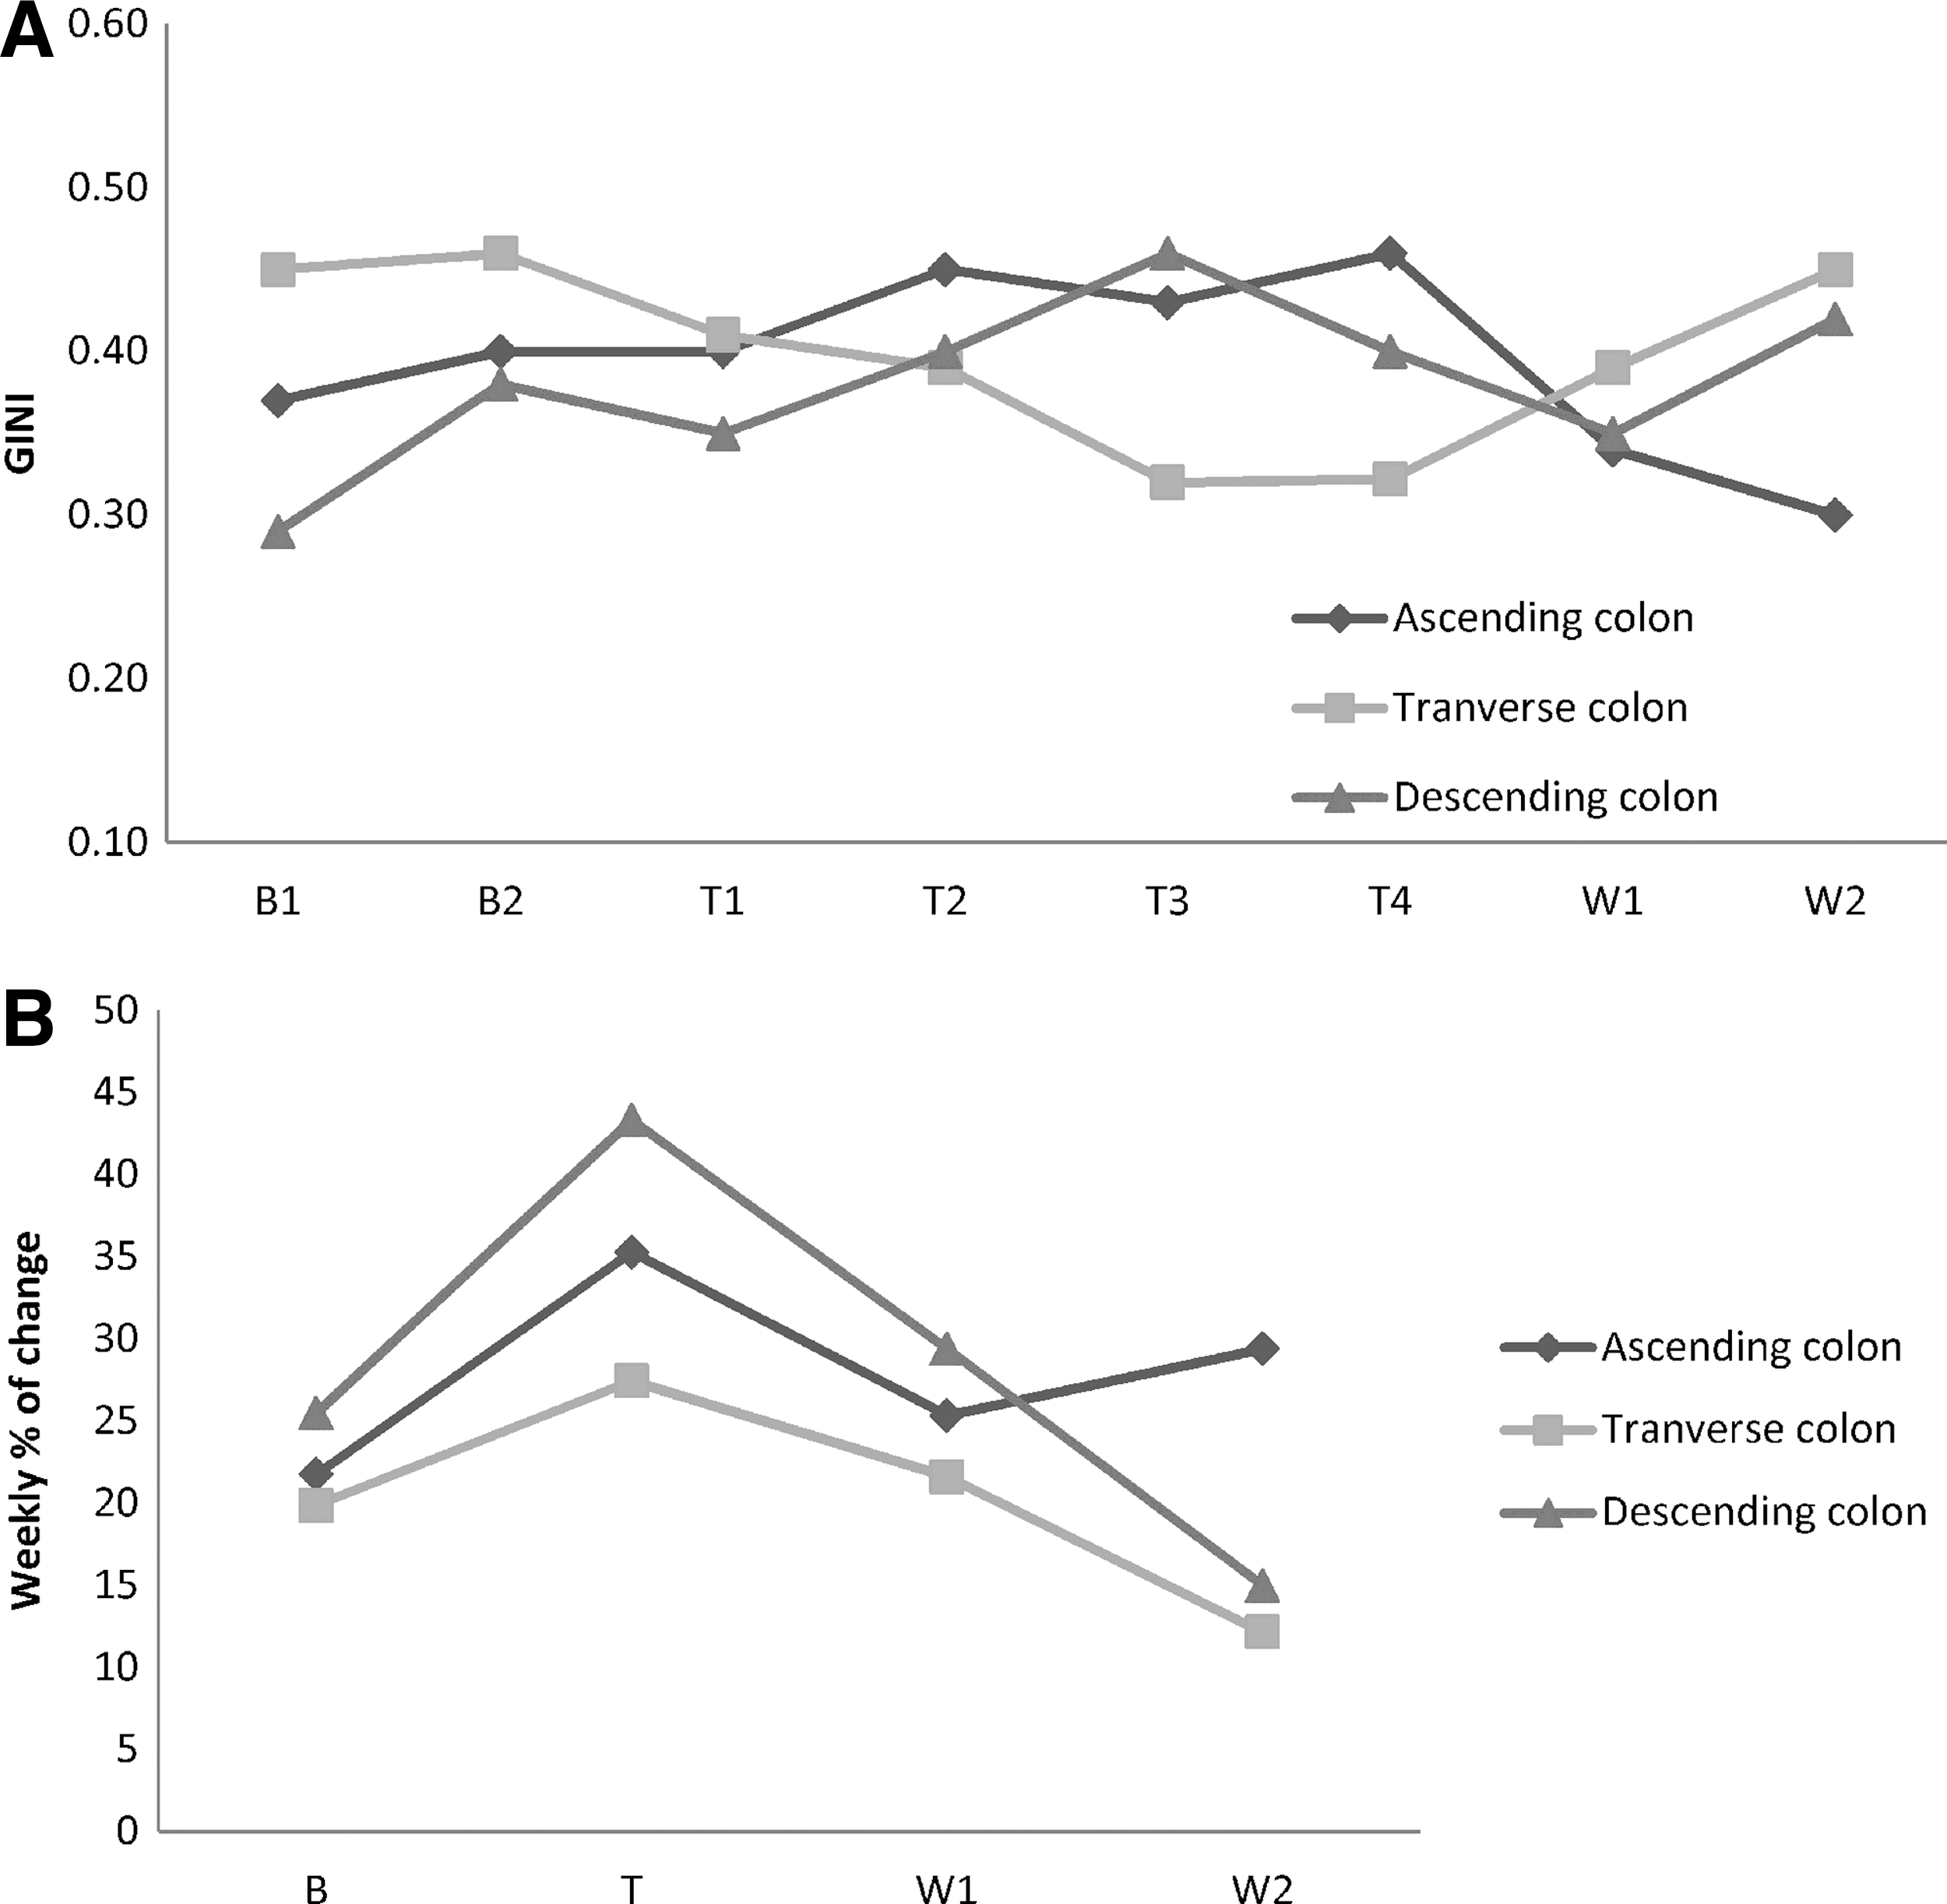
Graphical representation of the dynamics parameter
The effect of the FOS on the composition and structure of the total microbial community in the SHIME system was investigated based on the interpretation of the general bacterial DGGE fingerprints, according to the ecological method. 21 Pareto– Lorenz (PL) curve representation of the functional organization and structure of the microbial community was then applied to samples for the “ascending” and the “descending colon” (Fig. 2 and 3). Range-weighted richness values of the “ascending” and “descending colon” during the treatment period were of 35.3±0.5, indicative of an environment with a great capacity and richness. The dynamics of the system, calculated through the weekly rate of change, showed a peak of diversity (between 25% and 45%) in correspondence to the treatment period in all the “colon” compartments (Fig. 4-A). After this sharp change, the weekly rate of change during the washout period decreased to 30, 25, and 20%, when compared with the treatment period values, for the “ascending,” “transverse,” and “descending colon,” respectively. No major changes (Gini-coefficient of 0.4) in the structure of the microbial communities were identified in the “colon” compartments throughout the SHIME run, except for “transverse colon” (Fig.4-B).
Ammonium concentration and fermentation capacity
Short chain fatty acids (SCFA) analysis and ammonium production are often used to characterize intestinal microbial populations. Table 4 depicts the production of acetate, propionic, and butyric acids during the basal, treatment, and washout periods in the SHIME vessels.
Different letters in same line indicate significantly different results (P<.01) within the same SCFA and same compartment (ascending, transverse, and descending colon).
During the treatment period the addition of FOS resulted in a significantly (P<.01) increase in ammonium ion production with 20% (P<.5), 19% (P<.5), 38% (P<.5) in the “ascending,” “transverse,” and “descending colon” vessels, respectively, when compared with basal period (Fig. 5).

Average ammonium ion production (ppm) in SHIME® reactor during basal, treatment, and washout periods. Statistically significant differences among the samples were investigated with one-way ANOVA. a,bDifferent letters within a variable are significantly different at P<.01.
During treatment with FOS, a significant increase (P<.01) occurred in each of the production of butyrate in the “ascending,” “transverse,” and “descending colon.” The propionic acid had a significant increase (P<.01) only in reactor 3 (“ascending colon”) and the acetate acid increased significantly (P<.01) in reactors 3 and 4 (“ascending” and “transverse colon”). In the washout period, the levels of SCFA decreased in all vessels. The highest SCFA production consisted of acetic acid in all vessels (Table 4). Lactic acid was observed for the treatment and washout period in all vessels (“ascending,” “transverse,” and “descending colon”).
Discussion
The results from the SHIME run showed that FOS has a positive effect on the intestinal microbiota. It is possible to monitor the populations of selected species believed to be indicative of the colon state of health. 2,24
From the data presented in Table 2, it is possible to observe the prebiotic effect on the microbiota changes. These beneficial effects were observed both towards metabolic activity and microbial community composition at doses of 5 g per day. The increased numbers of bifidobacteria and lactobacilli was observed during the treatment period. Lactobacilli and bifidobacteria, which inhabit the gastrointestinal microbiota, have antimicrobial activity that plays a significant part in the host's gastrointestinal system of defense. 25 According to Servin, 26 the main mechanisms of antimicrobial effects are production of H2O, acids, biosurfactants, antimicrobial molecules, and immunomodulation.
DGGE clusters for the “ascending” and “descending colon” showed a separation of the samples before and during the treatments. Ecological interpretation of general bacterial DGGE profiles 21 showed that the microbial communities of the reactor 3 that simulated colon compartments were characterized by a high degree of range-weighted richness and that the FOS treatment had an impact on the community composition (increased dynamics) (Fig. 4b). The analysis of the microbial community structure by Pareto–Lorenz curves was indicative of very well adapted communities with an adequate distribution of species, mainly in the “ascending” and the “descending colon”. Similar results were shown by Possemiers et al. 27 in an experiment with probiotic chocolate also in the SHIME reactor. The authors concluded that the probiotic chocolate probably lead to a temporarily colonization of the simulated gut, while the overall ecological characteristics of the indigenous microbiota were preserved.
Other important observation is about the prebiotic index (PI). The PI concept was introduced by Palframan et al. 17 This index compares different prebiotics based on their ability to increase the populations of bifidobacteria and lactobacilli. During the treatment with FOS the PI index was increased predominantly in the “ascending” and “descending colon.” According to Bird et al., 28 the numbers of bifidobacteria and lactobacilli are probably not the most important contributors towards adult health. The authors suggested that the perspective of prebiotics should be broaden, without changing the definition, by considering changes in the colonic fermentation products, such as butyrate, as key indicators of bowel health. According to the authors, this would result in acceptance of a greater range of dietary components as prebiotics, including resistant starch. In this way, in the present study, the SCFA which increased the most during the FOS treatment was butyrate and this happened in all SHIME reactor compartments, but this effect is clearer in the “ascending colon” (Table 4). SCFA, including acetate, propionate, and butyrate, are produced in the human colon through bacterial fermentation of complex carbohydrates not digested in the small intestine. 29 Butyrate is an important energy source for intestinal epithelial cells and plays a role in the maintenance of colonic homeostasis. Butyrate exerts potent effects on a variety of colonic mucosal functions such as inhibition of inflammation and carcinogenesis, reinforcing various components of the colonic defense barrier and decreasing oxidative stress. In addition, butyrate may promote satiety. 30
On the other hand, during the FOS treatment period increased ammonium concentrations were observed with 20%, 19% and 38% (P<.5) in the “ascending,” “transverse,” and “descending colon” vessels, respectively. The same results were observed by Wiele et al., 22 in a SHIME-run experiment with FOS and inulin. Ammonium production is specifically linked to proteolytic conditions in the gut, which may promote tumourigenesis and induce toxicity. 31
In summary, this study showed effects of FOS on microbial metabolism and community composition. Although metabolic effects were rapidly seen with increased SCFA synthesis towards butyrate and acetate, DGGE analysis indicated that the FOS supplementation had a beneficial effect at the community level. The prebiotic effects were more intense in “ascending colon.” Moreover, FOS prebiotic effects were limited to the period of supplementation. In order to maintain these prebiotic effects and support growth of beneficial bacteria, FOS should thus be continuously dosed.
Footnotes
Acknowledgments
This work had been financially supported by FAPESP — Fundação de Amparo a Pesquisa do Estado de São Paulo (2009/53878-8).
Author Disclosure Statement
The authors do not have any competing financial interests.