
Abstract
The traditional Korean diet has several healthy components, including abundant vegetables, fermented foods, a variety of foodstuffs, and a balance of animal and vegetable food intake. Although the traditional Korean diet has many healthy components, few studies have been conducted on the health advantages of the Korean dietary pattern. This study is intended to clarify the relationship between Korean dietary patterns and chronic diseases using the Integrated Korean Dietary Pattern Score (I-KDPS). I-KDPS is an index for measuring Korean dietary patterns based on traditional Korean meals and reflects the complex and multifaceted characteristics of Korean food culture. I-KDPS is composed of seven items to measure the level of balance and adequacy of Korean food consumption, with a maximum score of 60. When I-KDPS was applied to the Korean National Health and Nutrition Examination Survey (1998–2009), a nationwide survey, I-KDPS was closely related to the risk of metabolic syndrome. Even though there were a few differences among the years surveyed, the risk of metabolic syndrome, obesity, hypertension, and hypertriglyceridemia significantly decreased as I-KDPS increased. These results indicate that risk of diseases, including metabolic syndrome, decreases in individuals adhering to traditional Korean dietary patterns in adequate levels and those who eat a balanced diet. The result of this study shows that the traditional Korean table setting, which comprises side dishes, including seasoned vegetables, grilled dishes, and fermented products with cooked rice (bap), soup (guk), and kimchi, contains traits that help prevent metabolic syndrome. I-KDPS coupled with the basic study of the healthfulness of the Korean dietary lifestyle is expected to help establish a foundation for continuous development of health promoting Korean foods and dietary culture.
Introduction
D
With the increase of metabolic syndrome and CVD worldwide as well as in Korea, the cause of these diseases is attributed to changes in diet. Based on the suggestion that dietary habits play an important role in the onset of chronic disease, many studies have been conducted on the relationship between diet and disease. 5,6 Such studies generally focus on the relationship between a single nutrient or food and a particular disease. However, studying dietary factors individually is of limited use, especially in light of the many interactions between dietary variables and aspects of health, as well as the chance errors due to confounding factors. 7,8 Because of these shortcomings, the central paradigm of diet and disease research has been changed to focus on dietary patterns, which reflect the interaction of an individual and patterns of nutrients and foods beyond any single nutrient or food. 9
A healthy diet is the most efficient method for reducing one's risk of chronic disease, including metabolic syndrome. 10 Therefore, an understanding of how to develop and maintain a healthy and balanced diet is an important health issue. Additionally, it is very cost-effective to suggest preventive measures for decreasing chronic diseases in terms of dietary patterns. Preventive treatment of CVD via drugs costs approximately 12–20 million won (∼11,000–20,000 USD) per year on a societal level. However, the prevention of CVD via nutritional education initiatives and public relations using a health menu has been predicted to cost about 100,000 won (∼100 USD) per person per year. 11 Therefore, nutritional education and public relations that encourage the Korean-style healthy dietary pattern would greatly reduce social spending on chronic diseases. 12 Consequently, research on the association between changing dietary patterns, including that of the traditional Korean diet, and health are urgently needed.
Recently, to evaluate the traditional Korean dietary pattern in light of the complex and multifaceted cultural characteristics of the Korean food, the Integrated Korean Dietary Pattern Score (I-KDPS) was developed and verified. 13 This study aimed to apply the I-KDPS, developed based on unique characteristics of the Korean dietary pattern, to the Korean National Health and Nutrition Examination Survey (KNHANES) data and assess the Korean distributional aspects of the I-KDPS. We hypothesized that this research would provide scientific evidence to support the case for the superiority of the traditional Korean diet by assessing the relationship between Korean food and diseases, such as metabolic syndrome.
Subjects and Methods
Concept of I-KDPS
The I-KDPS was developed to evaluate “What is a balanced and adequate level of consumption for Korean food?” The I-KDPS was developed based on the “three chup bansang” concept of the cultural characteristics of Korean food. Chup refers to the counting unit of side dishes and can be among three chup, five chup, seven chup, nine chup, or 12 chup. Note should be taken that cooked rice, soup, kimchi, and soybean products are not included in the counting of chup. Bansang is the traditional Korean table settings based on rice, including cooked rice, soup, kimchi, soybean products, and various side dishes. 14,15 In particular, three chup bansang, the basic Korean table setting, is mainly composed of rice, soup, kimchi, and soybean products in addition to raw or steamed vegetables, a grilled or braised and glazed dish, and a dried side dish. 15 Three chup bansang, despite having fewer side dishes, is thought to be the table setting that best represents the range of dishes and the unique characteristics of Korean food. 14,16
Components of I-KDPS
I-KDPS is composed of seven items that highlight the cultural characteristics and superiority of Korean food. This study uses the model of the Korean table setting (Fig. 1b) comprising seven items by flexibly modifying three chup bansang (the basic form of the traditional Korean table setting; Fig. 1a). In the case of rice dishes (item 1), in addition to the cooked rice, porridge, noodles, sliced rice pasta soup, dumpling soup, and bibimbap are included. Soup dishes (item 2) include soups, stews, and hot pots. Finally, seasoned vegetable dishes (item 3) include both raw vegetables, such as radish or cucumber, and steamed vegetables, such as spinach or bracken. Grilled dishes (item 4) include grilled, braised, and steamed dishes, and pan-fried delicacies. The kimchi item (item 5) includes various kimchis and pickled vegetables. Red chili pepper paste, soybean, and seasoned pastes served individually are included as a soybean product items (item 6). Dried side dishes (item 7) include pickled seafood and slices of dried meat.

Korean traditional table setting (three chup bansang)
I-KDPS scoring
The relative importance and intake amounts in the Korean dietary pattern of the seven items included in the I-KDPS were evaluated and ranked. 1 The I-KDPS comprises a 60-point scale. Ten points were given to cooked rice (item 1), soup (item 2), seasoned vegetables (item 3), grilled dishes (item 4), and kimchi (item 5). Soybean products (item 6) and dried side dishes (item 7) were given 5 points each. Based on a standard portion size for each item, the total intake rate of each item was calculated over three meals: breakfast, lunch, and supper. Using the criterion of three intakes of a portion during each meal, in case of intakes ranging between ±20% of the criterion, a scoring point was given. No points were given to scores of null or more than ±200%. Intakes between such ranges were given a score proportional to the intake amount. For example, when only three items of cooked rice (item 1), kimchi (item 5), and dried side dishes (item 7) are consumed at the recommended level, the maximum scores to be gained was 10, 10, and 5 points, respectively, adding up to 25 in total. That is, since the maximum points to be gained when properly consuming one item is either 10 or 5 points, a high score can be acquired only through a balanced intake of Korean dishes.
Application of the I-KDPS to KNHANES data
To conduct our analysis, we applied the newly developed I-KDPS to the first (1998), second (2001), third (2005), and fourth (2007–2009) round data of KNHANES. KNHANES aims to obtain reliable and wide-ranging statistics on national health and nutritional conditions, as well as beliefs and behaviors that affect such conditions. KNHANES contains three different nutritional surveys (the food frequency questionnaire [FFQ], dietary intake survey [24-h recall method], dietary life survey [dietary life and behaviors]), in addition to health behavior and examination surveys. 17
This study was conducted on adults aged 19 years and older, using the dietary life survey, the 24-h recall method, body measurement, and blood test data among the first through fourth term survey subjects. Data of persons with energy intakes of <500 kcal or >5000 kcal, as well as pregnant women, were excluded. 18,19 Furthermore, individuals with missing values or outliers were excluded, and the final analysis included data of 27,940 participants (first: 5849, second: 3993, third: 4485, and fourth: 13,613).
To identify variables that may have an effect on I-KDPS, this study analyzed the relationship between I-KDPS and variables, including sex, age, alcohol consumption habits (drinker/nondrinker), smoking status (current smoker/past smoker/never smoked), physical activity levels (light, medium, vigorous), body mass index (BMI) (underweight: BMI <18.5 kg/m2; normal: 18.5 kg/m2≤BMI<23 kg/m2; overweight: 23 kg/m2≤BMI<25 kg/m2; obese: BMI ≥25 kg/m2), and vitamin/mineral supplement intake (yes/no). Control was implemented on variables that have significant relationships with I-KDPS when levels of chronic diseases risk were analyzed in accordance with I-KDPS.
There are various criteria for diagnosing metabolic syndrome, but this study followed the National Cholesterol Education Program-Adult Treatment Panel III (NCEP-ATP III) criteria. Abdominal obesity was assessed using the Korean criterion suggested by the Korean Society for the Study of Obesity in 2005. Impaired fasting glucose (IFG) was based on 110 mg/dL by NCEP-ATP III but was applied to 100 mg/dL as adjusted by the 2003 American Diabetes Association. The diagnostic criteria of the NCEP-ATP III state that if an individual satisfies three of the five criteria—abdominal obesity (waistline >90 cm for men and >85 cm for women), hypertension (>130 mmHg SBP or >85 mmHg DBP, or drug use among patients with a history of hypertension), hypertriglyceridemia (>150 mg/dL neutral fat in blood or drug use), low high-density lipoprotein (HDL)-cholesterolemia (<40 mg/dL for men, <50 mg/dL for women, or drug use), and IFG (>100 mg/dL fasting blood sugar or drug use), they are defined as having metabolic syndrome. Obesity was defined as a BMI ≥25.0 kg/m2 according to the Asia-Pacific regional criterion of the WHO. In addition, hyperlipidemia was set as a blood serum total cholesterol level of ≥240 mg/dL, consistent with NCEP-ATP III criteria.
Statistical analysis
In this study, SAS version 9.2 (Statistical Analysis System, SAS Institute, Cary, NC, USA) was used to analyze data. KNHANES data are not obtained by simple random sampling, but by stratified by multistage sampling. With this in mind, analysis contained weight, stratification variables, and a colony variable. In the case of weighting, according to KCDC recommendations, the weight of the individual survey was applied to the analysis of a single survey category and the weight of relationship analysis was applied to the analysis of relationships among variables of many categories. KSTRATA was used as a stratification variable. Additionally, PSU of the first sampling unit was used as a cluster variable. Because of the complex sample design of KNHANES, the SURVEY procedure was used for every analysis.
For analysis of the I-KDPS, total and item scores were scored individually, and individual raw scores were used for every value of the analytic data according to the purpose. Categorical data are presented as frequency (weighted percentage). The level of significance for all statistical analysis was set at α=0.05.
For the analysis of the relationship between the I-KDPS and variables, including sex, age, alcohol consumption, smoking, physical activity level, BMI, and vitamin/mineral supplement intake, the SURVEYFREQ procedure was used and included weight; chi-square tests were conducted and are presented as percentages considering frequency and weight. Based on the total I-KDPS score, in four groups (Q1, Q2, Q3, and Q4) classified by quartile, the comparison between CPF ratio and total energy intake was analyzed using the SURVEYREG procedure with weight taken into consideration. Besides, for each quartile of I-KDPS, the level of disease risk was presented as odds ratio (OR) and 95% confidence interval using the SURVEYLOGISTIC procedure. Multiple regression analysis was conducted after controlling for sex, age, energy intake, smoking, alcohol consumption, and physical activity level.
Results
Score distribution of the I-KDPS
The I-KDPS scores were divided into five groups: 0–12, 13–24, 25–36, 37–48, and 49–60 points. Figure 2 shows the distribution of participants' scores by survey year as follows: During the first term (1998), 8.02% scored 0–12, 46.61% scored 13–24, 37.75% scored 25–36, 7.53% scored 37–48, and only 0.09% scored 49–60 points. During the second term (2001), 10.68% scored 0–12, 47.66% scored 13–24, 35.68% scored 25–36, 5.92% scored 37–48, and only 0.05% scored 49–60 points. During the third term (2005), 9.63% scored 0–12, 42.96% scored 13–24, 38.10% scored 25–36, 9.21% scored 37–48, and only 0.11% scored 49–60 points. During the fourth term (2007–2009), 12.06% scored 0–12, 47.58% scored 13–24, 33.85% scored 25–36, 6.34% scored 37–48 points, and only 0.18% scored 49–60 points.
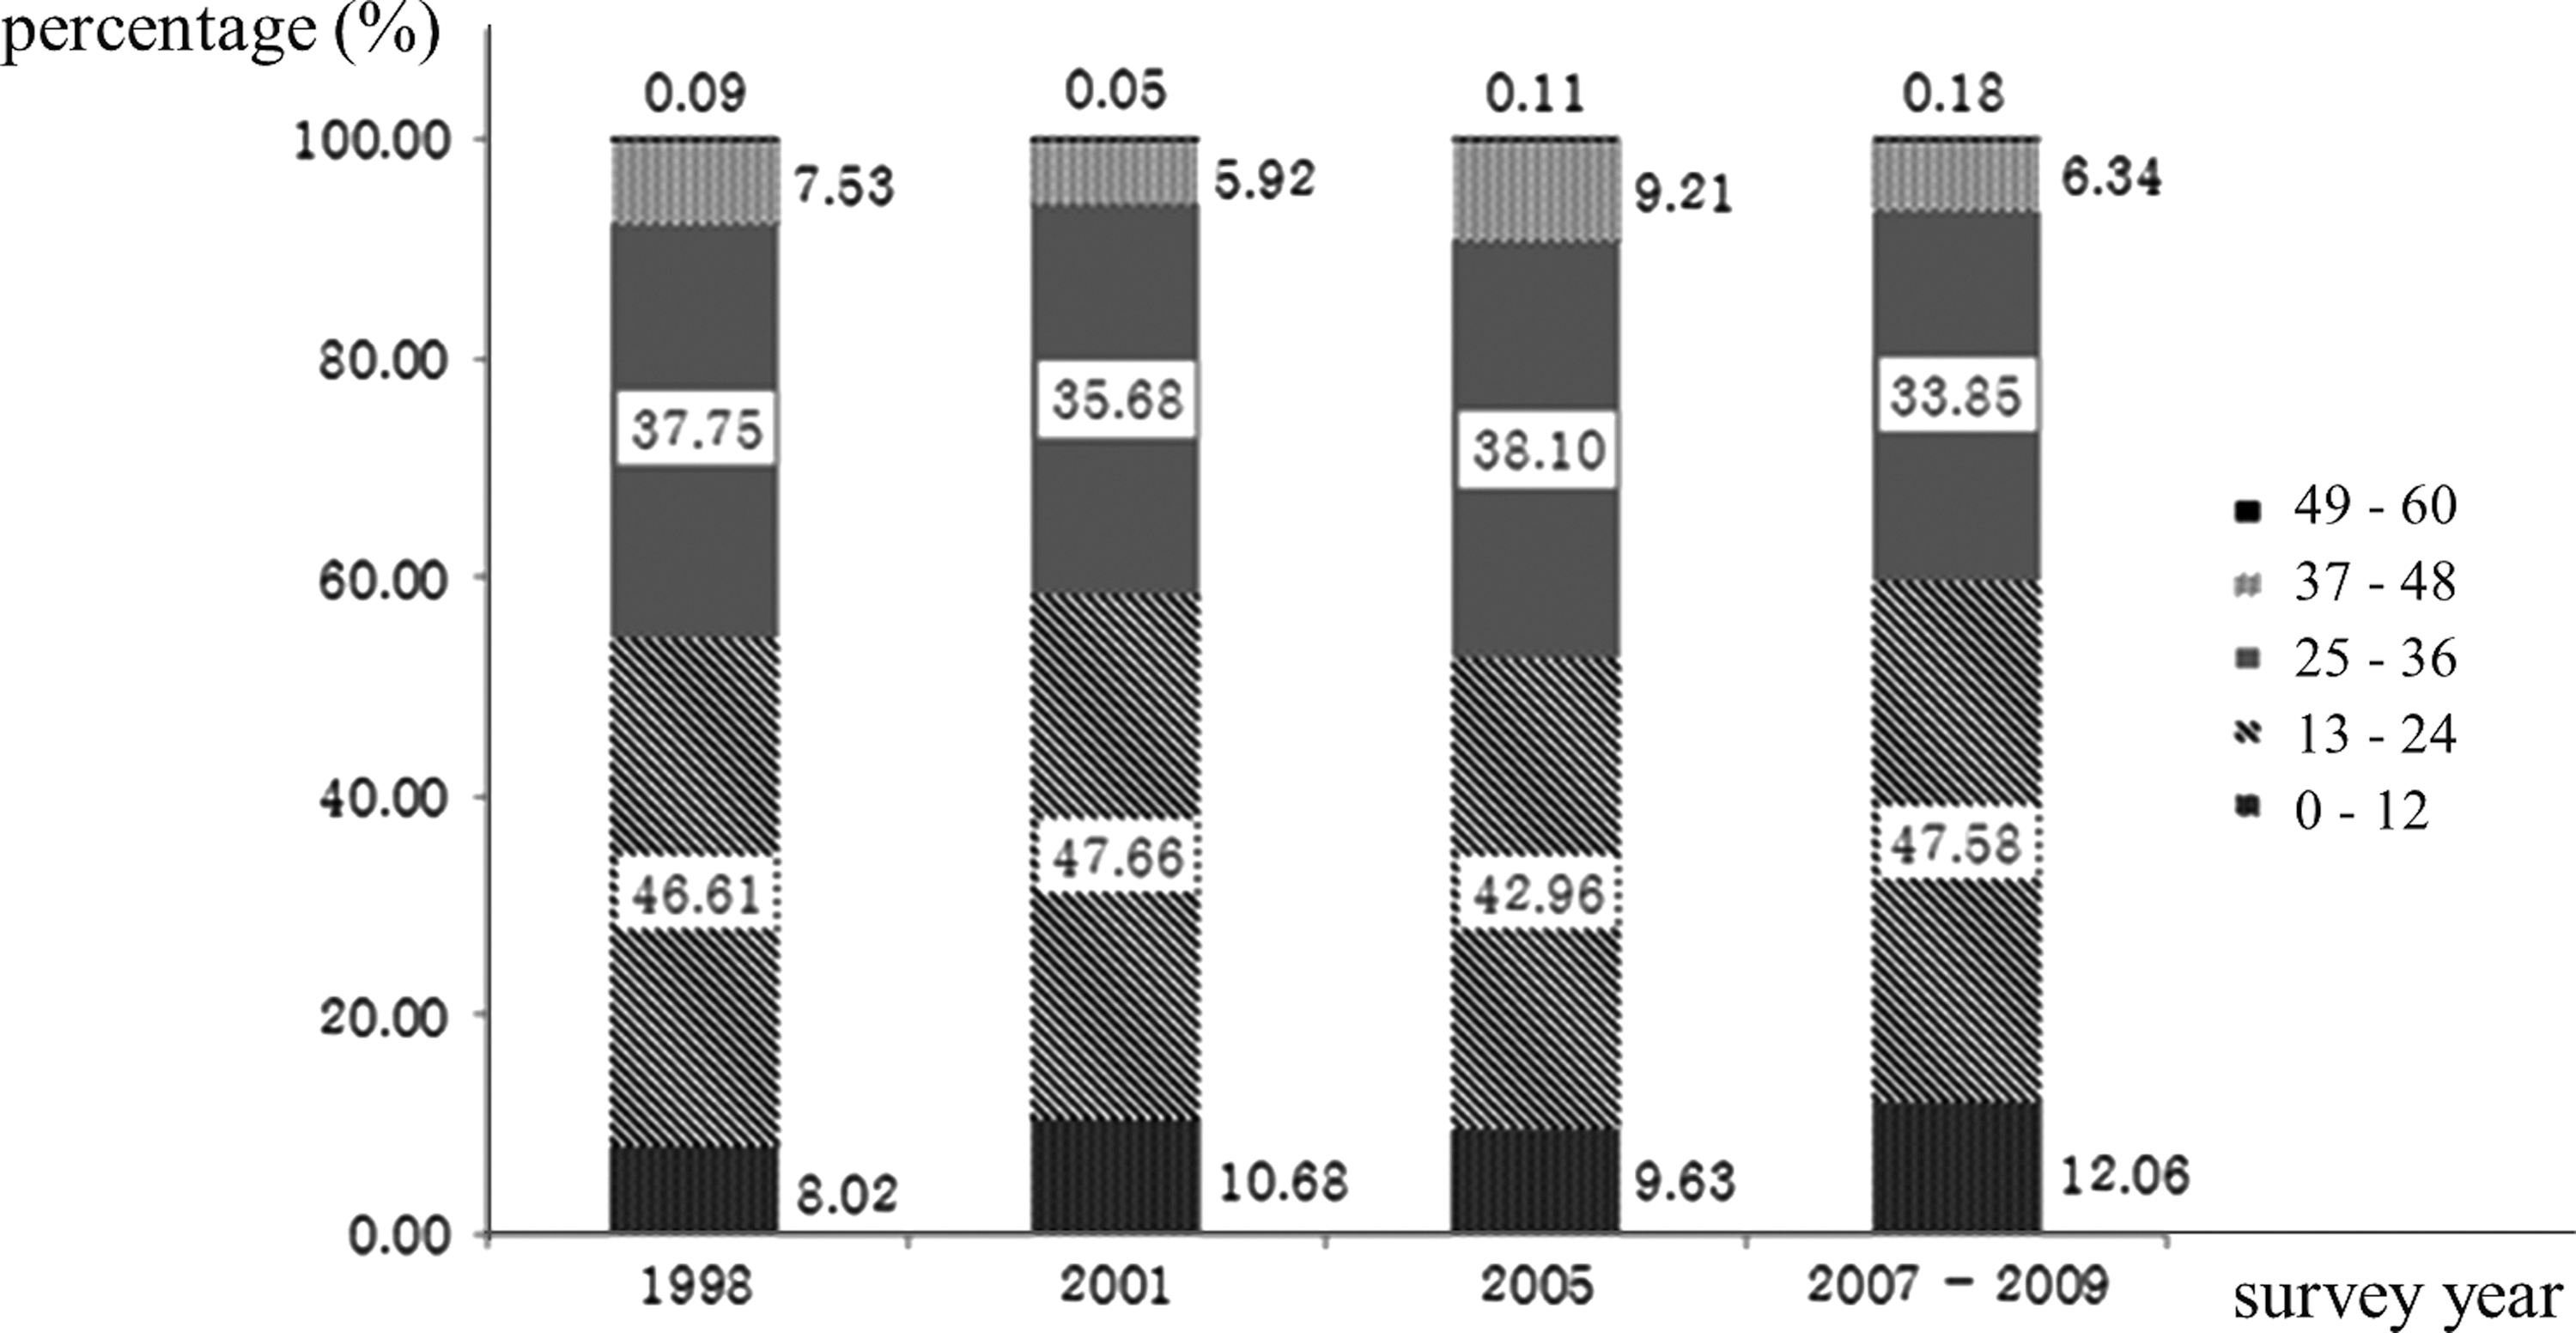
Sectional distribution of the Integrated Korean Dietary Pattern Score (I-KDPS) score by the survey year. I-KDPS were divided into five groups: 0–12, 13–24, 25–36, 37–48, and 49–60 points. Data values are presented as weighted percentage (%).
Figure 3 shows the proportion of participants who scored perfection or 0 points by item in the I-KDPS for each survey year. In the case of the I-KDPS, the percentage of persons who scored perfection was 16.54% in the first term, 15.80% in the second term, 18.67% in the third term, and 15.51% in the fourth term; the highest proportion was noted in the third term. Some participants did not receive an I-KDPS score at all: 1.09% in the first term, 1.45% in the second term, 1.60% in the third term, and 1.58% in the fourth term.
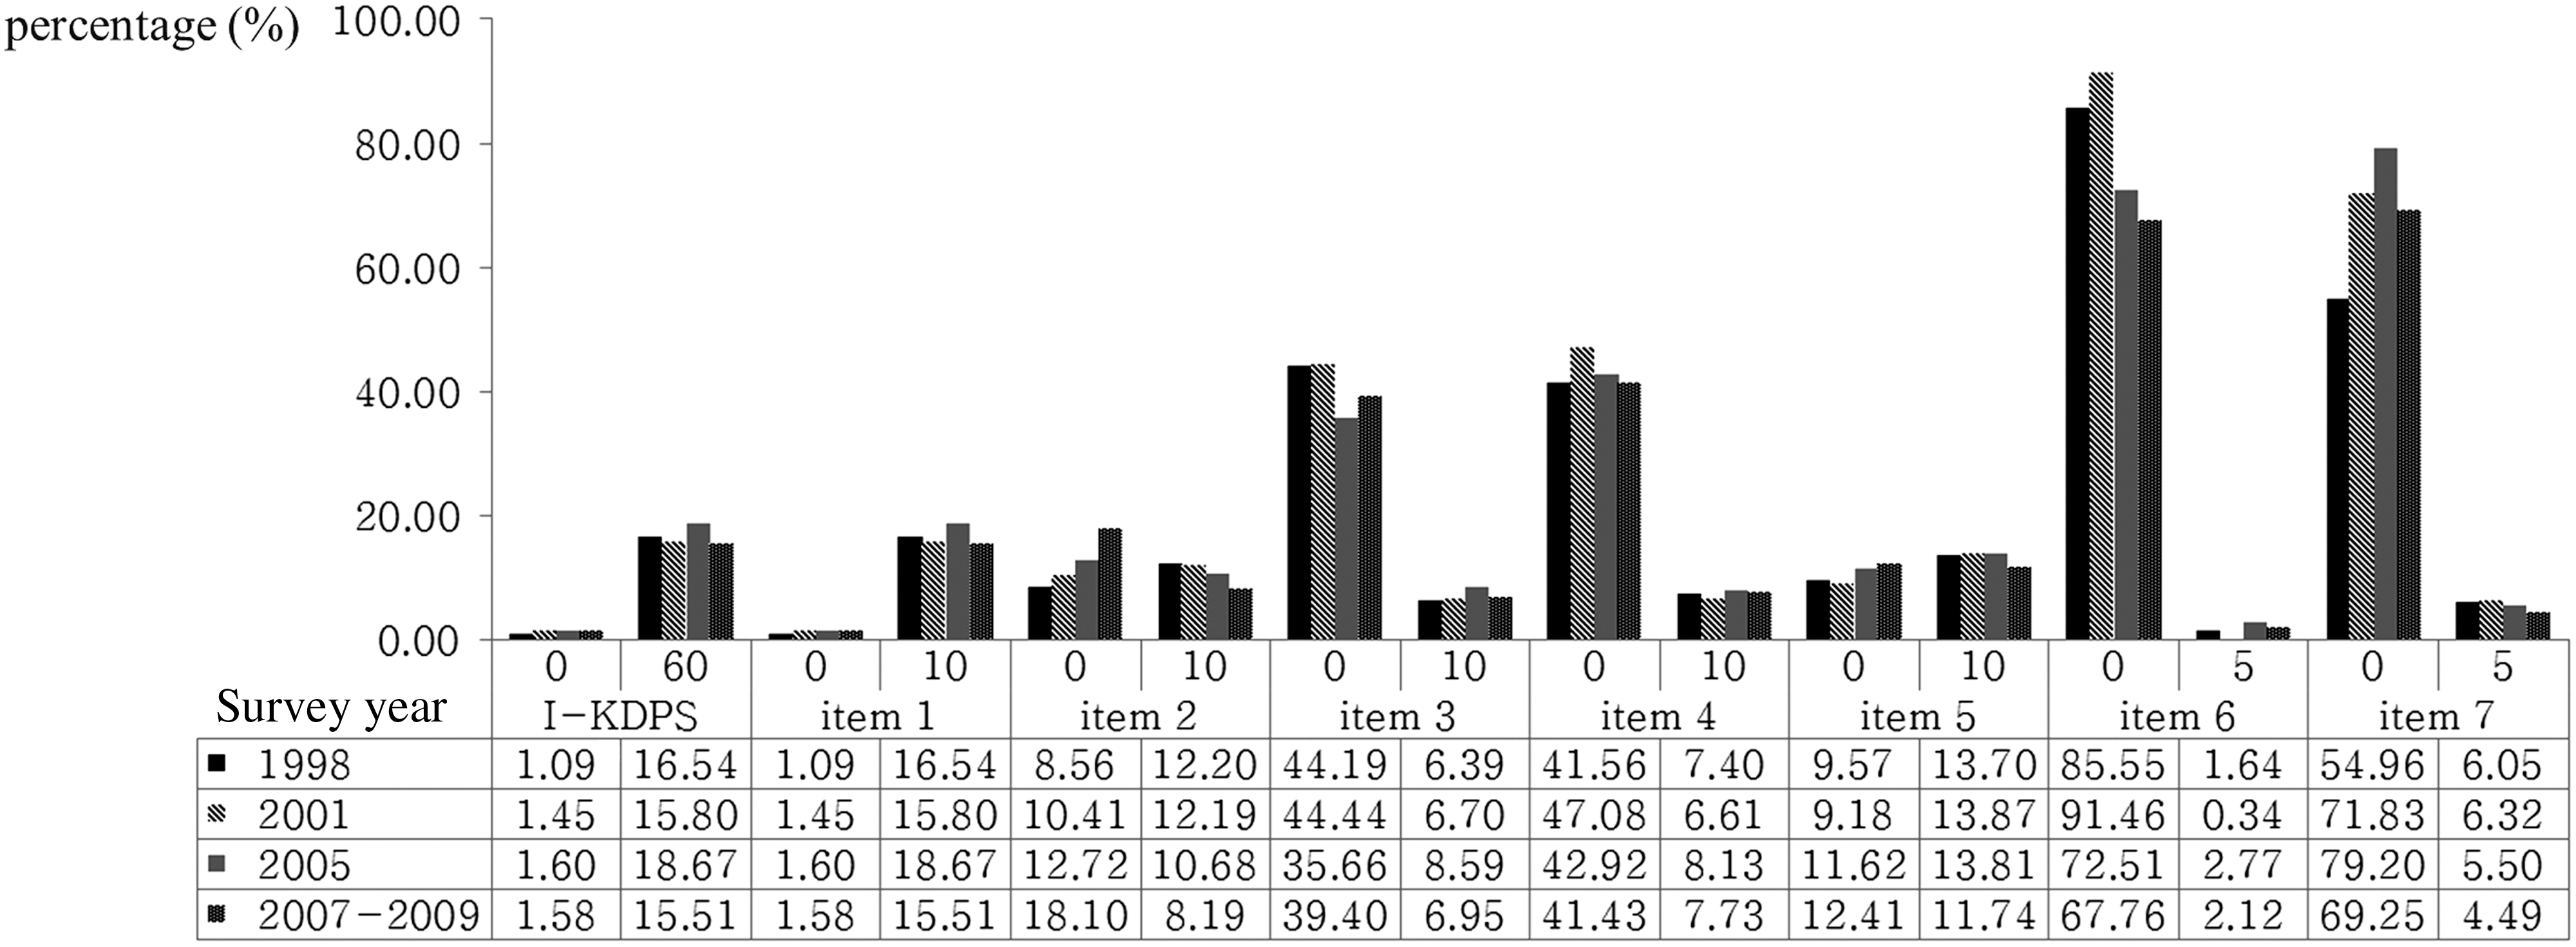
Percentage of participants who scored either a perfect score or null score by total score and I-KDPS item. Item 1: cooked rice; item 2: soup; item 3: seasoned vegetable; item 4: grilled dishes; item 5: kimchi; item 6: soybean products; item 7: dried side dished. Data values are presented as weighted percentage (%).
The survey year that had the highest proportion of perfect scores by item was the third term (18.67%) for the cooked rice item (item 1) and the first (12.20%) and second terms (12.19%) for the soup item (item 2) showed a similar level. The proportion of participants who got perfect scores was the highest in the third term (8.59%) for the seasoned vegetable item (item 3), followed by the fourth term (7.73%) for the grilled dish item (item 4). For kimchi (item 5), it was the highest in the second term (13.87%). Additionally, participants scored the highest in the third (2.77%) and second terms (6.32%) for soybeans (item 6) and side dishes (item 7), respectively.
In terms of the distribution of null scores, the highest proportion occurred in the third term (1.60%) for cooked rice (item 1) and the fourth term (18.10%) for soup (item 2). In the case of seasoned vegetables (item 3) and grilled dishes (item 4), the percentage of persons who scored zero was the highest in the second term (44.44% and 47.08%), respectively. In the case of kimchi (item 5), the highest proportion of null scores was in the fourth term (12.41%) and in the second (91.46%) and third term (79.20%) for soybeans (item 6) and side dishes (item 7).
General characteristics of subjects
To assess variables that may have an effect on the I-KDPS score, this study examined the relationship between I-KDPS and variables, including sex, age, alcohol consumption, smoking behavior, physical activity level, and vitamin/mineral supplement intake by survey year. The results are shown in Table 1.
Data values are reported as unweighted sample size (weighted percentage).
P<.05, ** P<.01.
I-KDPS, Integrated Korean Dietary Pattern Score; Q1–Q4, quartiles.
In each survey year, sex (P<.01) and age (P<.01) were shown to have a significant relationship with the I-KDPS score. In the fourth term, women comprised 64.62% of the lowest scoring group (Q1), whereas men comprised 66.44% of the highest scoring group (Q4). Subjects aged 20–30 years comprised 25.78% of Q1, whereas those aged 30–49 years and 50–64 years were overrepresented in Q4. People aged older than 65 years comprised 21.74% of Q1, much higher than that in Q2, Q3, and Q4. As a result of investigation into average age by I-KDPS groups in each surveyed year, it turned out that there are significant differences according to I-KDPS in the first (mean age of Q1: 45.03 years; Q2: 43.06 years; Q3: 40.30 years; Q4: 39.15 years; P<.01), second (mean age of Q1: 44.57 years; Q2: 42.12 years; Q3: 40.38 years; Q4: 39.00 years; P<.01), third (mean age of Q1: 46.93 years; Q2: 44.33 years; Q3: 42.41 years; Q4: 41.06 years; P<.01), and fourth term (mean age of Q1: 45.51 years; Q2: 44.68 years; Q3: 43.62 years; Q4: 43.24 years; P<.01) (data not shown).
In the first (1998) and second terms (2001), alcohol consumption (P<.01), smoking (P<.01), physical activity (P<.01), and BMI (P<.01) showed a significant correlation with the I-KDPS score. In the third term (2005), alcohol consumption (P<.01), smoking (P<.01), and physical activity (P<.01) showed a significant correlation with the I-KDPS score. Alcohol consumption (P<.01), smoking (P<.01), and BMI (P<.01) also showed a significant correlation with the I-KDPS score in the fourth term (2007–2009). A significant relationship between physical activity level and the I-KDPS score was not observed for any survey year. However, in the fourth term, the percentage of individuals undertaking vigorous physical activity was 23.56% in Q4 and decreased to 21.15% in Q1, indicating that the lowest scoring group also had lower physical activity levels. Furthermore, the percentage of participants with BMI within the normal range was 36.54% in Q4, followed by those considered obese (34.41%), overweight (25.89%), and underweight (3.16%). The lowest scoring group (Q1) followed the same pattern. However, in Q1, the percentage of subjects with a BMI within the normal range was higher and the proportion of obese individuals was lower when compared with the make-up of Q4.
In the second (2001) and the third terms (2005), vitamin/mineral supplement intake (P<.01) was significantly correlated with the I-KDPS score, but there was no significant correlation with the I-KDPS score in the first and fourth terms.
Energy ratio of the three major nutrients (% energy from carbohydrates, protein, and fat) and total energy intake on the basis of I-KDPS are presented by each surveyed year in Table 2. Similar trends are shown from first period (1998) to fourth period (2007–2009). In all surveyed years, it was observed that as I-KDPS increased, the C:P:F ratio approached the recommended levels (C:P:F=65:15:20). 20 In addition, total energy intake exhibited significant differences depending on I-KDPS, and it was confirmed that in comparison to lower I-KDPS groups (Q1, Q2), upper ones (Q3, Q4) were closer to recommended level of daily total energy intake.
Data values are reported as mean±SD.
Means with different superscript lowercase letters are significantly different by Tukey's multiple range test.
Means are significantly different at α=0.05.
Means are significantly different at α=0.01.
I-KDPS and chronic disease
To examine the risk of onset of diseases, we calculated the OR using multiple logistic regression for each quartile. Analysis was conducted within three models: In model 1, no variables were controlled for; in model 2, sex, age, and energy intake, which were assumed to have an effect on I-KDPS score and onset of a disease, were controlled for; and in model 3, variables such as sex, age, energy intake, BMI, smoking, alcohol consumption, and physical activity level were controlled for. Tables 3 –6 show the ORs for each quartile according to the survey year.
Data values are reported as OR (CI), ORs from the Q2, Q3, Q4 relative to the Q1. Model 1: crude; Model 2: adjusted for age, sex, and energy intake; Model 3: adjusted for age, sex, energy intake, physical activity, smoking, and drinking.
Metabolic syndrome (MS) is diagnosed by the modified NCEP ATP III criteria (any three of five constitutes, for waist circumferences ≥90 cm in men, ≥85 cm in women, for blood pressure ≥130 mmHg systolic blood pressure or ≥85 mmHg diastolic blood pressure or on antihypertensive drug treatment, for triglyceride ≥150 mg/dL or on drug treatment for elevated triglyceride, for HDL-cholesterol <40 mg/dL in men, <50 mg/dL in women or on drug treatment for reduced HDL-cholesterol, for fasting glucose ≥100 mg/dL or on drug treatment for elevated glucose).
P from multiple logistic regression analysis (* P<.05, ** P<.01).
OR, odds ratio; CI, 95% confidence interval.
Data values are reported as OR (CI), ORs from the Q2, Q3, Q4 relative to the Q1. Model 1: crude; Model 2: adjusted for age, sex, and energy intake; Model 3: adjusted for age, sex, energy intake, physical activity, smoking, and drinking.
Metabolic syndrome (MS) is diagnosed by the modified NCEP ATP III criteria (any three of five constitutes, for waist circumferences ≥90 cm in men, ≥85 cm in women, for blood pressure ≥130 mmHg systolic blood pressure or ≥85 mmHg diastolic blood pressure or on antihypertensive drug treatment, for triglyceride ≥150 mg/dL or on drug treatment for elevated triglyceride, for HDL-cholesterol <40 mg/dL in men, <50 mg/dL in women or on drug treatment for reduced HDL-cholesterol, for fasting glucose ≥100 mg/dL or on drug treatment for elevated glucose).
P from multiple logistic regression analysis (* P<.05, ** P<.01).
Data values are reported as OR (CI), ORs from the Q2, Q3, Q4 relative to the Q1. Model 1: crude; Model 2: adjusted for age, sex, and energy intake; Model 3: adjusted for age, sex, energy intake, physical activity, smoking, and drinking.
Metabolic syndrome (MS) is diagnosed by the modified NCEP ATP III criteria (any three of five constitutes, for waist circumferences ≥90 cm in men, ≥85 cm in women, for blood pressure ≥130 mmHg systolic blood pressure or ≥85 mmHg diastolic blood pressure or on antihypertensive drug treatment, for triglyceride ≥150 mg/dL or on drug treatment for elevated triglyceride, for HDL-cholesterol <40 mg/dL in men, <50 mg/dL in women or on drug treatment for reduced HDL-cholesterol, for fasting glucose≥100 mg/dL or on drug treatment for elevated glucose).
P from multiple logistic regression analysis (* P<.05, ** P<.01).
Data values are reported as OR (CI), ORs from the Q2, Q3, Q4 relative to the Q1. Model 1: crude; Model 2: adjusted for age, sex, and energy intake; Model 3: adjusted for age, sex, energy intake, physical activity, smoking, and drinking.
Metabolic syndrome (MS) is diagnosed by the modified NCEP ATP III criteria (any three of five constitutes, for waist circumferences ≥90 cm in men, ≥85 cm in women, for blood pressure ≥130 mmHg systolic blood pressure or ≥85 mmHg diastolic blood pressure or on antihypertensive drug treatment, for triglyceride ≥150 mg/dL or on drug treatment for elevated triglyceride, for HDL-cholesterol <40 mg/dL in men, <50 mg/dL in women or on drug treatment for reduced HDL-cholesterol, for fasting glucose ≥100 mg/dL or on drug treatment for elevated glucose).
P from multiple logistic regression analysis (* P<.05, ** P<.01)
In the first term (1998), when model 3 was used for analysis, the results indicated that the risk of hypertension in the Q3 group was 0.81 (OR: 0.81, 0.67–0.98) and in the Q4 group was 0.79 (OR: 0.79, 0.64–0.98) compared with the Q1 group. As the I-KDPS score increased, the risk of hypertension decreased significantly (P<.05; Table 3).
In the second term (2001), when model 3 was used for analysis, the risk of hypertension in the Q3 group was 0.72 (OR: 0.72, 0.54–0.94) compared with the Q1 group. As the total I-KDPS score increased, the risk of hypertension decreased significantly (P<.05; Table 4).
Compared with the first and second terms, the risk of various diseases decreased in the third term (2005). When model 3 was used for analysis, compared with the Q1 group, in the Q3 group, the risk of obesity was 0.72 (OR: 0.72, 0.55–0.95), the risk of abdominal obesity was 0.77 (OR: 0.77, 0.60–0.99), and the risk of low HDL cholesterolemia was 0.71 (OR: 0.71, 0.54–0.94). Furthermore, compared with the Q1 group, the risk of hypertension and hypertriglyceridemia decreased to 0.74 (OR: 0.74, 0.57–0.98) and 0.76 (OR: 0.76, 0.59–0.99), respectively, in the Q4 group. In the case of metabolic syndrome, the risk decreased to 0.77 (OR: 0.77, 0.60–0.99) in the highest I-KDPS group Q4 compared with the lowest group Q1. The more the total score of I-KDPS increased, the more the risk of metabolic syndrome decreased significantly (Table 5).
In the fourth term (2007–2009), the risk of obesity in the Q2 group was 0.85 (OR: 0.85, 0.75–0.97) compared with the Q1 group. The results showed that as the I-KDPS score increases, the risk of obesity decreased significantly. Furthermore, as the I-KDPS score increased, the risk of diabetes decreased significantly. In addition, in the Q4 group, the risk of metabolic syndrome decreased to 0.89 (OR: 0.89, 0.75–0.97) compared with the Q1 group (Table 6).
Discussion
This study examined the relationship between the I-KDPS score and the risk of developing chronic diseases. I-KDPS was developed on the concept of a “table setting,” a key characteristic of Korean culinary culture. I-KDPS, composed of items characteristic of Korean dishes, was significantly related to the risk of chronic diseases, including metabolic syndrome. Particularly, it was verified through this study that the risk of various diseases decreases as I-KDPS increases.
Results were similar across the KNHANES survey years. However, over recent years, the proportion of subjects scoring more than 25 points has decreased, indicating that the percentage of persons consuming large amounts of traditional Korean food has decreased. Furthermore, the results of the analysis of I-KDPS scores showed that cooked rice and soups were the most often consumed foods. Rice and soup, both important elements of the Korean table setting, were also consumed more often than other items on the list, whereas seasoned vegetables and fermented soybean products were consumed less often. Abundant vegetables and fermented food are seen as important aspects of the traditional Korean diet. 21 In particular, seasoned vegetables and soybean products may be regarded as items most uniquely characteristic of Korean food. The results of this study indicate that the consumption of raw and steamed vegetables, as well as fermented soybean products, should be promoted.
This study examined the relationship between the I-KDPS score and sex, age, alcohol consumption behavior, smoking, physical activity level, and vitamin/mineral supplement intake. The results showed that men aged 30–49 years, those with high physical activities levels, and those who consumed alcohols were more likely to have a high I-KDPS score. Furthermore, I-KDPS score increased in line with vitamin/mineral supplement intake. Subjects aged 20–29 and 65 years or older were overrepresented in the lowest-scoring quartile Q1, and those aged 30–49 and 50–64 years were overrepresented in the highest-scoring quartile Q4. These findings are in contrast to those of Song et al., 22 who found that persons aged 30–49 years consumed the least traditional foods, constituting approximately 20% of the traditional dietary pattern group. Similar to the studies by Martikainen et al. 23 and Sanchez-Villegas et al., 24 our results show that demographic variables vary according to dietary patterns. In addition, in the highest quartile, the percentage of alcohol drinkers was higher and that of nonsmokers was lower. The findings of the previous study 25 that the men in their 50s are more likely to smoke and men in their 40s are more likely to consume alcohol may explain why men of this age group were overrepresented in the highest-scoring quartile. As alcohol consumption and smoking are risk factors for impaired lipid metabolism and coronary artery diseases, 26 efforts to curb alcohol consumption and smoking should be pursued.
We found a significant correlation between the I-KDPS score and risk of metabolic syndrome. Although the results did not differ significantly by survey year, as the I-KDPS increased, the risk of disease decreased significantly. In the first term (1998), the risk of hypertension decreased significantly, with a significant decrease in hypertension and low HDL cholesterolemia risk in the second term (2001). This supports the finding of a previous study 22 showing that the risk of hypertension is higher among those with a mixed dietary pattern than those with an unbalanced traditional dietary pattern. Hypertension is related to the risk of myocardial infarction, stroke, and CVD. In addition, considering the fact that the prevalence of hypertension increased from 25.1% in 2007 to 31.9% in 2009 for Koreans aged older than 30 years, 17 this study provides key information about a possible way to decrease the hypertension risk by switching to a traditional Korean diet. In the third term (2005), risks of obesity, abdominal obesity, hypertension, hypertriglyceridemia, low HDL cholesterolemia, and metabolic syndrome decreased significantly. Furthermore, in the fourth term (2007–2009), the risks of obesity and metabolic syndrome decreased, indicating that the risk of diseases including metabolic syndrome are lower in persons who adequately consume traditional Korean diets in a balanced way. In a previous study of Korean adults' dietary patterns, it was reported that Korean adults who consumed rice and kimchi in their dietary pattern (considered to be an unbalanced traditional diet), the risk of metabolic syndrome increased significantly in the highest-scoring group compared with the lowest-scoring group, suggesting a risk associated with the traditional Korean pattern of overconsuming refined grains. 27 However, in this study, contrary to the findings of previous studies, the results showed that consuming moderate amounts of Korean food decreased the risk of metabolic syndrome. Furthermore, Feldeisen and Tucker 28 suggest that a reduction in fat intake, coupled with an increase in vegetable intake and balanced intakes of dietary fiber and carbohydrate, can prevent metabolic syndrome. Our findings show that Korean dietary patterns have characteristics that may help to prevent metabolic syndrome. Furthermore, Korean food shares characteristics with the Dietary Approaches to Stop Hypertension (DASH) diet, a dietary pattern for the control and prevention of hypertension, in that is characterized by high fruit and vegetable intake and lower fat intake. Because of this, we believe that the traditional Korean diet may help to prevent hypertension. 29
Although there was a slight difference in disease risks by survey year, the risk of diseases, including obesity, abdominal obesity, hypertension, hypertriglyceridemia, low HDL cholesterolemia, and metabolic syndrome, decreased as the I-KDPS score increased. This implies that proper levels of Korean food intake can help prevent diverse diseases. A cohort study by Williams et al. 30 showed that a balanced healthy diet with abundant fruits, vegetables, and fish was negatively correlated with obesity and neutral fat in blood, thereby lowering the risk of metabolic syndrome. The characteristics of balanced healthy diet referred to in the study of Williams et al. 30 are similar to those of Korean food. This is also confirmed in the results of this study that a healthy Korean diet can decrease the risk of metabolic syndrome, obesity, abdominal obesity, and hypertension.
In this study, the term “Korean diet” was expanded to include the concept of a “table setting” containing seasoned vegetables, grilled dishes, braised and glazed dishes, soybean products, and side dishes rather than being limited to individual dishes, such as cooked rice, soup, and kimchi. Through the development and application of this novel dietary index, as well as its relationship with disease risk, we have provided scientific evidence for the health-promoting efficacy of the Korean diet. This study does have some limitations. In particular, it was not possible to detect diseases that occurred rarely and we could not assess causal factors. However, as the sample size of KNHANES is extremely large, our sample size is powerful and our findings are significant. Future research should further investigate the relationship between I-KDPS and chronic diseases, preferably using a cohort study or clinical research design, as this would provide more information to support our thesis.
The I-KDPS applied in this study was suitable for evaluating the dietary pattern of Koreans, intake levels of Korean food, and current dietary patterns in Korea and was also an effective tool for assessing the relationship between the Korean diet and health. A central concept in Korean cuisine is that of Yaksikdongwon (medicine and food have the same root). Maintaining a balanced traditional Korean diet is the easiest way to follow Korean cultural traditions and lead a healthy life. Therefore, the findings of this study may lay a foundation in preparing a Korean food policy or a nutritional education guide as well as serve as evidence to support the health promoting benefits of Korean food.
Footnotes
Acknowledgment
This research was supported by the Globalization of Korean Foods R&D program, funded by the Ministry of Food, Agriculture, Forestry and Fisheries, Republic of Korea (911046-1).
Author Disclosure Statement
The authors declare that there are no conflicts of interest.