
Abstract
We examined whether the incorporation of green tea extract enriched rye bread (GTRB) into the diet can improve weight loss (WL) maintenance and control of abnormalities linked to metabolic syndrome (MS). A total of 55 obese men and women (mean age: 53.0±7.0 years, body mass index: 35.0±5.5 kg m−2) were recruited. The study had a single-blind randomized study design and consisted of an 8-week WL phase with low-energy calorie diet, followed by a 12-week weight maintenance (WM) phase. During the WM phase, the subjects were randomized into two groups, receiving either the control rye bread (control group) or the GTRB (intervention group). The ingestion of 280 and 360 g GTRB provided daily totals of 123.2 and 158.4 mg caffeine, and 188.3 and 242.1 mg of epigallocatechin gallate, for women and men, respectively. After the WL phase, subjects lost 7.3±3.1 kg of their baseline body weight. GTRB intake did not significantly influence the maintenance of WL, high-density lipoprotein-cholesterol, triglycerides, and glucose concentrations. Although, it resulted in significant differences (mean difference [95% confidence interval]) between the treatment groups in the maintenance of waist circumference (−1.22 cm [−2.4, −0.02; P=.04]), the results were not clinically meaningful. Nevertheless, the ingestion of GTRB led to the maintenance of lower blood pressure (BP), also the proportion of subjects fulfilling the criteria of MS after the WM phase was lower in the intervention group than in the control group. Although GTRB consumption did not improve significantly the WL maintenance, it resulted in a better control of BP.
Introduction
O
Materials and Methods
Subjects
A total of 66 obese men and women aged from 49 to 65 years and with body mass index (BMI, kg m2) between 30.0 and 49.9 were recruited into the study through mailed letters and advertisements in health magazines and outpatient clinics. They underwent a medical screening. Patients were excluded if they had a history of hepatic, thyroid, or gastrointestinal diseases, cancer, or allergies. Other exclusion criteria were a history or presence of substance abuse, eating disorders, excessive alcohol intake, being a smoker, significantly abnormal blood pressure (BP) results: a systolic BP (SBP) ≥180 mmHg and/or a diastolic BP (DBP) ≥110 mmHg, and previous gastrointestinal surgery for weight reduction. In addition, patients were excluded if they showed a dietary restraint (DR) score >14 (description of the method—please see section “Attitude toward eating”), if they ingested more than 100 mg CAF per day (from coffee, tea, chocolate, cola, or energy drinks), or if they habitually drank GT. Subjects must not have taken any medications or supplements known to influence BW during the 12 weeks before screening. All vitamin and mineral supplements previously taken were discontinued. Selection resulted in 55 subjects. They all gave their written informed consent. The study protocol was approved by the local bioethics committee of the Institutional Review Board at Poznań University of Medical Sciences, Poland (approval number 321/08). During the first 4 weeks (during the WL phase), 11 subjects dropped out of the study for various reasons: moving house, changing jobs, an inability to cope with the hypocaloric diet, or an inability to continue the schedule of visits to the university. Finally, 44 subjects completed the study. Figure 1 presents the design of the study and the assignment of the subjects.
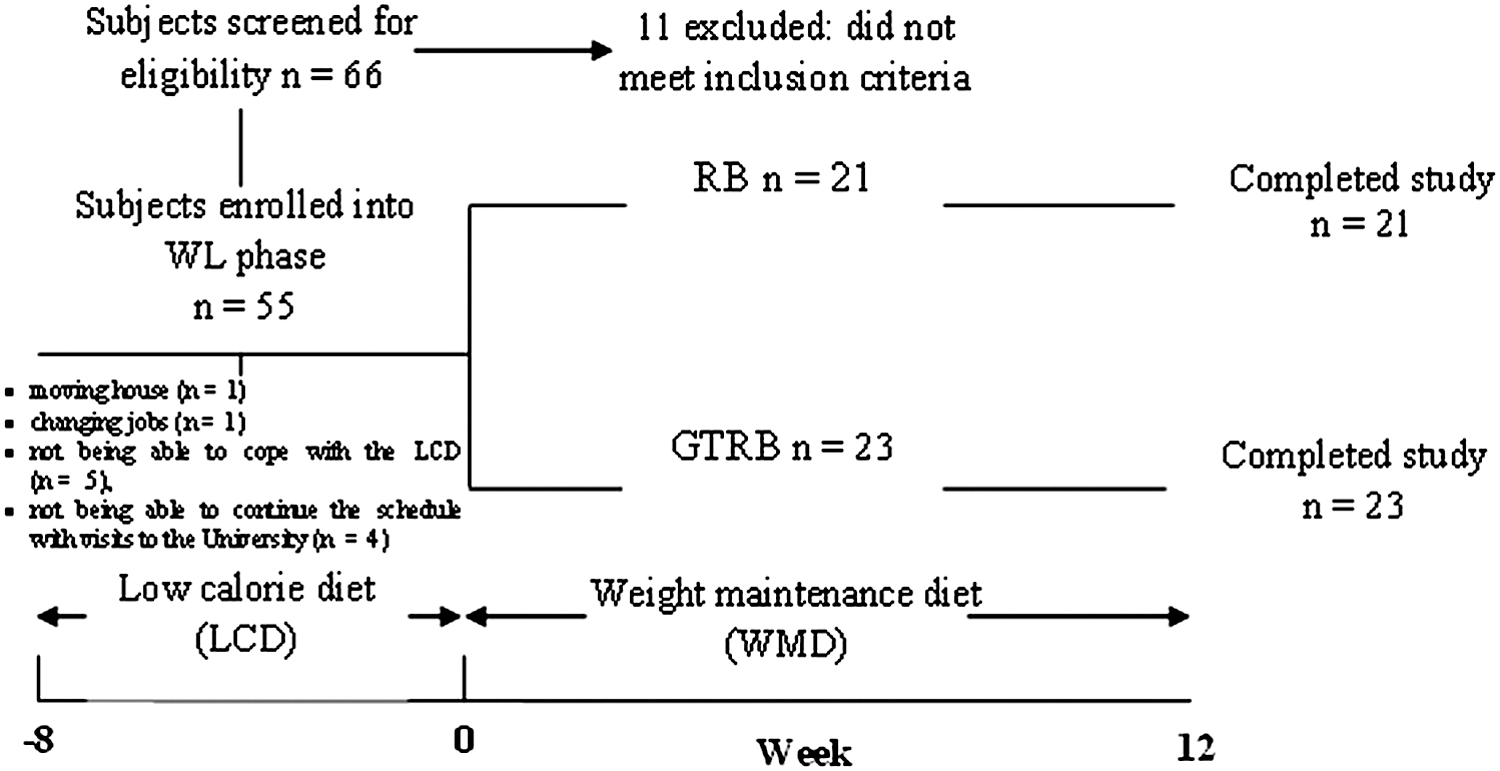
Study design and assignment of subjects. RB, rye bread (control group); GTRB, green tea enriched rye bread (study group).
Study design
During the first 8 weeks of the study, subjects underwent a WL involving a balanced low-calorie diet (prepared and controlled by the dietitian) at this time. This diet was designed to provide 600–700 kcal day−1 (2.5–2.9 MJ day−1) less than the individually estimated daily energy expenditure. Next, patients underwent a WM phase, which was initiated immediately upon completion of the WL phase. During the WM phase, the energy intakes in both the groups increased, but remained below the baseline energy intake. During this WM phase, the subjects were randomized into two groups, receiving either the control RB (control group) or the GTRB (intervention group) for a period of 12 weeks. The RB was enriched with 1.1% of GTE and such level of GTE used to fortify the RB was chosen on the basis of earlier sensory evaluation. 13 The GTRB was similar in appearance to the plain RB. The breads were coded to ensure blinding of conditions. The patients were encouraged to increase their daily physical activity (e.g., by walking briskly for 20–30 min, five times a week) throughout both phases of the study.
Diet components
All subjects consumed a daily portion of bread: 280 g for women, and 360 g for men (as 40 g slices), as a part of their WM diet. The bread was eaten instead of the patients' usual breads and other wholegrain products (such as porridge) at four meals (breakfast, two snacks, and lunch). Pasta, potatoes, and rice could be eaten as part of warm dishes (as dinner) in the amounts described by the dietitian. The daily portion of both experimental breads meets the requirements for the intake of bread in the daily food rations for women and men aged 25–60 years. 14 The energy and macronutrient content in both kinds of experimental breads was similar. The ingestion of the daily portion of GTRB provided daily totals of 3.3 and 4.25 MJ of energy, 28.0 and 36.0 g dietary fiber as well as 123.2 and 158.4 mg CAF, and 188.3 and 242.1 mg epigallocatechin gallate (EGCG), for women and men, respectively. 13 The subjects were instructed not to eat any other type of bread, and not to replace the experimental bread with other wholegrain products, such as bran flakes. Additionally, during both phases, subjects were permitted to avoid drinking GT and all other products containing CAF (including bars, other kinds of teas, energy drinks, and cola drinks). Compliance was evaluated through feedback from each participant during their scheduled visits to the Department of Human Nutrition and Hygiene for dietary assessment and nutritional status evaluation and bread collection. All subjects were encouraged to inform the staff of any problems or discomfort relating to the consumption of the RB. To avoid bias, during both phases, dietitian formulated menu plans with home-prepared recipes and meal instructions. Supporting materials were provided to facilitate adherence, including frozen meal options, food brand options, meal preparing tools, and shopping lists. Both diets contained 25% of energy as fat, 55% as carbohydrate, and 20% as protein.
RB preparation
The RB used for the study was a noncommercial product provided by Fawor Bakery (Poznan, Poland). The RB was prepared using a two-phase method (with sourdough), containing either 0% (control RB) or 1.1% GTE per 100 g flour (GTRB), according to the procedure described by Bajerska et al. 13 Energy value (MJ), protein (g), fat (g), total dietary fiber (g), and insoluble and soluble dietary fiber (g) content per 100 g experimental breads were 1.18±0.02, 5.6±0.1, 0.1±0.01, 10.0±0.3, 6.8±0.2, and 3.2±0.06, respectively.
Dietary assessment
Patients completed a 3-day food record for 2 weekdays and 1 weekend day at baseline, and after the WL phase, and again after the WM phase. The portion sizes of dishes and food products were estimated based on a standard Polish photographic album of food products and dishes. 15 The energy of individual diets was calculated using the Dietetyk computer program (Jumar, Poznań, Poland). Assessment of dietary adherence to the dietary intervention by comparing the actual energy intake (on the basis of a 3-day food record measurement) with prescribed energy value of the individual daily food rations after WL and WM phase was done. In addition, the subjects' baseline CAF intake was estimated by a food history questionnaire.
Anthropometric and BP measurements
The height of the subjects was measured using an anthropometer (model WPT 200.0; Radwag, Poznań, Poland) at the time of entry into the study. BW, waist circumference (WC), and fat mass (FM) at the beginning and end of the WL phase, and again following the WM phase, in the morning, in the fasting state were measured. BW was measured with an electronic scale (model WPT 200.0; Radwag, Poznań, Poland) to an accuracy of 0.1 kg, in the morning before breakfast and after defecation, in subjects dressed in their underwear only. WCs were measured 3 times at the site of the shortest circumference between the rib cage and the ileac crest, using a non-stretch metric tape, and with subjects in standing position. All the circumference measures were recorded to the nearest 0.1 cm. Body composition in terms of adipose tissue (FM) was determined immediately after BW measurements with the bioelectric impedance technique using analyzer Akern-RJL BIA, 101/S, Data Input, Frankfurt, Germany, according to the recommendations of Lukaski et al. 16 To avoid subjective error, all measurements were performed by the same highly qualified person. Resting seated BP was measured three times, at baseline, before, and after the WM phase, according to guidelines of the European Society of Hypertension. 17 Regular or large adult cuffs were used, depending on the arm circumference of each patient.
Blood parameter analysis and diagnosis of MS
Standard colorimetric methods were employed to determine the amounts of high-density lipoprotein cholesterol (HDL-C) and triacylglycerol (TG) in plasma using an Olympus AU560 analyzer. Fasting blood glucose (BG) concentrations were measured using the hexokinase method. 18 MS was diagnosed according to the IDF criteria. 19
Assessment of resting metabolic rate and respiratory quotient
Resting metabolic rate (RMR) and respiratory quotient (RQ) were measured using breath-by-breath metabolic measurements with Cosmed K4b 2 (cosmed, S.r.L., Rome, Italy) portable metabolic assessment equipment.
Attitude toward eating
To determine whether the subjects' attitudes toward food intake changed at any point during the experiment, the three-factor eating questionnaire was used. 20 In the present study, only DR factor was analyzed.
Statistical analysis
Data are presented as means (standard deviation), unless otherwise noted. Skewed data were log transformed when appropriate for further statistical analysis. Paired t-test analysis was used to examine the differences in the group mean for anthropometric parameters and biomedical variables, at baseline versus the WL phase, and at baseline versus the WM phase. The group differences were estimated using the analysis of covariance, with the measurements taken after the WM phase as the dependent variables. The corresponding measurement following the WL phase (before randomization) was used as a covariate. All results were expressed as means with 95% confidence intervals for the difference (against the control group). The Z test was used to analyze differences in the frequency distributions in MS in our study population. P values less than .05 were considered significant. The effects of group, time, and group×time interactions on the variable describing eating control (DR) were considered with the use of analysis of variance, using data from, before, and after the WL, and after the WM phase. P<.05 was taken as the level of statistical significance. All data were analyzed using the Statistica Software (version 8.0; Statsoft, Inc., Tulsa, OK, USA).
Results
The mean age of the subjects participating in our study was 53.0±7.0 years, and the mean BMI was 35.0±5.5 kg m2. The mean DR score was 7.4±2.2. The BW, FM, and indicators for the MS before and after the WL phase, as well as after the WM phase, are presented in Table 1.
Values are expressed as a mean with standard deviations.
Only those who completed the WM phase. The RB group (n=21, 12 female, 9 male) during WM phase received the control bread RB, the GTRB group (n=23, 15 female, 8 male) during WM received the RB enriched with GTE, baseline the time before weight reduction. WL indicates the time after weight reduction, WM indicates the time after weight-maintenance phase.
Mean value was significantly different to that at baseline (P<.05).
Mean value was significantly different to that at baseline (P<.01).
Mean difference (95% CI) from the control group adjusted for the measurement at the start of WM phase.
P-value for group differences.
BW, body weight; FM, fat mass; SBP, systolic blood pressure; DBP, diastolic blood pressure; BG, blood glucose; HDL-C, high-density lipoprotein-cholesterol; TG, triglyceride.
During the WL phase, subjects from both experimental groups lost a significant amount of their original BW (7.3±3.1 kg, or 7.6±3.5%; P<.01). Also the other anthropometric variables (FM and WC) were reduced significantly (P<.01) on completion of the WL phase, as compared with the baseline levels. After the WM phase, the mean BW increased by 1.5 kg in the RB group, and 0.6 kg in GTRB group (however this parameter in both groups was still significantly lower (P<.01) than at the beginning of the WL phase). After WM phase, WC and FM in both experimental groups increased, however, mean values of those parameters were still significantly lower (P<.01), as compared to the baseline. The contrast tests showed that only the GTRB group had gained significantly less in WC (−1.22 cm [−2.4, −0.02; P=.04]) than the RB group.
In both experimental groups the values of SBP and DBP and BG reduced significantly (P<.01) after the WL phase, whereas, HDL-C and TG levels remained unchanged (Table 1). At the end of the WM phase, the values of SBP and DBP in both groups had increased. However, only in the GTRB group, the values of these parameters were still significantly lower (P<.01), as compared to the baseline. At the end of the WM phase, the SBP and DBP changes were significantly smaller in the GTRB group than in the RB group (SBP: −4.6 mmHg [−9.06, −0.15; P=.04]) and (DBP: −3.8 mmHg [−6.66, −0.89; P=.01]). After the WM phase, BG levels in both groups reversed, although in the GTRB group, its concentration was still significantly lower (P<.05), as compared with the baseline (Table 1). At the end of the WM phase, in the RB group, HDL-C levels were unchanged, whereas in the GTRB group this parameter favorably increased (P<.01) compared with the baseline.
Before the WL phase, the number of subjects with at least three pathological characteristics for the MS was 15 and 14, in the group that received the RB and the GTRB, respectively (Table 2). After the WL phase, the number of such subjects in both experimental groups decreased to 9 and 8, respectively. After the WM phase, the number of subjects with at least three pathological MS characteristics in the RB group was the same as before the WL phase, and significantly (P<.05) higher than in the GTRB group.
RB, rye bread (control group); GTRB, green tea enriched rye bread (study group).
Only those who completed the WM phase.
Significantly different from RB (P<.05).
The DR scores showed a similar pattern in both groups (group×time interaction, P=.85). The mean score of DR in both experimental groups increased significantly (P<.05), from 9.0 (7.9, 10.2) in the RB group and 8.8 (7.8, 9.8) in the GTRB group before the WL phase, to 13.9 (11.8, 15.9) and 13.3 (11.1, 15.3) in the RB and GTRB group, respectively after WL phase. The mean score of the DR slightly decreased after the WM phase to 12.5 (10.2, 14.8) and 12.9 (11.0, 14.9) for the RB and the GTRB group, respectively, but only in the GTRB group this parameter was still significantly higher (P<.05) as compared with the baseline (Fig. 2).
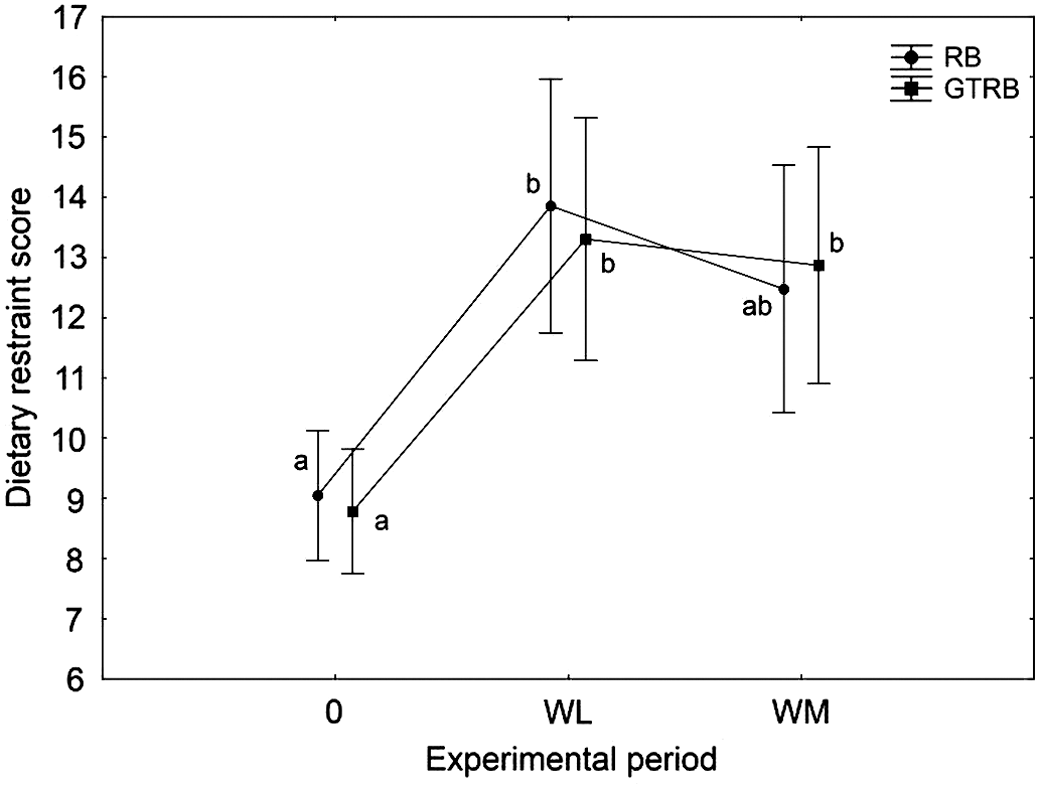
The mean dietary restraint score throughout the experiment phases. RB, rye bread (control group); GTRB, green tea enriched rye bread (study group). Values with different superscript letters are significantly different (P<.05).
In both groups, the RMR decreased after the WL phase, however only in the RB group significant changes (P<.05) were observed. Also RQ decreased (but nonsignificantly) during the WL phase in both experimental groups, indicating increased fat oxidation. At the end of the WM phase, RQ had slightly increased in the RB group, whereas minor changes observed in the GTRB group resulted in significant differences (P<.05) in comparison to the baseline (Table 3).
Values are expressed as a mean with standard deviations.
Only those who completed the WM phase, the RB group (n=21; 12 female, 9 male) during WM phase received the control RB; the GTRB group (n=23; 15 female, 8 male) during WM phase received the RB enriched with GTE, baseline the time before weight reduction; WL indicates the time after weight reduction; WM indicates the time after weight-maintenance phase.
Mean value was significantly different to that at baseline (P<.05, Student's t-test).
Mean difference (95% confidence interval) from the control group, adjusted for the measurement at the start of WM phase, using analysis of covariance.
P-value for group differences.
RMR, resting metabolic rate; RQ, respiratory quotient.
Dietary adherence to the prescribed diets was similar in each group and for each period of the experiment. Its value ranged from 95.5±7.9% to 105.1±9.8% (Table 4).
Values are expressed as a mean with standard deviations. The RB group (n=21; 12 female, 9 male) during WM phase received the control RB; the GTRB group (n=23; 15 female, 8 male) during WM phase received the RB enriched with GTE, WL indicates the time after weight reduction; WM indicates the time after the weight-maintenance phase.
Discussion
To our knowledge, this is the first study to investigate the effect of 12 weeks of regular consumption of functional food containing GT (enriched RB) on WL maintenance and on control of MS-linked abnormalities in free-living obese subjects who have undergone energy-restricted WL therapy. Our study results show that the daily consumption of ≥280 g of GTRB, eaten in place of the usually consumed breads and other wholegrain products as part of a WM diet, did not improve WL maintenance or HDL-C, TG, and BG concentrations better than the plain RB, following a 7.6% loss in BW. Although, consumption of this functional bread resulted in significantly lower gain in WC, the results were not clinically meaningful. Nevertheless, the ingestion of GTRB led to the maintenance of lower BP, also the number of patients fulfilling the criteria of MS tended to be lower after the WM phase in the group that received the GTRB, as compared with the control bread.
There are strong evidences that the supplementation of EGCG (270 mg) and CAF (150 mg) can significantly improve WM following WL therapy, although low habitual CAF intake (<300 mg day−1) is obligatory. 21,22 Hursel et al. explained that habitually low CAF consumers react more sensitively to the active components of GT. 22 This is in agreement with the studies conducted by Nakagawa et al. where it was shown that when EGCG and CAF are coadministered to humans, higher amounts of CAF (180 mg) in relation to the EGCG content (95 mg) tended to affect the absorption and metabolism of EGCG by suppressing both conjugation reactions (glucuronidation and sulfation) and the intestinal absorption of EGCG. 23 In line with this, the subjects enrolled in our study were low-CAF consumers and, in both experimental phases, they were requested to avoid the intake of GT beverages and of any other product containing CAF. It should be noted that the EGCG and CAF intake in our trial was similar to those used in the study conducted by Westerterp-Plantenga et al. 21 However, we observed that consumption of GTRB did not improve WL maintenance as well as HDL-C, TG, and BG concentrations better than the plain RB. Additionally, the between group difference in WC although significant was minimal (1.2 cm) and not considered as clinically meaningful. This minimal impact of GTRB consumption on the improvement in maintenance of body weight loss, WC, as well as HDL-C, TG, and BG concentration after weight loss therapy may have several possible explanations. Westerterp-Plantenga et al. in their previous study concluded that thermogenesis must have contributed to improved WL maintenance in the group receiving an encapsulated GTE. 21 However, a slight increase in RMR observed in our intervention group (despite the fact that the BW gain in this group was 0.6 kg, whereas in the control group was 1.5 kg) could not assist WL maintenance. In line with this, it can be speculated that the physiological effects of GT components are closely linked to their bioavailability from the food matrix (e.g., from bread formula), probably due to the strong interaction of these compounds with the processed food components (starch, protein). 24 It was proposed that the administration of polyphenols without a food matrix could markedly affect their bioavailability. 25 With regard to flavonols, much higher plasma concentrations were achieved when quercetin glucosides were administered to fasted volunteers in the form of a water–alcohol solution than when an equivalent quantity was ingested with foods such as onions, apples, or a complex meal. 25 On the other hand Schramm et al. demonstrated the ability of carbohydrates, in the form of white bread and sucrose, to enhance epicatechin bioavailability in humans, but, in general, the evidence on the importance of food matrix on the bioavailability of the GT components are lacking. 26
It seems that higher doses of both EGCG and CAF incorporated into the diet can be considered as a benefit in WM following WL therapy. However, in a study conducted by Kovacs et al. 27 it was demonstrated that the incorporation into the diet, even higher (than observed in our study) amounts of EGCG (323 mg day−1) and CAF (104 mg day−1), did not improve WM following a 7.5% loss in body weight, compared with placebo in originally overweight and moderately obese men and women. 28 Moreover, it should be noted that a higher dose of GT extract added to RB formula was associated with worsened quality and acceptability of this experimental bread. 12
In the current study, we found better BP maintenance in the group that received GTRB than in the control group following WL therapy. Available data suggest that improvements in BP would have a significant impact on mortality from heart and cerebrovascular diseases. A population-wide reduction of 5.5 mmHg systolic or 3.0 mmHg diastolic would result in an estimated 15% decline in incident coronary heart disease and a 27% decline in stroke.
29
The hypotensive effect of the GTRB found in our study has previously been observed by Bogdanski et al.
28
and Brown et al.
30
in patients with obesity-related hypertension supplemented with the encapsulated GT extract. However, the GT extract used in both studies was decaffeinated. As GT also contains xanthic bases (CAF and theophylline), the blood pressure-lowering effect of GT is still controversial.
28,30
However, Yang et al. have indicated that the habitual consumption of moderate-strength green or oolong tea (120 mL day−1 or more for 1 year), significantly reduces the risk of developing hypertension in the Chinese population.
31
Also, in a Norwegian cross-sectional study, it was shown that the adjusted mean SBP decreased with increasing tea consumption, with a significant linear trend showing a difference of 2.1 and 3.5 mmHg (respectively in men and women) between those who did not drink tea and those who drank more than five cups daily.
32
Yang et al. explained that the hypotensive effect of GT may be due to its theanine content, which is known to reduce BP in spontaneously hypertensive rats.
31
It is known that stress can elevate BP by stimulating the nervous system to produce large amounts of vasoconstricting hormones, which increase BP.
We observed additionally that the proportion of subjects fulfilling the criteria of the MS tended to remain lower during the WM phase in the study group compared with the control group. Therefore, our findings on the MS, which is a cluster of risk factors for atherosclerosis and insulin resistance, can be considered as crucial even during partly unsuccessful WM.
A central issue in the effectiveness of dietary intervention program is adherence, which is known to be a problem particularly in long-term intervention and among obese subjects. 3 We attempted to improve adherence to the prescribed diet through supervision by a dietitian. Dietary adherence to the prescribed diets was good, and was similar between the groups in each period of the experiment (its value ranged from 95.5±7.9% to 105.1±9.8%). Additionally, it should be noted that subjects from both groups showed similar cognitive patterns, following the WL and WM. Therefore, this parameter is unlikely to be related to greater SBP or DBP maintained or to the lower proportion of subjects fulfilling the criteria of MS after WL in the group receiving GTRB.
Some limitations of this study can be identified. First, the sample was of small size and involved a high ratio of female to male participants. These factors limit its generalizability to a larger population. Second, the treatment period was not sufficiently long, in particular, considering that after the WM period, the subjects from both experimental groups were still highly cognitively restrained eaters. Therefore, the consumption of GTRB needs to be longer, before conclusive clinically important effects on weight, FM, WC, and MS components can be inferred. However, having in mind the documented differences, one could imply even more beneficial results. Moreover, although the daily portions of breads consumed in our study were higher than the amount currently consumed in Poland (due to the increased consumption of other cereal products, such as corn and bran, breakfast cereals, etc.), our results show that such functional bread can easily be adopted into the daily diet in relatively large amounts.
Conclusions
In summary, adding ≥280 g GTRB to a WM diet did not result in better WL maintenance than in the case of plain RB. Nevertheless, the favorable changes in BP parameters indicate that the inclusion GTRB into the diet may contribute to preventing future clustering of MS risk factors after completion of WL. Therefore, this form of functional food offers a practical dietary means to improve the metabolic disorders associated with obesity.
Footnotes
Acknowledgment
This work was supported by a grant from the Polish Ministry of Sciences and Higher Education (NN312331635).
Author Disclosure Statement
The authors declare that there are no financial conflicts of interest.