
Abstract
The hypothesis of this study was that peanut sprout extracts (PSE) could reduce fat accumulation through activating the transcription of SREBP-1c genes. Sprague–Dawley (SD) were randomly assigned into two groups and fed the following diet for 4 weeks; 10 normal fat (NF, 7 g of fat/100 g diet) and 30 high fat (HF, 20 g of fat/100 g diet). After 4 weeks, the HF group was divided into three groups; HF, HF with 15 mg of PSE/kg diet (HF+low PSE, 0.025% resveratrol), and HF with 30 mg of PSE/kg diet (HF+high PSE, 0.05% resveratrol) and fed for an additional 5 weeks. The HF+high PSE group had significantly lower weight gain than the HF group. Plasma triglyceride (TG) level and the hepatic total lipid level were significantly lower in the HF+high PSE group compared to the HF group. Fecal excretions of total lipids, cholesterol, and TG in the HF+high PSE group tended to be higher than in the HF group, but these differences were not significant. The mRNA expressions of fatty acid synthase, glucose-6-phosphate dehydrogenase, and sterol regulatory element binding protein-c (SREBP-1c) were significantly lower in the HF+high PSE group than in the HF group. The mRNA expressions of hydroxy-3-methylglutaryl coenzyme A reductase and acyl-CoA cholesterol acyltransferase were significantly lower in the HF+high PSE groups compared to the HF group. The mRNA expression of cholesterol 7α-hydroxylase1 was significantly higher than the HF group in both the HF+low PSE and HF+high PSE groups, with much greater increase observed in the HF+high PSE group. In conclusion, consumption of PSE was effective for improving blood lipid levels, possibly by suppressing the expression of SREBP-1c, in rats fed a high-fat diet.
Introduction
P
Because of the abundance of resveratrol, some researchers have begun to observe the benefits of peanut sprouts for health. Earlier studies focused on the nutritional analysis, antioxidant activity, or toxicity of peanut sprouts. 1 –4 A recent study showed that peanut sprout extract (PSE) had a potent cytoprotective activity against UVB-induced oxidative stress in human dermal fibroblasts. 5 PSE showed a laxative effect in a constipation-induced rat model. 6 Only a few studies have reported the antiobesity effects of peanut sprouts, 7,8 although many studies have suggested the antiobesity or antilipidemic actions of resveratrol. 9 –13
Lipid biosynthesis usually occurs in hepatic tissue and typically involves the following lipogenic enzymes: acetyl-CoA carboxylase (ACC), fatty acid synthase (FAS), glucose-6-phosphate dehydrogenase (G6PDH), and malic enzyme (ME). 14 ACC is involved in the production of malonyl-CoA, while FAS is an enzyme that elongates the carbon chain in fatty acids. G6PDH and ME produce NADPH and provide the necessary reducing equivalents during fatty acid synthesis. 14 Sterol regulatory element binding protein-c (SREBP-1c) is a transcription factor that regulates gene expression of the enzymes above during lipid biosynthesis. 15
Rate-controlling enzymes involved in cholesterol metabolism include hydroxy-3-methylglutaryl coenzyme A (HMG-CoA) reductase and acyl-CoA cholesterol acyltransferase (ACAT), which regulate the metabolic pathway that produces cholesterol. 16 Two ACAT isoforms (ACAT1 and ACAT2) exist in mammals. The ACAT2 protein is expressed mostly in hepatocytes, whereas the ACAT1 protein is expressed in almost all tissues. 17 ACAT2 facilitates cholesteryl ester incorporation into apolipoprotein and represents the majority of hepatic ACAT activity. 17 Cholesterol 7α-hydroxylase1, also known as cytochrome P450 7A1 (CYP7A1), is the rate-limiting enzyme in the synthesis of bile acid from cholesterol. 18
The result of previous studies of the antiobesity effects of resveratrol leads to the hypothesis that peanut sprout, which contain high resveratrol, may also be effective in suppressing fat accumulation and further deceasing blood lipid levels. The lipid-lowering effect of peanut sprouts and the possible mechanism of action have not been previously studied. Rat models, including Sprague-Dawley (SD) and Wistar rats, are popular strains to study obesity and obesity-related complications as they readily gain weight on high-fat diets. 19 In particular, SD rats fed a high-fat diet (20% kcal% fat) have been studied for obesity-induced complications. 20,21 Therefore, this study was conducted to investigate whether PSE has a protective effect against high-fat-induced lipid and cholesterol metabolisms in SD rats.
Materials and Methods
Preparations of PSE and nutrient contents
Hydroethanolic extracts of PSEs were prepared at and provided by the Chonnam National University, and the detailed study methods for preparing PSE and determining resveratrol content in PSE were described in a previous study. 8 Briefly, dried peanut sprout was steamed and dried to prepare peanut sprout powder. Dried sample was extracted with ethanol (70% water: 30% ethanol v:v) and centrifuged to remove ethanol. Resveratrol contents in the PSE were measured by high-performance liquid chromatography 8 (pump: Jasco PU-98; detector: Jasco UV-975, Jasco, Inc., Tokyo, Japan; column: phenomenex [250×4.6×4 μm] C18, Phenomenex, Inc., Torrance, CA, USA; injected volume:20 μL, detected at 306 nm, flow rate: 0.6 mL/min), and the mean resveratrol content of PSE used in this study was determined to be 38.17 mg/mL.
Animals and study design
Four-week-old SD rats were assigned to two groups; 10 rats fed normal-fat (NF) diets containing 7% fat, and 30 rats fed high-fat (HF) diets containing 20% fat, all according to a randomized block design. All group were fed the same AIN-93G diet (ICN, Irvine, CA, USA), with the only difference being the fat and carbohydrate contents (Table 1). After 4 weeks, the high-fat diet group was divided into three groups; high-fat (HF), high-fat with low levels of PSEs (HF+low PSE), and high-fat with high levels of PSEs (HF+high PSE). All groups were fed for another 5 weeks. The HF+low PSE diet contained 15 mg/kg (0.025% resveratrol), whereas the HF+high PSE contained 30 mg/kg (0.05% resveratrol). Rats were housed individually in stainless steel cages in conditioned rooms (24°C±1°C, 12-h light/12-h dark cycle). Animals were weighted once a week for the entire experimental period. All experiments met the guidelines of the Animal Testing Ethics Committee of Eulji University (EUIACUC 10-09).
NF: normal-fat diets (7% fat diet), HF: high-fat diets (20% fat diet), HF+low PSE: high-fat diets with low peanut sprout extract diet (20% fat and 15 mg/kg peanut sprout extract (0.025% resveratrol), and HF+high PSE: high-fat with high peanut sprout extract diets (20% fat and 30 mg/kg peanut sprout extract (0.05% resveratrol).
Mineral mixture (per kg): calcium carbonate anhydrous, 357 g; potassium phosphate monobasic, 196 g; potassium citrate tripotassium monohydrate, 70.78 g; potassium sulfate sodium chloride, 74 g; magnesium oxide, 24 g; ferric citrate, 6.06 g; zinc carbonate, 1.65 g; sodium metasilicate, 1.45 g; manganese carbonate, 0.63 g; cupric carbonate, 0.30 g; chromium potassium sulfate, 0.275 g; boric acid, 81.5 mg; sodium fluoride, 63.5 mg; nickel carbonate, 31.8 mg; lithium chloride, 17.4 mg; sodium selenate anhydrous, 10.25 mg; potassium iodate, 10.0 mg; ammonium paramolybdate, 6.66 mg; powdered sucrose, 221.026 g.
Vitamin mixture (per kg): nicotinic acid, 3.0 g; ca pantothenate, 1.6 g; pyridoxine HCl 0.7 g; thiamine HCl, 0.6 g; riboflavin 0.6 g; folic acid, 0.2 g; biotin, 0.02 g; vitamin B12, 2.5 g; vitamin E, 15.0 g; vitamin A, 0.8 g; vitamin D3, 0.25 g; vitamin K-1, 0.075 g; powdered sucrose, 974.655 g.
Peanut sprout water extracts: 38.17 mg/mL resveratrol.
Sample preparations
After 9 weeks of feeding, the experimental animals were fasted for 12 h and then anesthetized with ethyl ether. Blood samples were collected from the aorta in test tubes containing sodium heparin and centrifuged for 30 min at 3000 rpm. The separated plasma was stored at −70°C before use. After the wet weights of the livers were measured, the livers were stored at −70°C for further lipid profiles and reverse transcription (RT)-PCR analysis. 22 Stool samples were collected from each rat (over 24 h) at 3 days before scarification and completely dried by heating at 105°C.
Lipid measurements in plasma, liver, and feces
Total lipids were extracted from the liver and feces using the method described by Frings and Dunn 23 with slight modifications. Samples were weighed (150–200 mg) and homogenized in a chloroform–methanol (2:1, v/v) mixture. Homogenates were left for 2 h at 4°C after the addition of 1 g of H2SO4. Water and organic phases were separated and the lower organic phase was evaporated to dryness for total lipid analysis. The dried sample was immediately dissolved in a definite volume of chloroform–methanol (2:1, v/v) plus 5% water for measuring total lipids in samples. Total cholesterol and triacylglycerol were measured enzymatically using a commercial kit (Asan Pharmaceutical Co., Seoul, Korea).
Total RNA isolation
Total liver RNA was isolated using the TRI Reagent (Sigma Aldrich, St. Louis, MO, USA) according to the manufacturer's protocol. 24 Liver samples (0.2 g) were homogenized in 1 mL TRI Reagent and then kept for 5 min at room temperature. The homogenate was mixed with 200 μL chloroform (Sigma Aldrich), shaken vigorously, and then stored for 10 min before centrifugation at 12,000 g for 10 min. After removing the supernatant, 500 μL of isopropanol was added and the mixture was kept at room temperature for another 5 min before a 12,000 g centrifugation for 10 min at 4°C. After removing the supernatant, the RNA pellet was washed with 75% ethanol followed by further centrifugation at 7500 g for 5 min at 4°C. After removing the ethanol wash, samples were dried thoroughly and dissolved in 50 μL RNase-free dH2O with 0.1 mM EDTA through a pipette tip. The purity of each RNA preparation was evaluated by the ratio of the absorbance at 260 nm to that at 280 nm. The final preparation of total RNA had a 260/280 ratio of 1.7–2.0.
Reverse transcription
cDNA was synthesized using 3 μg of total RNA with SuperScript II reverse transcriptase (Invitrogen, Carlsbad, CA, USA). In 1.5-mL tubes, 3 μg of total RNA from the sample and 1 μL of oligo(d)T (0.5 μg/μL; Invitrogen) were combined with diethylpyrocarbonate (DEPC) water to bring the final volume to 12 μL, followed by a 10-min incubation at 70°C. 20 A reaction buffer (5X first standard buffer 4 μL, 0.1 M dithiothreitol 2 μL, 10 mM nucleoside triphosphate 1 μL) was added and the mixture was incubated at 42°C for 5 min. After incubating, 0.5 μL SuperScript II reverse transcriptase (Invitrogen) was added and the mixture was further incubated at 42°C for 100 min followed by 15 min at 70°C. Finally, 80 μL RNase DEPC water was added and the mixture was stored at −20°C until analysis.
Real-time PCR analysis
Real-time detection PCR was performed according to the modified method previously described in detail. 24,25 The prepared cDNA sample, 2 μL, was combined with 10 μL of SYBR Green Master Mix (Applied Biosystems, Carlsbad, CA, USA), 1 μL each of sense/antisense primer (Table 2), and 6 μL DEPC water. Initial activation of the primer at 95°C for 10 min was followed by 40 cycles of 95°C for 15 min and 60°C for 1 min. Expression of mRNA was achieved using an Applied Biosystems StepOnePlus RT-PCR System (Applied Biosystems). Fold difference in gene expression was calculated by 2 −ΔΔCT using the endogenous control gene. The expression of β-actin transcripts was examined as an internal control.
T, Thymine; A, Adenin; C, Cytosine; G, Guanine.
Statistical analysis
The statistical analysis was performed using SAS software (SAS Institute, Cary, NC, USA). Data are expressed as mean with standard error, and statistically significant differences among groups were evaluated using one-way ANOVA. Statistically significant differences among means within groups were tested at P=.05 using Duncan's multiple range tests.
Results
Weight-changes after 9 weeks of experimental diets
After 2 weeks of feeding, there were significant differences in weight between the rats that were fed a NF diet and those fed a HF diet (Fig. 1). At 6 weeks, weight differences between the HF and HF+high PSE groups began to appear. The final weight at 9 weeks was 441.7±16.5 g for the NF group, 485.2±14.9 g for the HF group, 452.9±15.1 g for the HF+low PSE group, and 434.2±13.5 g for the HF+high PSE group. Final body weights were significantly different between HF and HF+high PSE groups.
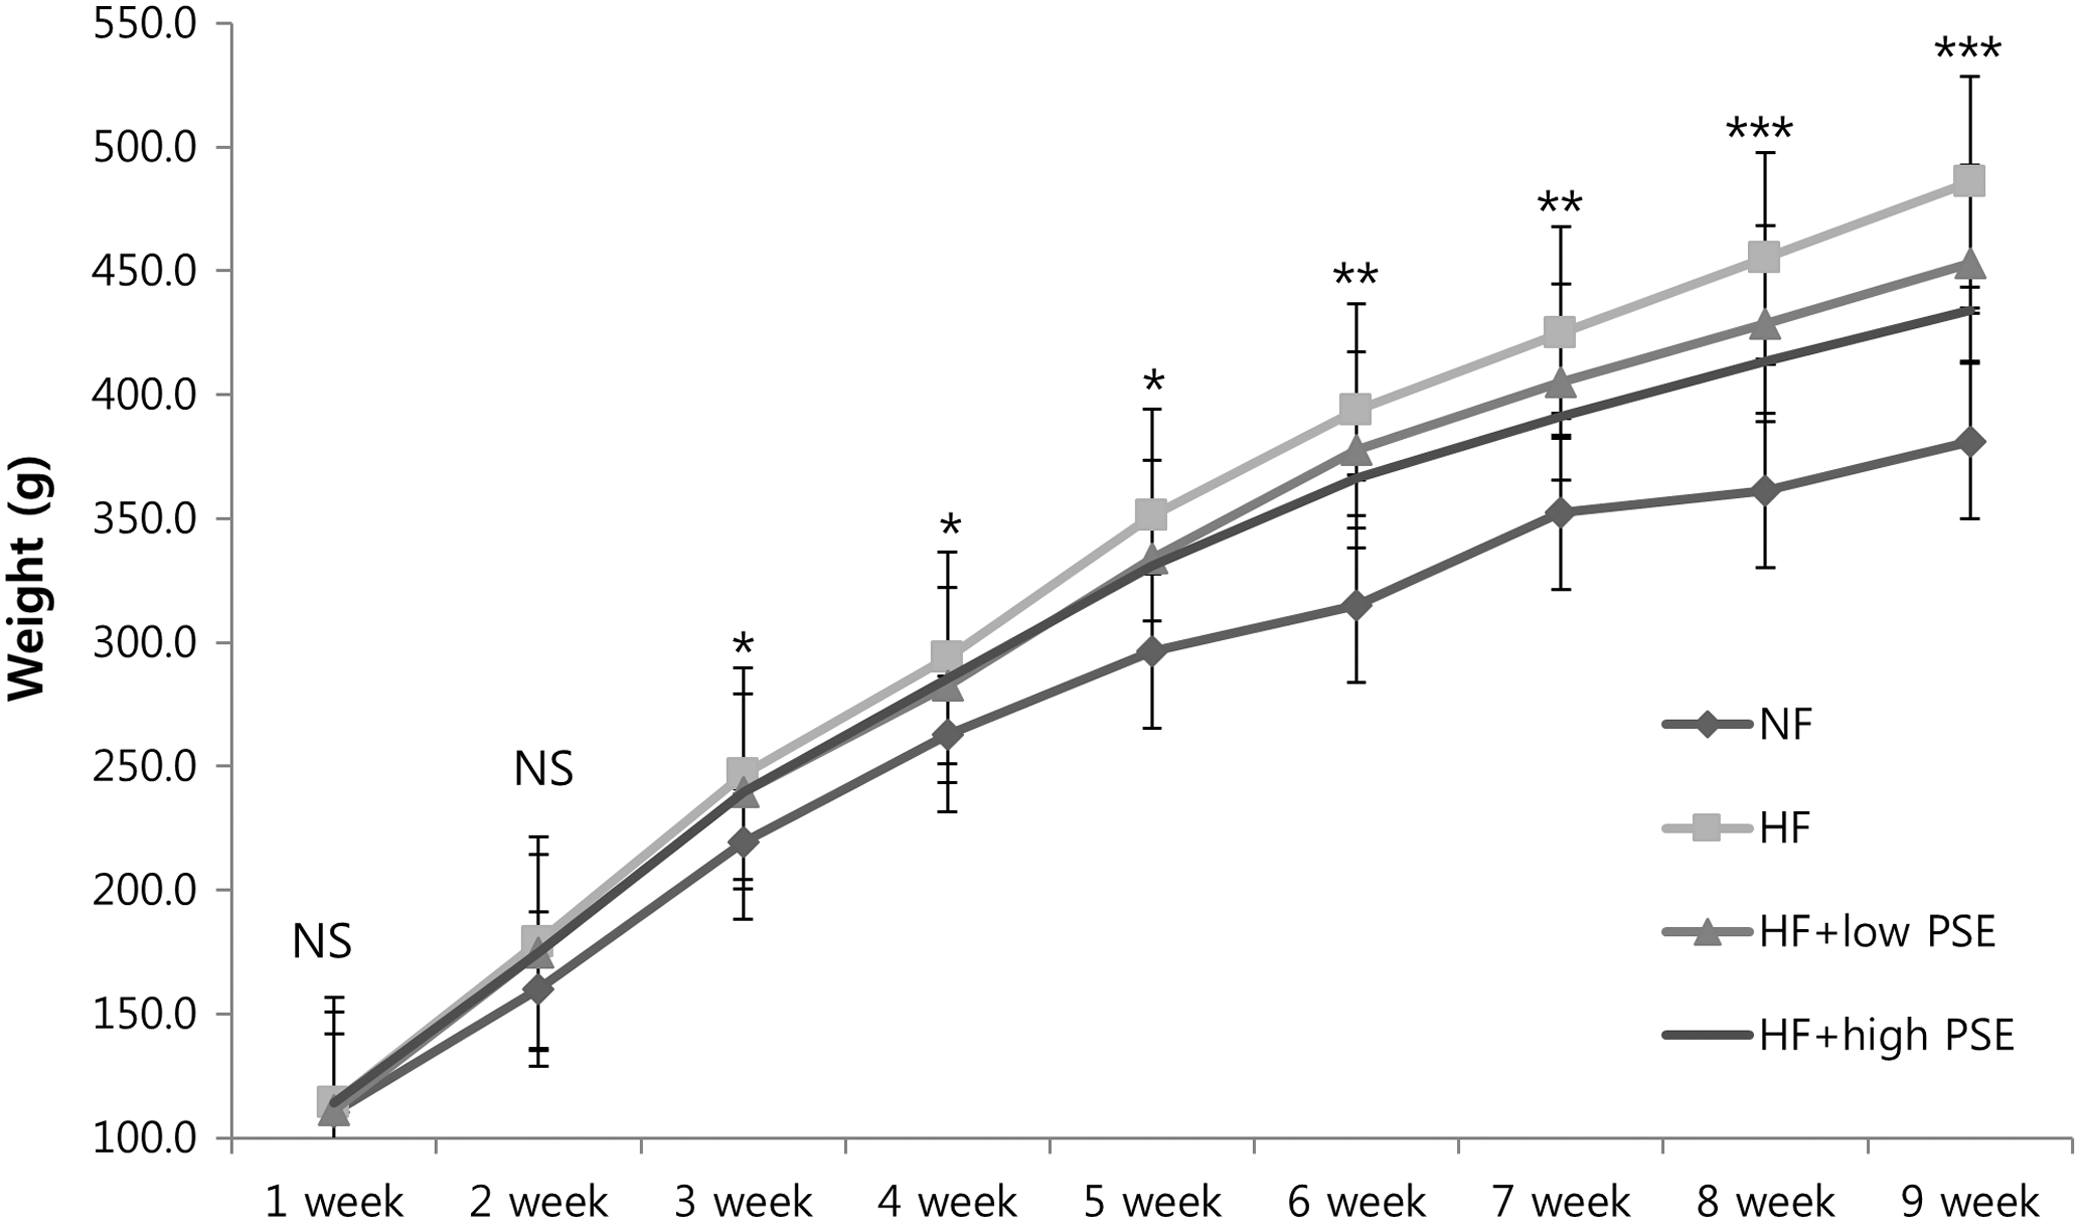
The weight changes after 9 weeks of experimental diets. Each line represents the mean weight±SE of each experimental diet. NF; normal-fat diet, HF; high-fat diet, HF+low PSE; high fat with 15 mg/kg peanut sprout extract, HF+high PSE; high fat with 30 mg/kg peanut sprout extract. Different symbols above the line of each week indicate significant differences among groups at P=.05 as determined by Duncan's multiple range test. NS, not significant differences among groups. *P<.05 between NF and HF, HF+low PSE, or HF+high PSE; **P<.05 between NF and HF, HF+low PSE, or HF+high PSE; P<0.05 between HF and HF+high PSE; ***P<.05 between NF and HF, HF+low PSE, or HF+high PSE; P<.05 between HF and HF+low PSE; and P<.05 between HF and HF+high PSE.
Lipid concentrations in plasma, liver, and feces
Plasma TG was significantly lower in HF+high PSE group compared to the HF group (Table 3). No significant differences in plasma total lipids, cholesterol, or HDL among groups were observed. The hepatic total lipid in the HF+high PSE group was significantly lower compared to the HF group, but the hepatic cholesterol and TG among groups did not differ significantly. Fecal excretions of total lipids, cholesterol, and TG in the HF+high PSE group tended to be higher than the HF group, but no statistical difference between the HF and HF+high PSE groups was observed.
NF: normal-fat diets (7% fat diet), HF: high-fat diets (20% fat diet), HF+low PSE: high-fat diets with low peanut sprout extract diet (20% fat and 15 mg/kg peanut sprout extract, 0.025% resveratrol), and HF+high PSE: high fat with high peanut sprout extract diets (20% fat and 30 mg/kg peanut sprout extract, 0.05% resveratrol).
Mean±SE.
NS, not significant.
Different letters in the same row indicate significant differences among groups at α=0.05 as determined by Duncan's multiple range tests.
mRNA expression of transcription factors related to lipid synthesis and oxidation
The mRNA expressions of hepatic SREBP-1c, FAS, and G6PDH in the HF group were significantly higher compared to the NF group (Fig. 2). The mRNA expressions of hepatic FAS, G6PDH, and SREBP-1c in the HF+high PSE group were significantly decreased compared to the HF group. In case of the HF+low PSE group, G6PDH and SREBP-1c, not FAS, were significantly different. The mRNA expression of carnitine palmitoyltransferase 1 (CPT1) tended to be lower in the HF+low PSE or HF+high PSE group compared to the HF group, but these differences among groups were not significant.

mRNA expressions of transcription factors and enzymes related to lipid synthesis and oxidation in the liver of rats. Total RNA was isolated using TRI-Reagent and cDNA was synthesized using 3 μg of total RNA with SuperScript II reverse transcriptase. Real-time PCR with SYBR Green was performed using standard procedures to assess the mRNA expression of primer in liver samples obtained from each group. The Applied Biosystem StepOne software v2.1 was used. Each bar represents the mean±SE of three independent experiments. Different letters above each bar indicate significant differences among groups at P=.05 as determined by Duncan's multiple range tests. ACC, acetyl-CoA carboxylase; FAS, fatty acid synthase; G6PDH, glucose-6-phosphate dehydrogenase; SREBP-1c, sterol regulatory element binding protein 1-c; CTP1, carnitine palmitoyltransferase-1.
mRNA expression of transcription factors related to cholesterol synthesis
The mRNA expressions of hepatic HMG-CoA reductase and ACAT in the HF group were significantly higher than in the NF group (Fig. 3). The hepatic mRNA expressions of HMG-CoA reductase and ACAT expression were significant lower in the HF+high PSE group, but not in the HF+low PSE group, than in the HF group. The mRNA expressions of low-density lipoprotein receptor (LDL-R) between the HF+low PSE and HF+high PSE groups and the HF group were not statistically different. The mRNA expression of CYP7A1 in the HF group was significantly lower than in the NF group. There were significantly greater mRNA expressions of CYP7A1 in the HF+low PSE and HF+high PSE groups compared to the HF group.
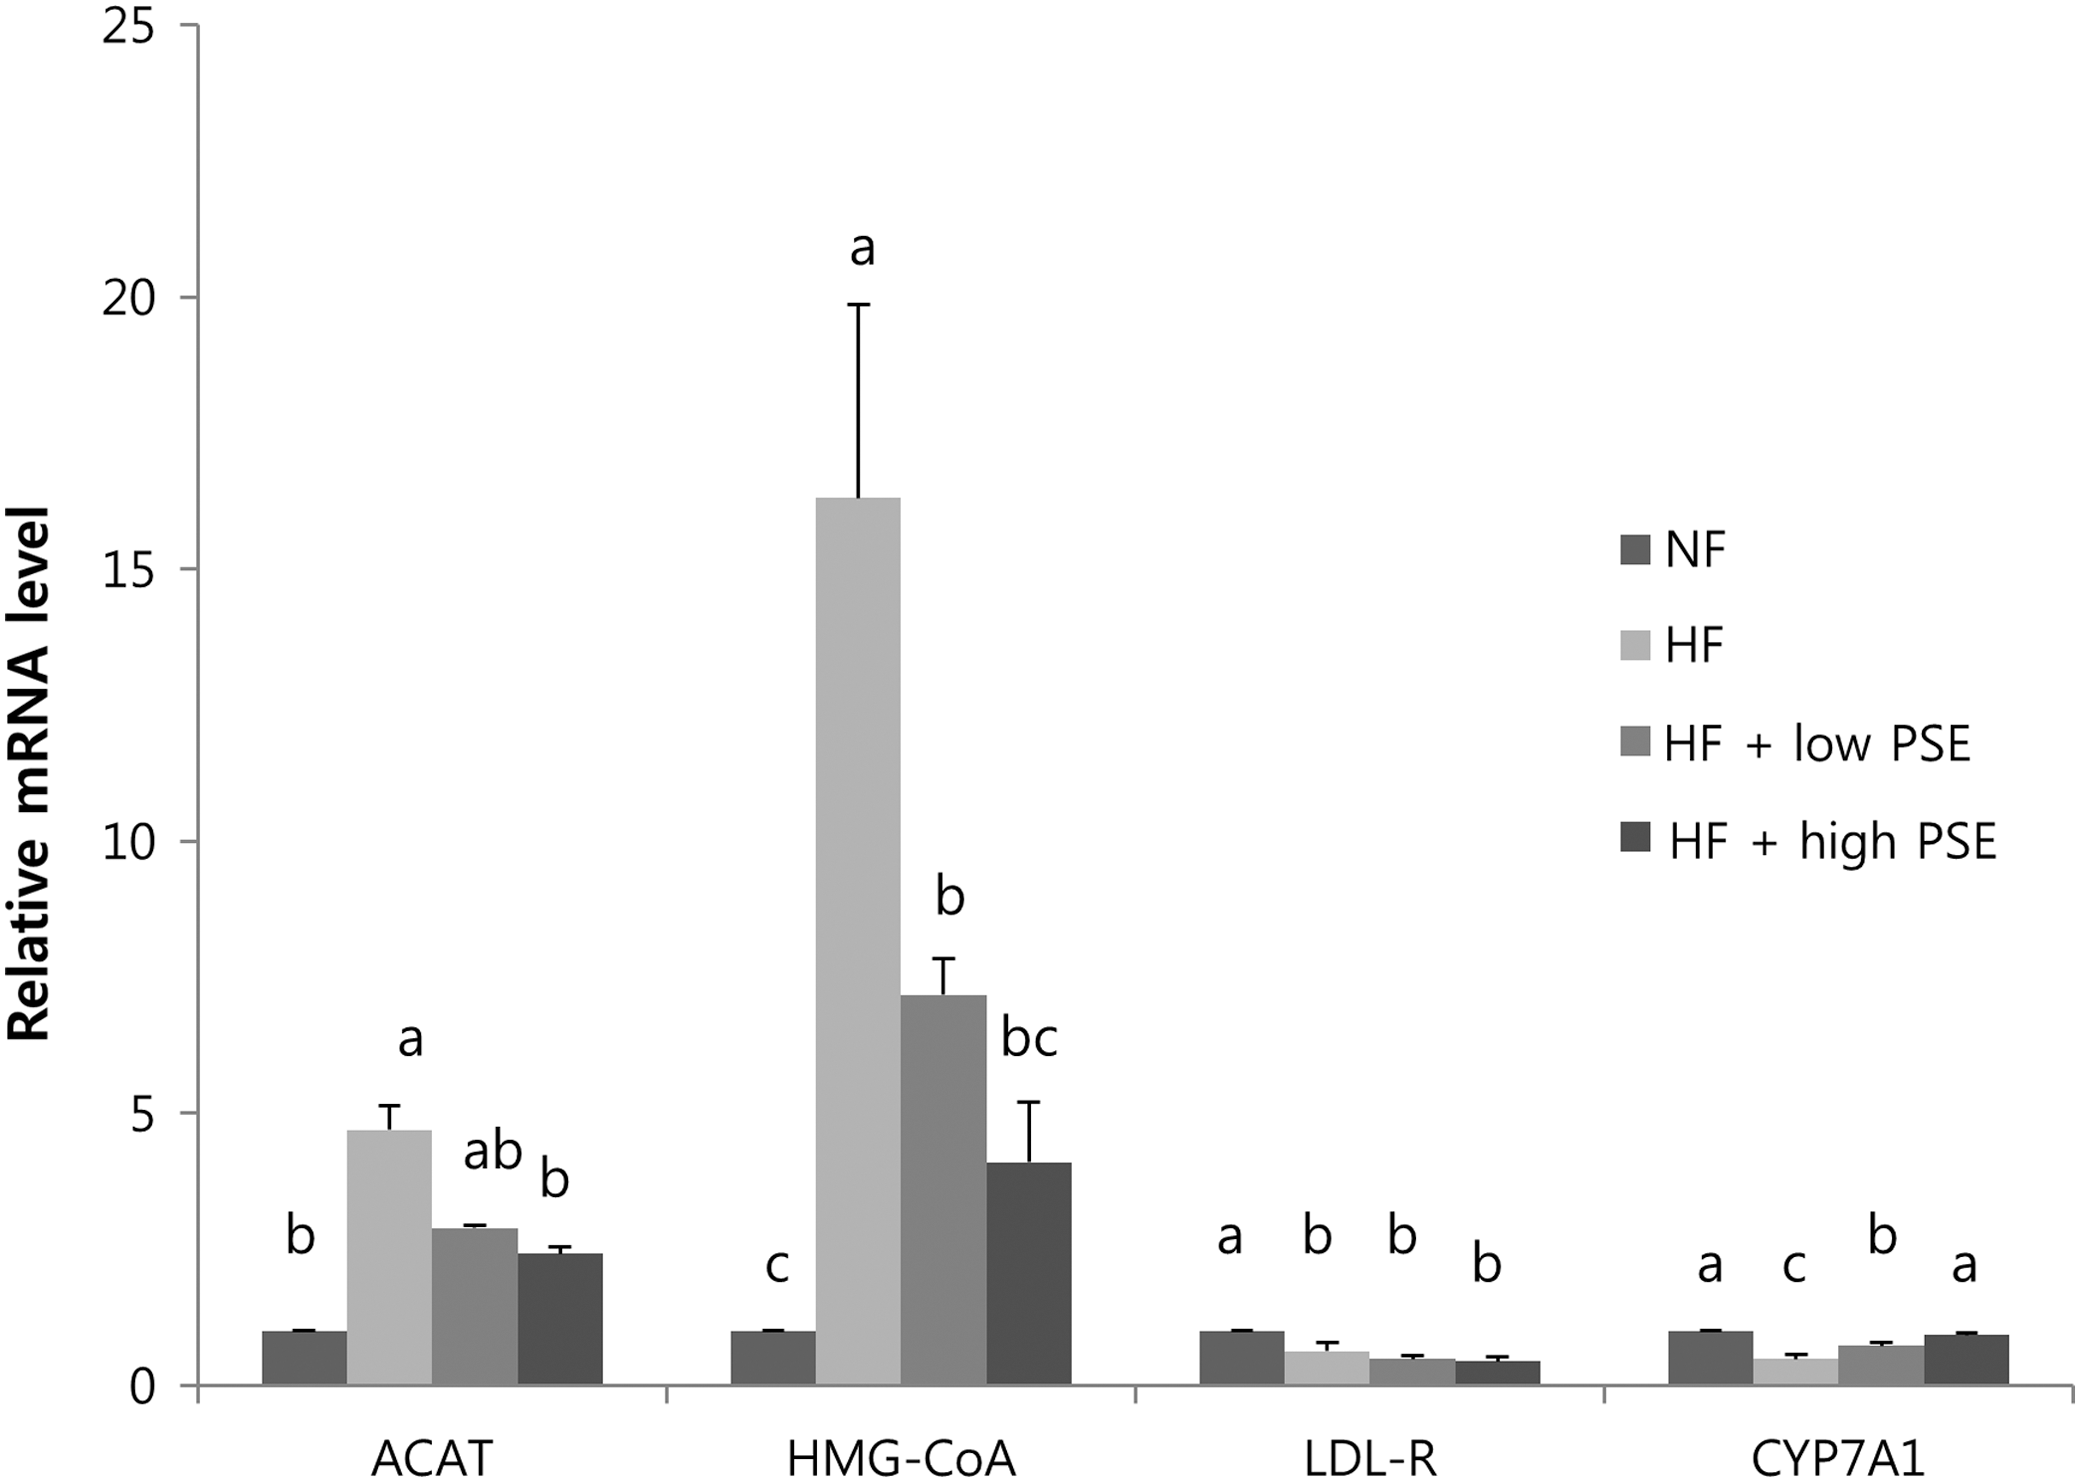
mRNA expressions of enzymes related to cholesterol synthesis and excretion in the liver of rats. Total RNA was isolated using TRI-Reagent and cDNA was synthesized using 3 μg of total RNA with SuperScript II reverse transcriptase. Real-time PCR with SYBR Green was performed using standard procedures to assess the mRNA expression of primer in liver samples obtained from each group. The Applied Biosystem StepOne software v2.1 was used. Each bar represents the mean±SE of three independent experiments. Different letters above each bar indicate significant differences among groups at α=0.05 as determined by Duncan's multiple range tests. ACAT, acyl-CoA cholesterol acyl-transferase; HMG-CoA reductase, hydroxy-3-methylglutaryl coenzyme A reductase; LDL-R, low-density lipoprotein receptor; CYP7A1, cholesterol 7α-hydroxylase1.
Discussion
The final body weights were significantly lower in the HF+low PSE group and even lower in the HF+high PSE group compared to the HF group. It is possible that the unique flavor of the peanut sprout could affect the appetites of the rats in the HF+high PSE group, resulting in a decrease in food intake and weight reduction. However, there were no significant differences in the total dietary intake or food efficiency ratio between the HF+high PSE group and the HF group (data are not shown). Therefore, the observed weight reduction may be mediated by other mechanisms of PSE, rather than food intake.
In this study, PSE supplements were found to be effective for decreasing triglyceride in rats fed a high-fat diet. This study also showed a decline in the mRNA expressions of lipogenic enzymes such as FAS and G6PDH, as well as their transcriptional factor, SREBP-1c. Supplementation of resveratrol has been reported to reduce mRNA expression of ACC and FAS in adipocytes of mice, compared to the control group. 26 Another study showed that resveratrol also inhibits SREBP-1c transcriptional activity in nonalcoholic fatty liver disease-induced C56BL/6 mice. 27 The findings from these studies corroborate with our study, from which we can infer that peanut sprouts, which contain significant amounts of resveratrol, are effective for inhibiting expression of lipogenic enzymes such as FAS and G6PDH, as well as the transcriptional factor SREBP-1c. The result is a decrease in plasma TG and hepatic total lipid contents.
PSE did not decrease CPT1 or ACC expression. Both enzymes are involved in the transport of acyl-CoA across the membrane and the oxidation of long chain fatty acids. 28 The results of this study therefore suggest that the decreased TG and total lipids in rats fed with PSE were not related to CPT1 or ACC mechanisms. Rather, the peanut sprout supplementation inhibits lipogenesis by decreasing lipogenic enzymes such as FAS, G6PDH, and their transcriptional factor, SREBP-1c.
The hepatic mRNA expression of HMG-CoA and ACAT2 in the HF+high PSE group was significantly lower than in the HF group. Since HMG-CoA reductase and ACAT2 are rate-limiting enzymes for cholesterol synthesis in the liver, 16,17 restraining the mRNA expressions of these enzymes leads to changes in plasma or hepatic cholesterol concentrations. Although the cholesterol levels were decreased by PSE supplements, the differences between the HF and HF+PSE group were not found to be statistically significant. This discrepancy can be attributed to two possible factors—the duration of the experiment or the amount of resveratrol supplemented. For instance, a recent study showed that resveratrol supplementation (0.06%, w/w) for 20 weeks in apoE-deficient mice fed a normal diet significantly lowered the concentration of total cholesterol in plasma as well as the hepatic HMG-CoA reductase activity. 29 Thus, based on the above study, the demonstrated effects of high amount of PSEs (0.05% resveratrol w/w) suppressed HMG-CoA reductase, and ACAT expression in this study should ultimately improve serum cholesterol levels by inhibiting hepatic cholesterol synthesis in the liver of rats fed a high-fat diet.
This study also observed a significant increase in CYP7A1 expression in the HF+low PSE and HF+high PSE groups compared to the high-fat diet group. CYP7A1 is an enzyme involved in the excretion of cholesterol in feces as bile acid. 18 This study showed increased fecal concentrations of cholesterol in the PSE supplement-fed group compared to the high-fat group, although the differences were not statistically significant. Therefore, further study is needed to determine whether the increased cholesterol excretion resulting from the higher CYP7A1 expression can lower blood cholesterol through peanut sprout supplementation.
This study is the first to publish significant data on the effects of peanut sprouts on lipid metabolism in high-fat diets. Data from this study indicate that peanut sprout supplementation decreases body weight and inhibits TG accumulation in rats fed a high-fat diet. This effect is attributed to the suppression of mRNA expression of transcription factor, SREBP-1c, and enzymes related to hepatic lipogenesis, such as FAS and G6PDH. Furthermore, the data showed that the PSE decreased expression of cholesterol synthesis and excretion by decreasing HMG-CoA reductase, ACAT, and CYP7A1 expressions. Consumption of PSEs is therefore thought to be effective in regulating weight and improving TG and cholesterol metabolism in rats fed a high-fat diet.
Footnotes
Acknowledgment
The present research was conducted by the research fund of Dankook University in 2013.
Author Disclosure Statement
No competing financial interests exist.