
Abstract
In this study, we investigated the anti-diabetic effect of Aster sphathulifolius (AS) extract in C57BL/KsJ-db/db mice. The db/db mice were orally administered with AS 50% ethanol extract at concentrations of 50, 100, and 200 mg/kg/day (db/db-AS50, db/db-AS100, and db/db-AS200, respectively) for 10 weeks. Food and water intake, fasting blood glucose concentrations, blood glycosylated hemoglobin levels, and plasma insulin levels were significantly lower in the db/db-AS200 group than in the vehicle-treated db/db group; whereas glucose tolerance was significantly improved in the db/db-AS200 group. Moreover, AS dose dependently increased both insulin receptor substrate 1 and glucose transporter type 4 expression in skeletal muscle, significantly increased glucokinase expression, and decreased glucose 6-phosphatase and phosphoenolpyruvate carboxykinase expressions in the liver. The expressions of transcription factors, such as sterol-regulatory element-binding protein, peroxisome proliferator-activated receptor γ, and adipocyte protein 2, were upregulated in adipose tissue. Furthermore, immunohistochemical analysis showed that AS upregulated insulin production by increasing pancreatic β-cell mass. In summary, AS extract normalized hyperglycemia by multiple mechanisms: inhibition of glyconeogenesis, acceleration of glucose metabolism and lipid metabolism, and increase of glucose uptake. Using in vivo assays, this study has shown the potential of AS as a medicinal food and suggests the efficacy of AS for the use of prevention of diabetes.
Introduction
T
The first step by which insulin increases energy utilization and storage involves the glucose transporter in skeletal muscle. Skeletal muscle is a major contributor to the dysregulation of glucose homeostasis in T2DM, since skeletal muscle accounts for 85% of whole-body insulin-stimulated glucose uptake. 5 Glucose transport in skeletal muscle is mainly facilitated by the insulin-responsive glucose transporter type 4 (GLUT4). In the basal state, GLUT4 is stored in a transporter-enriched intracellular pool. Definitive evidence that GLUT4 is the primary mediator of both basal and insulin-stimulated glucose transport in muscle comes from muscle-specific GLUT4 knockout mice. 6 When insulin activates its cell surface receptor, a signal is generated, which results in the stimulation of exocytosis of the intracellular GLUT4 vesicles to the plasma membrane and facilitates the uptake of the glucose from the blood stream. 7 This process is initiated on binding of insulin to the transmembrane receptor and is mediated through an intracellular molecular signaling cascade, including the consecutive phosphorylation of several cytosolic proteins, such as insulin receptor substrate (IRS), phosphatidylinositol 3-kinase (PI3K), and protein kinase B. 8,9
Another major site that regulates glucose metabolism in T2DM is the liver, which plays a central role in this process by balancing the uptake and storage of glucose via glycogenesis and the release of glucose via glycogenolysis and gluconeogenesis. Hepatic glucokinase (GK), as one of the key glucose-regulating enzymes in the catabolism of glucose, can phosphorylate glucose and it catalyzes the conversion of glucose into glucose-6-phosphate in the liver. GK-knockout mice exhibit mild hyperglycemia, while the overexpression of GK leads to a relatively lower blood glucose concentration in the diabetic models. 10 Glucose-6-phosphatase (G-6-Pase) is a key enzyme involved in systemic glucose homeostasis. It catalyzes the last biochemical reaction of both gluconeogenesis and glycogenolysis. 11 Phosphoenolpyruvate carboxykinase (PEPCK) is a central enzyme in carbohydrate metabolism, and it catalyzes the conversion of oxaloacetate to phosophoenol pyruvate, helping regulate the blood glucose level. 12
Diabetes is often correlated with obesity, leading to a long-standing hypothesis that insulin resistance is a consequence of overnutrition and elevated dietary fatty acids. 13 Sterol-regulatory element-binding protein-1c (SREBP-1c) was initially discovered as a key player of adipocyte differentiation. 14 In addition, SREBP-1c plays a critical role in lipogenesis. 15 It works in tandem with peroxisome proliferator-activated receptor γ (PPAR-γ), which is a direct target of SREBP-1c in adipocytes and contains a sterol response element in its promoter. 16 It has been proposed that along with an upregulation of PPAR expression, SREBP-1c is also able to induce PPAR activity by the production of an endogenous ligand, leading to the stimulation of both adipogenesis and lipogenesis. 17 Insulin, a key postprandial hormone, stimulates the expression and activity of SREBP-1c to accommodate anabolic processes, such as fatty acid synthesis, on feeding. 18,19 PPAR-γ acts as a transcription factor regulating the expression of several genes involved in metabolic pathways, including energy expenditure. 20
Insulin is the primary hormone involved in glucose homeostasis and the stimulation of glucose transport. Circulating insulin rapidly reaches its target tissues, mainly muscle, liver, and adipose tissue, where it interacts with its receptor. Therefore, enhancing glucose uptake in skeletal muscle and liver is a primary therapeutic strategy for treatment of metabolic syndrome and T2DM.
Currently, there are six classes of oral antidiabetic drugs, such as metformin, sulfonylureas, meglitinides, thiazolidinediones, dipeptidyl peptidase IV inhibitors, and α-glucosidase inhitors. 21 Although these drugs are widely used medications for the treatment of T2DM, most oral therapeutic agents for T2DM have side effects. Currently, there is increasing interest in natural products that have minor side effects as compared with the synthetic drugs. Aster sphathulifolius (AS) Maxim is a perennial herb distributed along the eastern and southern coasts of South Korea, and young leaves of AS have been traditionally used as edible vegetables in Korea. 22,23 Won et al. reported that AS has antiviral efficacy against influenza A/PR/8/34 infection. 24 In addition, Lee et al. reported that three new diterpene glycosides and eight known substances were isolated from methanol extracts of aerial parts of AS and their cytotoxicity against five human tumor cell lines was evaluated. 25 There are limited reports on the effects of AS against diabetes and diabetic complications in animal models. This study evaluated the possible efficacy of AS extract for altering blood glucose concentration, insulin secretion, insulin resistance, and its effects on the gene expression of genes that regulate glucose metabolism in diabetic C57BL/KsJ-db/db mice.
Materials and Methods
Materials
Dried Aster sphathulifolius (AS) collected from Ulleung Island, Korea, was identified by Dr. Il-Jun Kang, professor in the Department of Food Science and Nutrition, Hallym University (Korea). Dry plant materials were extracted with 50% ethanol for 3 h by refluxing and then filtered (3MM CHR; Whatman, Maidstone, United Kingdom). After filtration, various ethanolic extracts were concentrated under reduced pressure, by using a rotary vacuum evaporator (Büchi, Flawil, Switzerland) and lyophilized (IlShin BioBase, Seoul, Korea) to obtain powder. The extraction yield of extract from AS was 26.7%.
Reagents
Mouse insulin enzyme-linked immunosorbent assay (ELISA) kit (Millipore Corporation, Billerica, MA, USA), assay kits for aspartate aminotransferase (AST), alanine aminotransferase (ALT), cholesterol (CHOL), glucose (GLUC), high-density lipoprotein (HDL-Chol), low-density lipoprotein (LDL-Chol), and triglyceride (TG) were purchased from Jung-Ang Experimental Animal Incorporated (Seoul, Korea). Immunoblotting was performed using the following antibody: Insulin (Santa Cruz Biotechnology, Santa Cruz, CA, USA).
Animals
C57BL/KsJ-db/db male diabetic mice (db/db) and their non-diabetic heterozygote littermates (db/m+) were purchased from Jung-Ang Experimental Animal Incorporated (Seoul, Korea) at 5 weeks of age and maintained under standard laboratory conditions of 24°C±5°C and 55%±5% relative humidity with a 12-h light/12-h dark cycle. The animals were allowed ad libitum access to water and an AIN-76A Rodent Purified diet (Jung-Ang Experimental Animal Incorporated, Seoul, Korea) during a 2-week acclimation period.
Animal experiments
After a 2-week acclimation, animals were randomly divided into diabetic control group (vehicle-treated db/db group; n=12) and non-diabetic control group (vehicle-treated db/m+ group; n=12), while another three groups of db/db mice were orally treated with AS extract at concentrations of 50, 100, and 200 mg/kg/day (db/db-AS50, db/db-AS100, and db/db-AS200; n=12, respectively). The 50% ethanol extract of AS was dissolved in distilled water and orally administered once a day for 10 weeks. This animal study was conducted in accordance with guidelines and approval of the Institutional Animal Care and Use Committees (IACUC) of Hallym University (Approval No.: Hallym 2013-103).
Determination of food intake, water intake, and body weight
All the groups were fed a standard AIN-76A Purified Rodent diet (Jung-Ang Experimental Animal Incorporated) and had free access to water. The food and water intakes of animals were measured semiweekly, and body weight was monitored weekly. Food and water consumption were determined by subtracting the left-over amount from the total amount provided.
Determination of fasting blood glucose
During the 10-week experiment, the blood glucose concentration was monitored weekly. Fasting blood glucose levels were measured after the animals had fasted for 12 h. Blood glucose levels were determined in blood samples from the tail vein using a glucose analyzer (Roche Diagnostics Incorporated, Indianapolis, IN, USA). To get the precise data, the measurement of blood glucose was always carried out at the same time period after a 12 h fast.
Determination of hemoglobin A1c levels
The mice were fasted for 12 h, and the blood samples, via the retro-orbital venous plexus, using heparinized capillary tubes were collected into an EDTA-coated tube. We evaluated the performance of the TOSOH glycohemoglobin analyzer (TOSOH Corporation, Tokyo, Japan).
Serum biochemistry analysis
At the end of the experimental period, the mice were sacrificed after a 12 h fast. Blood samples were obtained via the retro-orbital venous plexus into a tube, and serum samples were separated from the blood. AST, ALT, CHOL, GLUC, HDL-Chol, LDL-Chol, and TG were determined using an automatic analyzer (Thermo Electron Corporation, Vantaa, Finland).
Enzyme-linked immunosorbent assay
The blood samples were placed on ice and were centrifuged at 800 g for 15 min at 4°C. The plasma was stored at −70°C until assay. The level of insulin in the serum from the mice was determined using ELISA assay procedure, and reagents were included in the mouse insulin ELISA kit (Millipore Corporation, Billerica, MA, USA). Ten microliters of assay buffer, 10 μL of sample, and 80 μL of biotinylated detection antibody were added to the wells of a microtiter plate coated by a pre-titered amount of anti-insulin-coated antibodies, and they were then incubated for 2 h at room temperature. After washing away unbound biotinylated antibodies, 100 μL of horse radish peroxidase conjugate streptavidin was added to each well and incubated for 30 min at room temperature. The wells were again washed, 100 μL substrate solution was added to each well for 15 min at room temperature, and color developed in proportion to the amount of target protein bound. The stop solution changed the color from blue to yellow, and the intensity of the color was measured at 450 nm.
Intraperitoneal glucose tolerance test
At the end of treatment, an intraperitoneal glucose tolerance test (IPGTT) was performed to assess glucose tolerance of db/db mice. On the test day, the animals were fasted for 12 h and then given an intraperitoneal injection of glucose (2 g/kg body weight). Blood glucose levels were measured in tail blood samples at 0, 15, 30, 60, 90, and 120 min after the glucose treatment using a glucometer (Roche Diagnostics Incorporated).
Insulin tolerance test
To estimate insulin sensitivity, an insulin tolerance test (ITT) was performed. The test consisted of an insulin solution (0.75 U/kg of body weight) that was administered subcutaneously in the dorsal region. After 30 min, they were intraperitoneally injected with 2 g glucose/kg body weight. Blood glucose levels were measured in tail blood samples at 0, 30, 60, 90, and 120 min after the glucose treatment using a glucometer (Roche Diagnostics Incorporated).
Immunohistochemical staining for insulin
The pancreatic tissue samples were fixed in 4% formaldehyde, dehydrated in a graded series of ethanol concentrations, and embedded. For immunohistochemistry analysis, the rehydrated sections were treated with 3% H2O2 in methanol for 1 h to quench endogenous peroxidase, and then washed with 0.01 M sodium phosphate buffer for 10 min. For detection of insulin, slides were incubated for 3 h at room temperature with anti-insulin antibody (Diluted 1:500; Santa Cruz Biotechnology Incorporated). Incubation with primary antibody followed rinsing with PBST for 10 min; slides were then treated with a biotinylated link (Universal DakoCytomation, Glostrup, Denmark), which was detected by a reaction with horseradish peroxidase for 30 min. After washing with phosphate-buffered saline containing 0.05% Tween 20 PBST, slides were incubated with 3, 3′-diaminobenzidine tetrahydrochloride (Universal DakoCytomation) and immediately rinsed with distilled water after color development. Counterstaining was performed with Mayer's Hematoxylin (Universal DakoCytomation). Slides were mounted and were then observed under a light microscope (Carl Zeiss, Göttingen, Germany
RNA isolation
For the isolation of tissue RNA, mice were sacrificed; muscle, liver, and adipose muscle tissue were removed under aseptic conditions and immediately frozen at −70°C. Muscle, liver, and adipose tissues were homogenized in easy-blue reagent (Easy-Blue™ total RNA extraction kit; iNtRON, Gyeonggi, Korea) using Mixer. Total RNA was extracted according to the manufacturer's protocol. RNA concentrations were measured spectrophotometrically (Thermo Scientific, Waltham, MA, USA) using the absorbance at 260 nm and 280 nm in samples with an appropriate dilution.
Real-time polymerase chain reaction analysis
The real-time polymerase chain reaction (RT-PCR) analysis was performed using cDNA synthesized from 1 μg total RNA of each sample by using a transcriptor first-strand cDNA synthesis kit as described in the manufacturer's protocol (Roche Applied Science, Penzberg, Germany). The PCR amplifications were quantified using a LightCycler 480 SYBR Green 1 Master Mix (Roche Applied Science, Mannheim, Germany), and the results were normalized against glyceraldehyde-3-phosphate dehydrogenase (GAPDH) gene expression. The oligonucleotide primers are shown in Supplementary Table S1 (Supplementary Data are available online at
Statistical analysis
The results were expressed as the mean±standard deviation (n=3) of triplicate experiments. An analysis of variance and Duncan's multiple-range tests were used to determine the significance of differences means, and P<.05 was considered statistically significant.
Results
Changes in body weight and food and water intakes
At the start of the study, body weight in the db/db group was significantly heavier than that of their lean littermates (vehicle-treated db/m+) at baseline (36.28±1.52 vs. 25.37±0.54 g for vehicle-treated db/db and vehicle-treated db/m + mice, respectively). After the 10-week period, the average body weight of the db/db-AS200 group was slightly reduced compared with that of the vehicle-treated db/db group (Table 1), but the body weights of the db/db mice treated with AS at concentrations of 50, 100, and 200 mg/kg/day were not statistically different from those of the vehicle-treated db/db group. During the 10-week period, food and water intake in the vehicle-treated db/db group was significantly higher than that in the vehicle-treated db/m+ group; the vehicle-treated db/db group and db/db-AS50 group were similar throughout the study. The db/db-AS100 and db/db-AS200 groups were significantly lower than the vehicle-treated db/db group.
The values are expressed as mean±SD (n=12). Values with different superscript letters are significantly different (P<.05). The food intake, water intake of animals was measured semiweekly, and body weight was monitored weekly for 10 weeks. db/m+, C57BL/KsJ-db/m+ mice; db/db, C57BL/KsJ-db/db mice; db/db-AS50, C57BL/KsJ-db/db mice were orally treated with AS ethanol extract at concentrations of 50 mg/kg/day; db/db-AS100, C57BL/KsJ-db/db mice were orally treated with AS ethanol extract at concentrations of 100 mg/kg/day; db/db-AS200, C57BL/KsJ-db/db mice were orally treated with AS ethanol extract at concentrations of 200 mg/kg/day.
AS, Aster sphathulifolius; SD, standard deviation.
Analysis of fasting blood glucose levels
As shown in Figure 1, the initial blood glucose levels were not significantly different among the db/db group. The vehicle-treated db/db group showed a significantly higher level of blood glucose, compared with the vehicle-treated db/m+ group. The AS extract-treated group maintained lower blood glucose levels compared with the non-treated group in a dose-dependent manner. However, the blood glucose levels of the db/db-AS200 group were significantly decreased compared with the vehicle-treated db/db group from the 6th week to the end of the study.
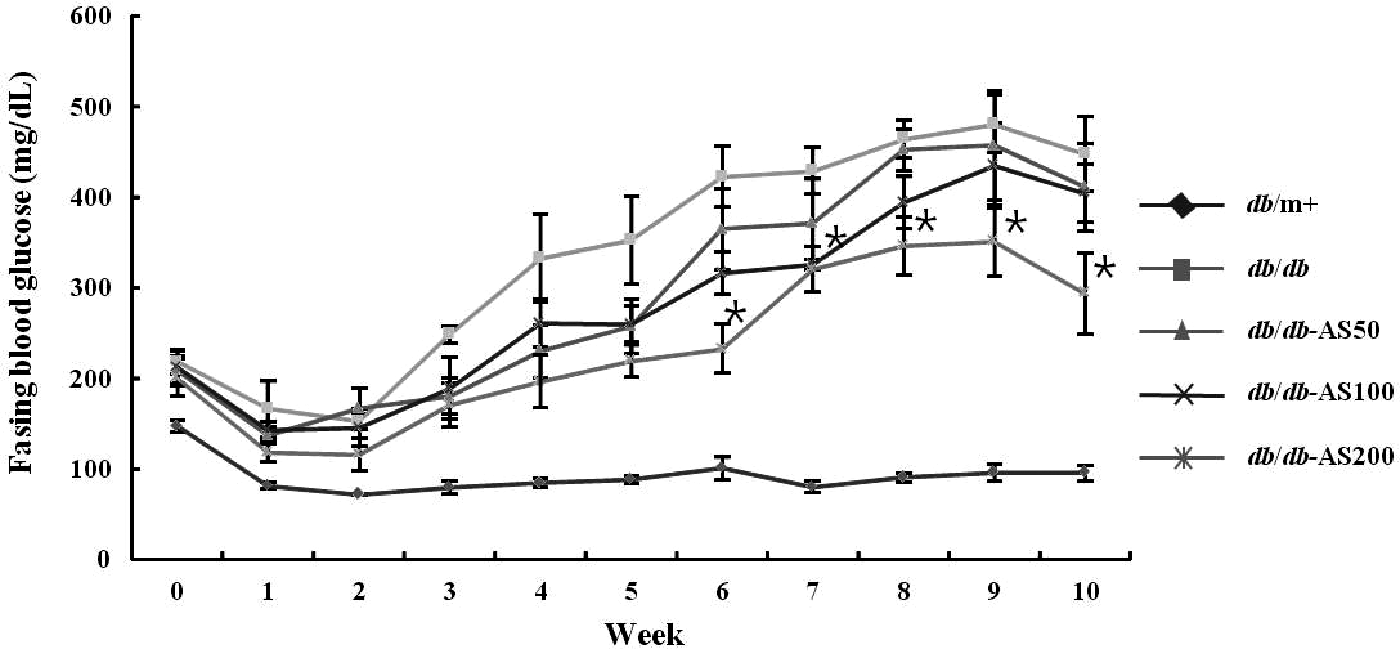
Weekly changes in the fasting blood glucose levels of C57BL/KsJ db/db mice administered with Aster sphathulifolius (AS) extract. During the 10-week experiment, the blood glucose concentration was monitored weekly. The values are expressed as mean±SD (n=12). *P<.05 vs. to db/db control group based on Tukey's test. db/m+, C57BL/KsJ-db/m+ mice; db/db, C57BL/KsJ-db/db mice; db/db-AS50, C57BL/KsJ-db/db mice were orally treated with AS ethanol extract at concentrations of 50 mg/kg/day; db/db-AS100, C57BL/KsJ-db/db mice were orally treated with AS ethanol extract at concentrations of 100 mg/kg/day; db/db-AS200, C57BL/KsJ-db/db mice were orally treated with AS ethanol extract at concentrations of 200 mg/kg/day. SD, standard deviation.
IPGTT and ITT
Changes in blood glucose were shown in Figure 2. Fasting blood glucose level of the vehicle-treated db/db group was significantly higher than that of the vehicle-treated db/m+ group. Data from the IPGTT experiment indicated that administration of AS extract induces a slight decrease in blood glucose levels that was observed at 15 min. Glucose values in the db/db-AS200 group were markedly reduced to significant values after 15, 30, and 60 min, and these levels returned to almost normal levels after 120 min. Moreover, the significant change in blood glucose level was not detected in the sample-low group and the sample-high group. Because of impaired insulin sensitivity, the blood glucose concentrations increased in the db/db group after 60 min. The blood glucose levels increased in the db/db-AS50 group and the db/db-AS100 group after 90 min, and blood glucose levels of these groups were higher than initial blood glucose levels (Fig. 3). On the other hand, the blood glucose levels of the db/db-AS200 group also increased after 90 min and then declined to the initial blood glucose level in 120 min. These observations strongly suggest that AS improves glucose intolerance and slightly ameliorates insulin sensitivity in the db/db-AS200 group.
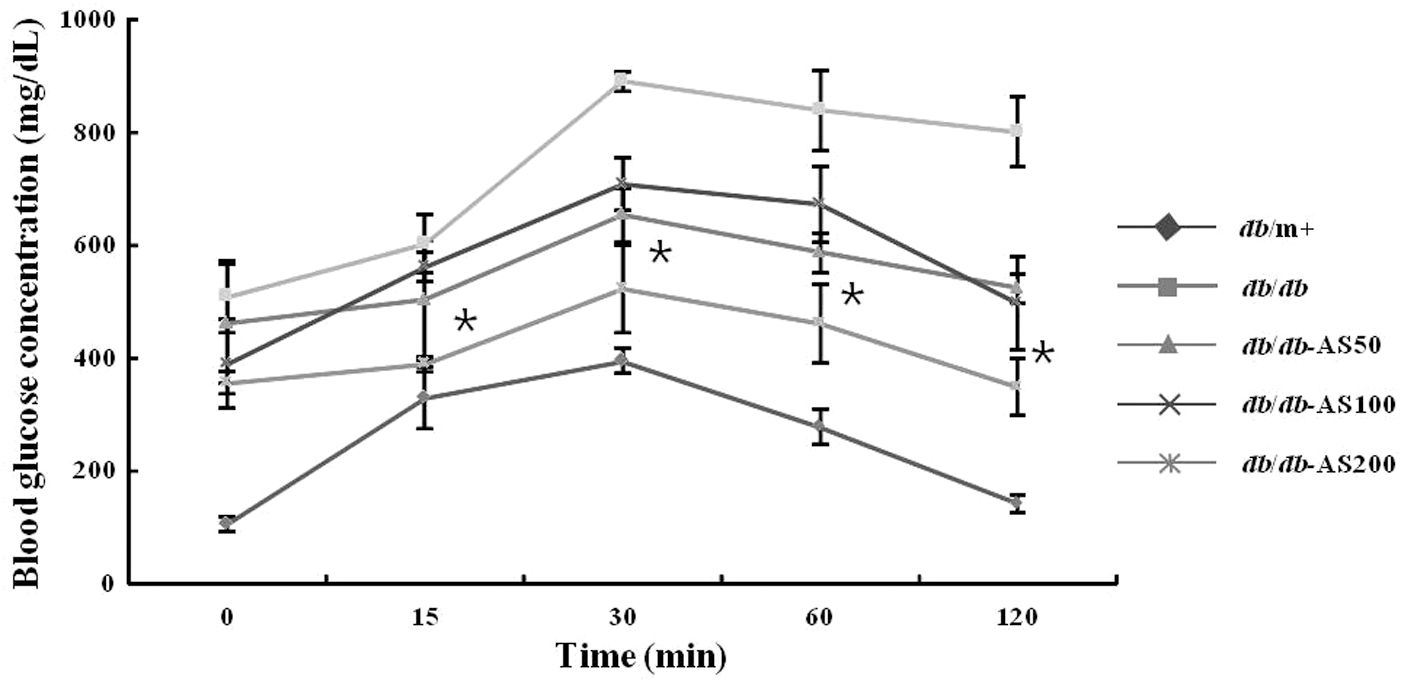
Effect of AS extract treatment in glucose tolerance test on C57BL/KsJ- db/db mice at 10 weeks. After a 12 h fast, all mice were intraperitoneally injected with glucose (2 g/kg body weight). The blood glucose concentration was measured at the indicated times and presented as a percent of glucose injection at time zero. The values are expressed as mean±SD (n=12). *P<.05 vs. to db/db control group based on Tukey's test. db/m+, C57BL/KsJ-db/m+ mice; db/db, C57BL/KsJ-db/db mice; db/db-AS50, C57BL/KsJ-db/db mice were orally treated with AS ethanol extract at concentrations of 50 mg/kg/day; db/db-AS100, C57BL/KsJ-db/db mice were orally treated with AS ethanol extract at concentrations of 100 mg/kg/day; db/db-AS200, C57BL/KsJ-db/db mice were orally treated with AS ethanol extract at concentrations of 200 mg/kg/day.
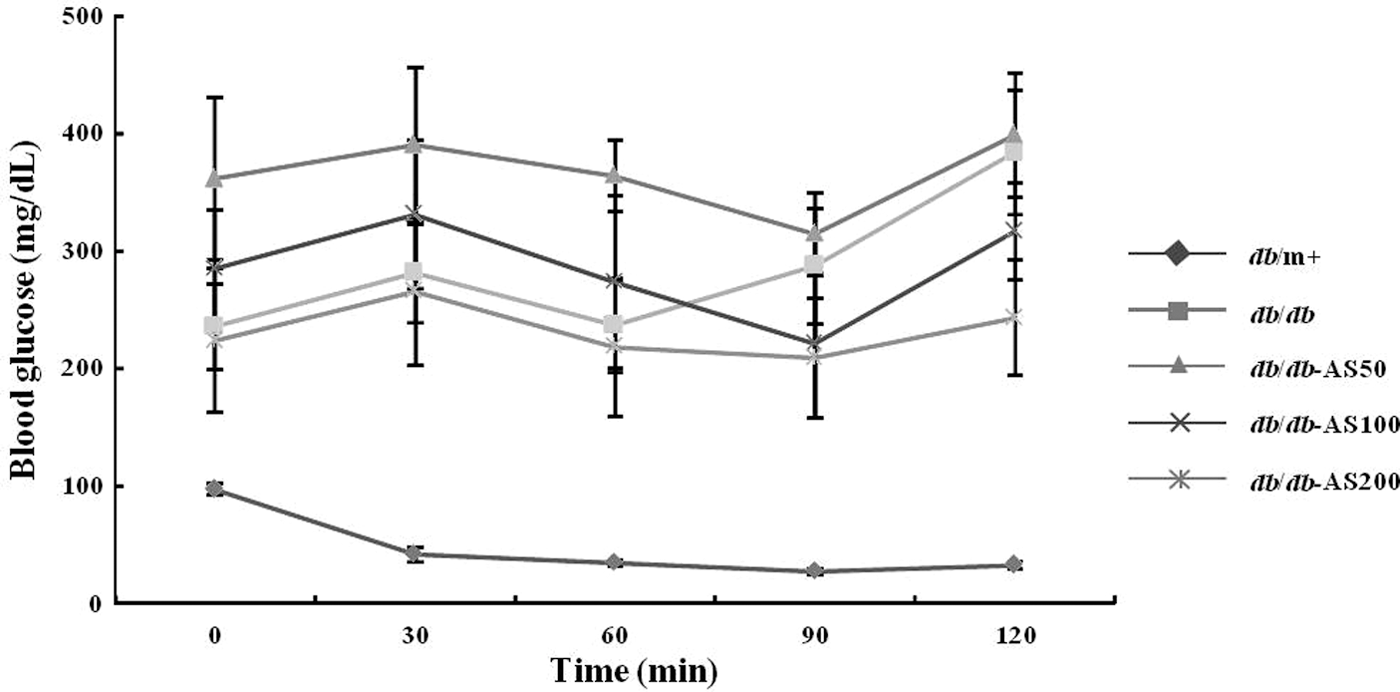
Effect of AS extract treatment in insulin tolerance test on C57BL/KsJ- db/db mice at 10 weeks. After a 12 h fast, male mice were intraperitoneally injected with glucose (2 g/kg body weight). The blood glucose concentrations were measured and presented as a percent of glucose injection at time zero. The values are expressed as mean±SD (n=12). *P<.05 vs. to db/db control group based on Tukey's test. db/m+, C57BL/KsJ-db/m+ mice; db/db, C57BL/KsJ-db/db mice; db/db-AS50, C57BL/KsJ-db/db mice were orally treated with AS ethanol extract at concentrations of 50 mg/kg/day; db/db-AS100, C57BL/KsJ-db/db mice were orally treated with AS ethanol extract at concentrations of 100 mg/kg/day; db/db-AS200, C57BL/KsJ-db/db mice were orally treated with AS ethanol extract at concentrations of 200 mg/kg/day.
Effect of AS extract on plasma parameters
After a 10-week administration of AS extracts in C57BL/KsJ-db/db mice, serum biochemical levels were determined. The results of plasma parameters were summarized in Table 2. As shown in Table 2, the db/db-AS200 group showed significantly decreased CHOL, GLUC, and LDL-Chol, compared with the vehicle-treated db/db group.
The values are expressed as mean±SD (n=12). Values with different superscript letters are significantly different (P<.05). db/m+, C57BL/KsJ-db/m+ mice; db/db, C57BL/KsJ-db/db mice; db/db-AS50, C57BL/KsJ-db/db mice were orally treated with AS ethanol extract at concentrations of 50 mg/kg/day; db/db-AS100, C57BL/KsJ-db/db mice were orally treated with AS ethanol extract at concentrations of 100 mg/kg/day; db/db-AS200, C57BL/KsJ-db/db mice were orally treated with AS ethanol extract at concentrations of 200 mg/kg/day.
ALT, alanine aminotransferase; AST, aspartate aminotransferase; CHOL, cholesterol; GLUC, glucose; HDL-Chol, high-density lipoprotein; LDL-Chol, low-density lipoprotein; TG, triglyceride.
Effect of AS extract on hemoglobin A1c levels
At the end of the experimental period, after 10 weeks, we investigated the percentage of glycosylated hemoglobin A1c (HbA1c) in db/db mice after different concentrations of treatment. Figure 4 shows the results of the HbA1c levels performed at the 10th week of the treatments. The vehicle-treated db/db group showed a significantly higher level of HbA1c, compared with the vehicle-treated db/m+ group. The AS-treated group maintained lower HbA1c levels compared with the vehicle-treated db/db group in a dose-dependent manner. The HbA1c levels of the db/db-AS200 group was significantly lower (P<.05) than that of the vehicle-treated db/db group.
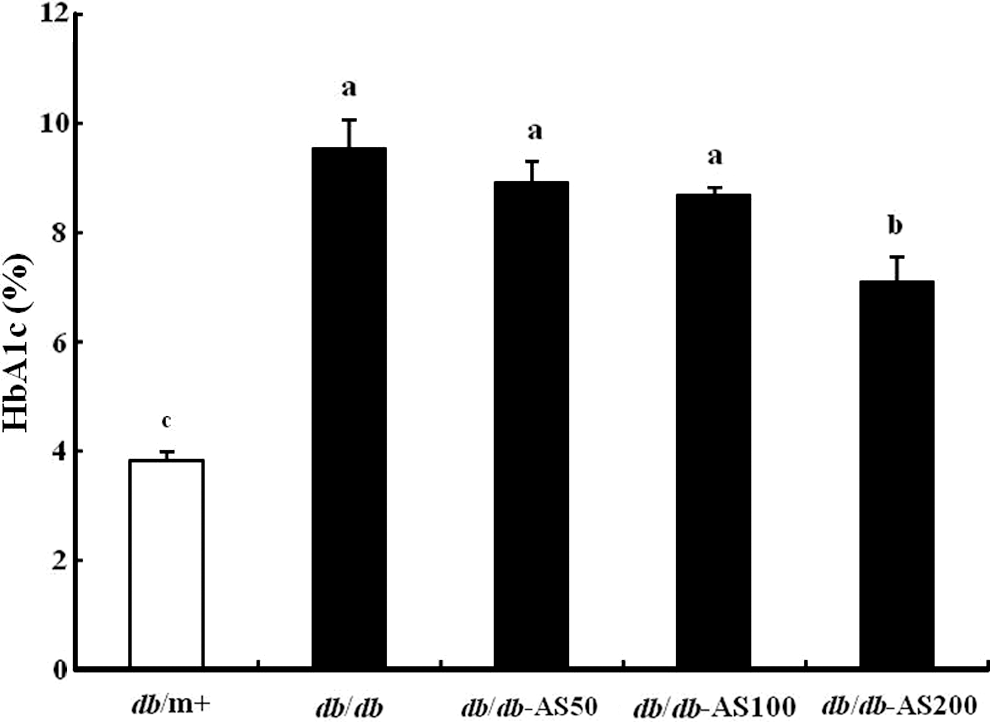
Effect of AS extract treatment on HbA1c levels in C57BL/KsJ-db/db mice at 10 weeks. The values are expressed as mean±SD (n=12). Values with different lowercase letters are significantly different (P<.05). HbA1c is expressed as percentage of total hemoglobin. db/m+, C57BL/KsJ-db/m+ mice; db/db, C57BL/KsJ-db/db mice; db/db-AS50, C57BL/KsJ-db/db mice were orally treated with AS ethanol extract at concentrations of 50 mg/kg/day; db/db-AS100, C57BL/KsJ-db/db mice were orally treated with AS ethanol extract at concentrations of 100 mg/kg/day; db/db-AS200, C57BL/KsJ-db/db mice were orally treated with AS ethanol extract at concentrations of 200 mg/kg/day. HbA1c, hemoglobin A1c.
Effect of AS extract on serum insulin concentration levels
The changes in plasma insulin levels are shown in Figure 5. In db/db mice, the plasma insulin level of the db/db-AS200 group was significantly lower than that of the vehicle-treated db/db group (P<.05). In db/db mice, the group demonstrated the highest blood insulin level (vehicle-treated db/db, 2.605 ng/mL), followed by the sample-low group (db/db-AS50, 2.175 ng/mL), and the sample-high (db/db-AS200, 1.558 ng/mL). Both the sample-low and the sample-high supplement significantly ameliorated the blood insulin level compared with the vehicle-treated db/db group. Insulin resistance of T2DM can lead to the development of hyperinsulinemia, which is caused by excessive insulin production in the pancreas to compensate for insulin resistance. In db/db mice, the AS supplement decreased the plasma insulin level. This result means that AS may have alleviated hyperinsulinemia by reducing insulin resistance.

Effect of AS extract treatment on serum insulin levels in C57BL/KsJ- db/db mice at 10 weeks. The values are expressed as mean±SD (n=12). Values with different lowercase letters are significantly different (P<.05). db/m+, C57BL/KsJ-db/m+ mice; db/db, C57BL/KsJ-db/db mice; db/db-AS50, C57BL/KsJ-db/db mice were orally treated with AS ethanol extract at concentrations of 50 mg/kg/day; db/db-AS100, C57BL/KsJ-db/db mice were orally treated with AS ethanol extract at concentrations of 100 mg/kg/day; db/db-AS200, C57BL/KsJ-db/db mice were orally treated with AS ethanol extract at concentrations of 200 mg/kg/day.
Expression of genes related to glucose homeostasis in muscle
We principally focused on the insulin receptor, IRS-1, which is involved in GLUT4 translocation under insulin stimulation. In the RT-PCR study, AS treatment increased both IRS-1 and GLUT4 gene expression level dose dependently (Fig. 6). The db/db-AS200 group showed significantly higher gene expression levels than the vehicle-treated db/db group (P<.05).
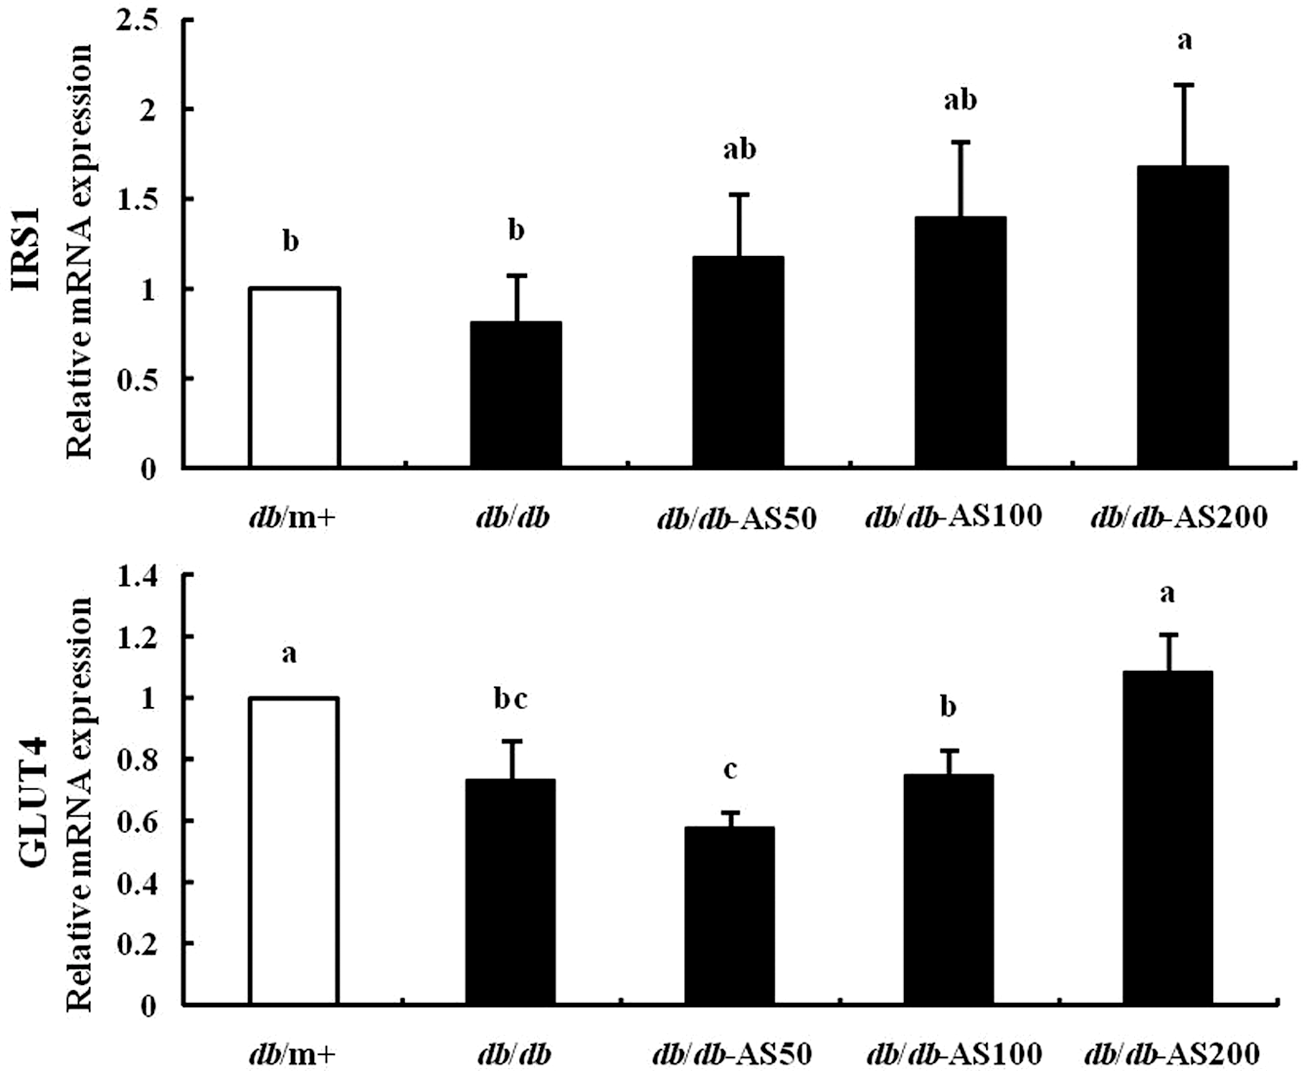
Effect of AS on gene expression levels of genes associated with glucose metabolism-regulating enzymes: insulin receptor substrate 1 (IRS-1), glucose transporter type 4 (GLUT4) in muscle. The values are expressed as mean±SD (n=12). Values with different lowercase letters are significantly different (P<.05). db/m+, C57BL/KsJ-db/m+ mice; db/db, C57BL/KsJ-db/db mice; db/db-AS50, C57BL/KsJ-db/db mice were orally treated with AS ethanol extract at concentrations of 50 mg/kg/day; db/db-AS100, C57BL/KsJ-db/db mice were orally treated with AS ethanol extract at concentrations of 100 mg/kg/day; db/db-AS200, C57BL/KsJ-db/db mice were orally treated with AS ethanol extract at concentrations of 200 mg/kg/day.
Expression of genes related to glucose homeostasis in liver
We measured the expression of genes that were known to be involved in glucose metabolism such as G-6-Pase, PEPCK, and GK in the liver by RT-PCR (Fig. 7). In the RT-PCR study, AS significantly reduced the expression of the gene encoding the regulatory enzyme of gluconeogenesis (G-6-Pase and PEPCK) in the liver of the db/db-AS200 group (P<.05). In contrast, AS significantly increased GK expression in the db/db-AS200 group, compared with the vehicle-treated db/db group (P<.05).

Effect of AS on the gene expression levels of glucose metabolism-regulating enzymes glucokinase (GK), phosphoenolpyruvate carboxykinase (PEPCK), and glucose-6-phosphatase (G-6-Pase) in the liver. The values are expressed as mean±SD (n=12). Values with different lowercase letters are significantly different (P<.05). db/m+, C57BL/KsJ-db/m+ mice; db/db, C57BL/KsJ-db/db mice; db/db-AS50, C57BL/KsJ-db/db mice were orally treated with AS ethanol extract at concentrations of 50 mg/kg/day; db/db-AS100, C57BL/KsJ-db/db mice were orally treated with AS ethanol extract at concentrations of 100 mg/kg/day; db/db-AS200, C57BL/KsJ-db/db mice were orally treated with AS ethanol extract at concentrations of 200 mg/kg/day.
Expression of genes related to glucose homeostasis in adipose tissue
The expression of genes involved in lipogenesis and β-oxidation in the epididymal fat tissue was examined. The gene expression of transcription factors (SREBP-1c and PPAR-γ) and their target molecules (adipocyte protein 2 [aP2]) were analyzed using RT-PCR. As shown in Figure 8, the expression of transcription factors and aP2 was upregulated in the db/db group in a dose-dependent manner, compared with the vehicle-treated db/db group.
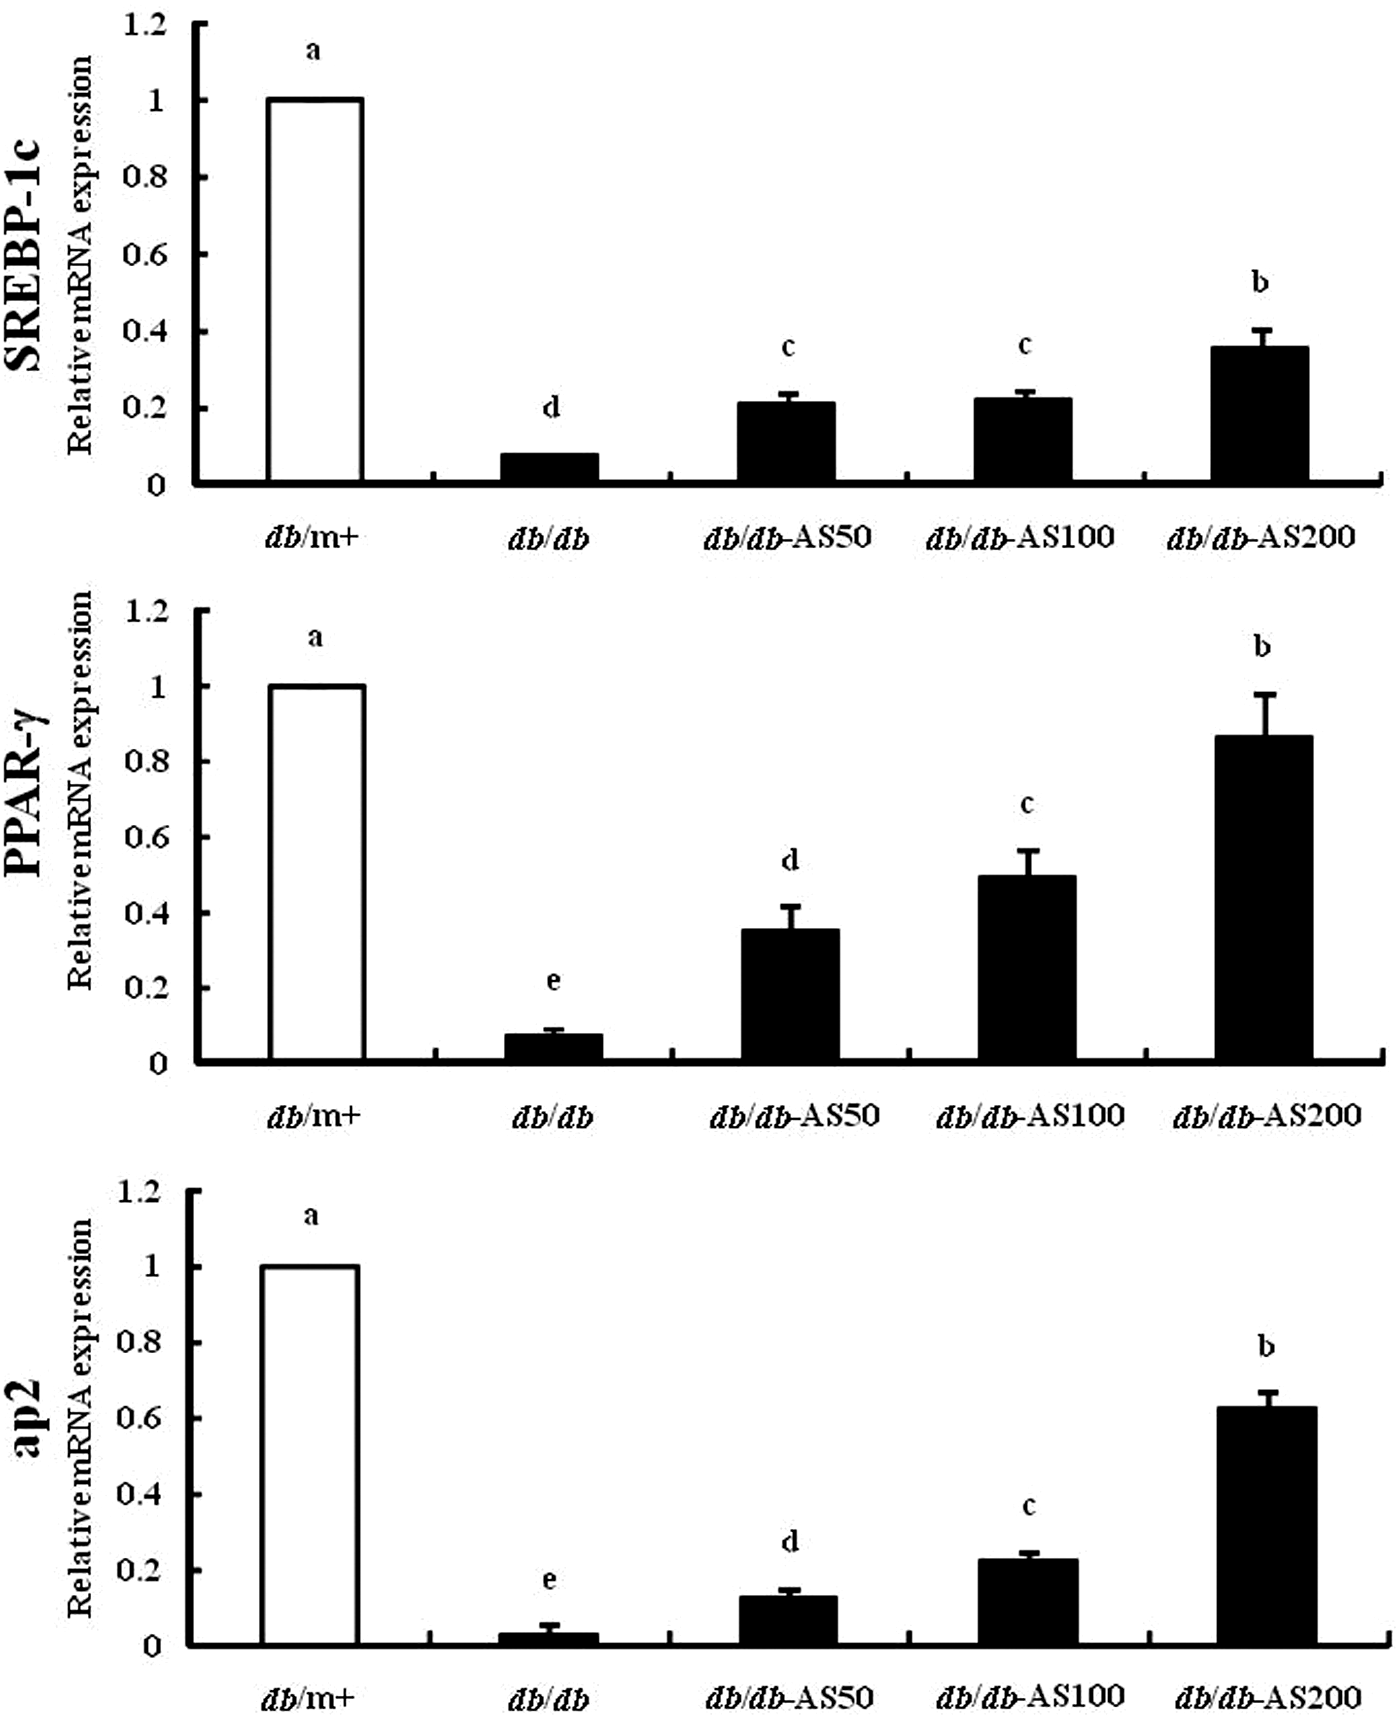
Effect of AS on the gene expression levels of glucose metabolism-regulating enzymes, sterol-regulatory element-binding protein (SREBP)-1c, peroxisome proliferator-activated receptor γ (PPAR-γ), and adipocyte protein (aP2) in adipose tissue. The values are expressed as mean±SD (n=12). Values with different lowercase letters are significantly different (P<.05). db/m+, C57BL/KsJ-db/m+ mice; db/db, C57BL/KsJ-db/db mice; db/db-AS50, C57BL/KsJ-db/db mice were orally treated with AS ethanol extract at concentrations of 50 mg/kg/day; db/db-AS100, C57BL/KsJ-db/db mice were orally treated with AS ethanol extract at concentrations of 100 mg/kg/day; db/db-AS200, C57BL/KsJ-db/db mice were orally treated with AS ethanol extract at concentrations of 200 mg/kg/day.
Pancreas immunohistochemistry
The pancreatic tissues were immunohistochemically stained, using an antibody to insulin, and examined by light microscopy (Fig. 9). Tissue from the vehicle-treated db/m+ group exhibited a higher staining intensity than that from the vehicle-treated db/db group. The level of insulin in pancreatic β-cells of the db/db-AS200 group was significantly higher than that of the db/db group, whereas the levels in the db/db-AS50 and db/db-AS100 groups were not significantly different. These results suggest that AS may improve pancreatic β-cells against destruction in a dose-dependent way.

Immunochemical examination of the pancreas of C57BL/KsJ-db/db mice administered with AS extract for 10 weeks. Stained tissues are indicated by arrows. Original magnification, ×400. db/m+, C57BL/KsJ-db/m+ mice; db/db, C57BL/KsJ-db/db mice; db/db-AS50, C57BL/KsJ-db/db mice were orally treated with AS ethanol extract at concentrations of 50 mg/kg/day; db/db-AS100, C57BL/KsJ-db/db mice were orally treated with AS ethanol extract at concentrations of 100 mg/kg/day; db/db-AS200, C57BL/KsJ-db/db mice were orally treated with AS ethanol extract at concentrations of 200 mg/kg/day. Color images available online at
Discussion
In this study, we observed the effects of AS on glucose metabolism in the C57BL/KsJ-db/db mice. The mice were orally administrated with AS (50, 100, and 200 mg/kg/day, respectively) for 10 weeks. During the 10-week period, though AS supplementation did not affect the body weight gain in db/db mice, food intake and water intake of the db/db-AS100 and the db/db-AS200 group were significantly lower than those of the vehicle-treated db/db group. The typical symptoms of diabetes are polydipsia, polyuria, and polyphagia. The intake of AS extract reduced those symptoms, especially polydipsia and polyphagia, resulting in decreased water and food intake. Chronic hyperglycemia plays a key role in the pathogenesis of T2DM and diabetic complications. Therefore, it is important for preventing or reversing diabetes to find ways to control blood glucose levels. 26 The evidence from this study suggested that AS supplementation can decrease serum glucose levels in C57BL/KsJ-db/db mice. Prolonged poor glycemic control often leads to a decline in insulin secretion and the pathogenesis of glucose toxicity. HbA1c, which is formed in a non-enzymatic glycation pathway by hemoglobin's exposure to plasma glucose, 27 is a marker for average blood glucose levels over the previous months before the measurement. 28 In this study, we demonstrated that long-term supplementation with AS significantly lowered the HbA1c level in C57BL/KsJ-db/db mice, thereby decreasing the risk of long-term vascular complications of diabetes by controlling blood glucose in diabetic mice.
Insulin produced by β-cells in the pancreas promotes glucose uptake, glycogenesis, and lipogenesis in skeletal muscle, liver, and adipose tissue. 29 –31 Therefore, insulin is the most important factor in the regulation of plasma glucose homeostasis. Hyperinsulinemia is characterized as a condition where excess insulin is circulating in the blood, resulting from reduced sensitivity to insulin and disturbances in insulin release. 32 Insulin resistance is the inability of the body cells to utilize insulin; classically, this refers to impaired sensitivity to insulin-mediated glucose disposal. 33 Hyperinsulinemia and insulin resistance can lead to the development of a number of degenerative diseases and potentially life-threatening metabolic consequences. 34,35 As shown in IPGTT, which measures the ability to metabolize circulating blood glucose, AS improved impaired glucose tolerance. In addition, AS alleviated hyperinsulinemia by reducing insulin resistance. Taken together, these results demonstrated that db/db mice treated with AS for 10 weeks were less insulin resistant and had a mild improvement in glucose homeostasis compared with their untreated controls. To further determine the effects of AS extract on insulin sensitivity, we performed ITT in C57BL/KsJ-db/db mice. Results demonstrated that AS can improve insulin sensitivity. The underlying defect must be expressed in skeletal muscle, which accounts for 70–80% of insulin-stimulated glucose uptake in vivo. 8 IRS-1, which is the first intracellular protein to be phosphorylated, plays a key role via insulin signaling in skeletal muscle. 36 Insulin stimulates glucose uptake by increasing the translocation of glucose transport molecules, mainly GLUT4, which is primarily found in skeletal muscle, from intracellular vesicles to the cell surface. 37 Overexpression of GLUT4 in the muscle of genetically db/db mice alleviates insulin resistance and improves glycemic control by elevating both basal and insulin-stimulated glucose transport. 38 The insulin resistance of T2DM is characterized by defects at many levels, with decreases in the concentration and phosphorylation of IRS-1 and -2, PI3K activity, glucose transporter translocation, and the activity of intracellular enzymes in the muscle. 39 Treatment with AS significantly increased the expression of IRS-1 and GLUT4, suggesting that AS may stimulate glucose uptake in skeletal muscles through activation of IRS-1 and GLUT4. Insulin resistance profoundly contributes to the pathophysiology of T2DM and it reduces glucose utilization and increases glucose production from the liver, thus leading to hyperglycemia. 40 The liver plays a key role in glucose homeostasis increasing or decreasing glucose output and uptake during fasting and feeding. 41 In the liver, GK is the glucose-sensing enzyme, which only binds to and phosphorylates glucose, 42 and is an appealing target for hepatic glucose metabolism. In addition, PEPCK and G-6-Pase each catalyze the rate-limiting step and the final step of gluconeogenesis, respectively. 43 The expressions of hepatic genes in liver have been shown to be associated with the pathogenesis of diabetes. 44 In our study, the hypoglycemic action of AS in db/db mice was related with a significant decrease in the expression of the gene encoding the regulatory enzymes of gluconeogenesis and glycogenolysis, such as G-6-Pase and PEPCK in the liver. In contrast, AS extract significantly increased GK expression in the db/db-AS200 group, compared with the vehicle-treated db/db group. Accordingly, AS treatment appears to improve glucose metabolism through an increase in expression of GK and a decrease in G-6-Pase and PEPCK gene expression. Abnormalities of lipogenesis in insulin-sensitive tissues are an important component of T2DM. Lipogenesis is the metabolic pathway allowing the conversion of an excess of carbohydrates into fatty acids, which are ultimately esterified with glycerol 3-phosphate to form TGs in adipose tissue, which is the primary site of energy storage. 45 SREBP-1c is a key transcription factor that regulates lipid homeostasis by controlling the expression of a range of enzymes for endogenous cholesterol, fatty acid, and triacylglycerol and phospholipid synthesis. 46 It works in tandem with the adipogenic transcription factor (PPAR-γ). PPAR-γ is the main adipogenic factor that triggers adipocyte differentiation; it is highly expressed in the liver, muscle, kidney, and heart, where it stimulates the β-oxidative degradation of fatty acids. 47 The aP2 is unregulated in response to PPAR-γ agonist exposure; it is a carrier protein for fatty acids that is primarily expressed in adipocytes and is also called fatty acid binding protein 4. 48
AS has traditionally been used to treat diabetes in oriental medicine, probably due to the presence of bio active compounds in AS extracts. 22,23 In our study, the expression of transcription factors (SREBP-1c, PPAR-γ) and their target molecules (aP2) was upregulated in the AS-treated db/db group in a dose-dependent manner, compared with the vehicle-treated db/db group. These findings suggest that AS increased activation of insulin by upregulating SREBP-1c, PPAR-γ, and aP2 expression in adipose tissue, promoted fatty acid synthesis, and inhibited fatty acid oxidation. Immunohistological assay of the pancreas revealed that the db/db-AS200 group increased the β-cell staining intensity, resulting from improved pancreatic β-cells against destruction in a dose-dependent way. In conclusion, AS treatment was effective for normalizing hyperglycemia, glucose tolerance, the level of HbA1c, glucose metabolism, and lipid metabolism through gene expression in insulin-sensitive tissues. In addition, immunohistochemical analysis showed that AS upregulated insulin production by increasing pancreatic β-cell mass. These findings provide in vivo evidence that AS has therapeutic efficacy as an anti-diabetic agent.
Footnotes
Acknowledgments
This work was supported by the Technology Innovation Program (industrial strategic technology development program, 10045275, development of functional food product for improving metabolic syndrome using natural resources and extending global market) funded by the Ministry of Trade, Industry & Energy (MOTIE) and by the Hallym University Research Fund (HRF-201407-013).
Author Disclosure Statement
No competing financial interests exist.
References
Supplementary Material
Please find the following supplemental material available below.
For Open Access articles published under a Creative Commons License, all supplemental material carries the same license as the article it is associated with.
For non-Open Access articles published, all supplemental material carries a non-exclusive license, and permission requests for re-use of supplemental material or any part of supplemental material shall be sent directly to the copyright owner as specified in the copyright notice associated with the article.