
Abstract
A high glucose (Glu) milieu promotes generation of reactive oxygen species, which may not only cause cellular damage, but also modulate phase II enzymes that are responsible for the metabolism of flavonoids. Thus, we examined the effect of a high Glu milieu on quercetin (Q) metabolism in HepG2 cells. HepG2 cells were grown for 3 days in Glu ranging from 5.5 to 50 mmol/L and/or cyanidin-3-glucoside (C3G) ranging from 0 to 25 μmol/L. Subsequently, the capacity of HepG2 cells to metabolize Q was assessed for up to 16 h. Q metabolites were analyzed by high-performance liquid chromatography. Four major Q metabolites were observed in the culture medium and inside the HepG2 cells. Three of these metabolites appear to be sulfated forms of Q or methylated Q, and one was a methylated Q. These metabolites and Q itself were reduced or tended to be reduced in cells grown in a high Glu compared to a normal Glu medium. Addition of C3G or superoxide dismutase plus catalase did not prevent or enhance reduction of Q metabolites. In vitro, a hyperglycemic milieu decreases the production of the principal Q metabolites in HepG2 cells, mediated through mechanisms independent of oxidative stress.
Introduction
F
Chronic hyperglycemia, a hallmark of metabolic syndrome and diabetes, causes glycation of protein and induces generation of reactive oxygen species (ROS). 16 –19 In hyperglycemia, excess ROS escaped reduction mediated by the antioxidant defense upregulate expression of phase II pathways through mitogen-activated protein kinases and the antioxidant responsive element. 4,20 Previously, we demonstrated that 50 mmol/L increased ROS production in HepG2 cells as compared to 5.5 mmol/L. 21 Therefore, we hypothesized that a hyperglycemic condition would increase the production of phase II metabolites of flavonoids. We examined whether a high glucose (Glu) condition mimicking the hyperglycemia found in patients with metabolic syndrome and diabetes would increase the formation of quercetin (Q) phase II metabolites in HepG2 cells. Flavonoids themselves have been found to modulate phase II enzymes, probably through their antioxidant action and/or gene regulatory effects. 4,10,22 –24 Thus, we also examined whether cyanidin-3-glucoside (C3G), an anthocyanin commonly present in berries, would enhance Q metabolism. As C3G acts as a strong antioxidant, 19 the effect of C3G on the hyperglycemia-induced change in Q metabolism was evaluated.
Materials and Methods
Media and reagents
HepG2 hepatoma cells, Eagle's minimum essential medium (EMEM), fetal bovine serum (FBS), phosphate-buffered saline (PBS), and 0.25% trypsin-EDTA solution were purchased from the American Type Culture Collection (ATCC, Manassas, VA, USA). Dulbecco's modified Eagle's medium (DMEM) without Glu, superoxide dismutase (SOD), catalase (CAT), and other reagents were obtained from Sigma-Aldrich Co. (St. Louis, MO, USA). Cell culture dishes and plates were obtained from Corning, Inc. (Tewksbury, MA, USA). C3G was purchased from INDOFINE Chemical Company, Inc. (Hillsborough, VA, USA) and the BCA Protein Assay Kit from Thermo Fisher Scientific, Inc. (Rockford, IL, USA).
Cell culture
HepG2 cells were cultured with EMEM containing 10% FBS in a 10-cm dish in a 5% CO2 atmosphere at 37°C until 80% confluence. For experiments, cells between passages 10 and 30 were seeded in six-well plates at a density of 2.5 × 10⁵ cells/cm2. Cells were grown in DMEM containing 5.5 mmol/L Glu and 10% FBS for 16 h. Cells were then grown in test media without FBS (to prevent overgrowth), but containing Glu (5.5 [as a normal concentration, NGlu], 15, 30, or 50 mmol/L [as a high concentration, HiGlu]), C3G (0, 1, 10, or 25 μmol/L in NGlu), HiGlu+C3G, or HiGlu+SOD+CAT for 3 days. After the removal of the test media, the cells were treated with 2 mL of DMEM containing NGlu and 30 μmol/L Q (total 60 nmol Q in a well of a six-well plate) for 4 h. The incubation time was selected based on a preliminary experiment showing that some major Q metabolites reached their maximum concentrations at 4 h (Supplementary Fig. S1; Supplementary Data are available online at
Sample preparation
Each frozen cell suspension was homogenized with T25 Ultra-Turrax homogenizer (IKA Works, Inc., Wilmington, NC, USA) at 20,000 rpm for 30 sec in an ice bath. To 900 μL of homogenized cell suspension or medium, 1.8 mL acetonitrile, 9 μL of 1 mol/L ascorbic acid, and 15 μL of 100 μmol/L genistein as an internal standard were added. The resulting mixture was vortexed for 2 min and spun at 700 g for 10 min. The supernatant was dried, reconstituted with 500 μL of 17% methanol, centrifuged at 16000 g for 5 min, and analyzed for Q and its metabolites by high-performance liquid chromatography (HPLC). Q metabolites were normalized by cellular protein using a BCA Protein Assay Kit, according to the manufacturer's instruction.
In vitro synthesis of glucuronized Q metabolites
Glucuronidated metabolites of Q, isorhamnetin, and tamarixetin, were synthesized in vitro according to our previous protocol with slight modifications. 11,25 Flavonols (final concentration of 10 μmol/L) were incubated for 1 h at 37°C with 1 mg/mL microsomal protein from rat livers, 10 mmol/L uridine 5′-diphosphoglucuronic acid, 62.5 mg/mL alamethicin, 5 mmol/L magnesium chloride, and 25 mmol/L potassium phosphate at pH 7.5. 11,25 Flavonols and their glucuronide metabolites were analyzed by the HPLC method.
In vitro β-glucuronidase digestion of total Q glucuronides
Medium samples (1 mL) were incubated with or without β-glucuronidase for 1 h at 37°C. 26 To terminate the enzymatic reaction, an equal volume of 0.1 mol/L acetic acid in acetone containing 10 μg/mL 3,5-di-tert-4-butylhydroxytoluene was added. The mixture was then treated as the same way as described above for HPLC analysis.
Determination of Q metabolites
Q and its metabolites were quantified using a Waters HPLC system equipped with a Phenomenex Synergi Hydro-RP column, according to our previous method. 11,25 Total Q metabolites (TQM) is the sum of four major peaks and three clusters of minor peaks because these minor peaks were detected only in the media samples (but not in DMEM, Fig. 1 upper panel) and displayed Q spectrum. The concentrations of four Q metabolites (M1–M4) and other Q metabolites were calculated using a standard curve of Q after adjustment with the internal standard. The concentration of Q and Q metabolites are expressed as nmol/mg protein. To estimate recovery of the added Q to a well, the value (expressed as nmol) of total Q-related compounds (TQC) is summed to TQM and Q in the medium and cells.

Representative chromatogram of
Statistical analyses
All experiments were performed in triplicate. Data are expressed as mean ± SD. One-way ANOVA was performed to assess differences between treatments, followed by the Tukey's HSD multiple comparison test. Student's t-test was performed when mean of two treatments were compared. P-value ≤.05 was considered statistically significant. The EZR software (Saitama Medical Center, Jichi Medical University, Saitama, Japan) was used for all statistical analyses.
Results
Four major Q metabolites (M1–M4) and Q were noted in Figure 1B. The retention time of clusters 1 and 2 ranged from 6.4 to 12.2 and from 14.0 to 16.7 min, respectively. After the medium was treated with β-glucuronidase containing sulfatase, we noted that the peak height of Q and M4 was remarkably increased and M1, M2, and M3 were decreased (Fig. 2), indicating that M1–M3 were metabolites with conjugations of methyl moiety and sulfate and/or glucuronide. In our previous studies, 11,25 we identified three Q glucuronides, namely 7-O-Q glucuronide, 4′-O-Q glucuronide, and 3′-O-Q glucuronide, which were observed in this study when Q served as the substrate of the glucuronidation reaction (Fig. 3C). 7-O-Q glucuronide was located in the cluster 1 and 4′-O-Q glucuronide and 3′-O-Q glucuronide were located in the cluster 2. When isorhamnetin or tamarixetin was used as the substrate for the glucuronidation reaction, both of them yielded two metabolites, located in cluster 2 (Fig. 3E, G). The M4 peak as shown in the Figures 1B and 3A appeared to have the same retention time as isorhamnetin or tamarixetin (Figs. 2, 3D, F). As M4 peak appeared earlier and larger and then decreased at a later time, we projected that Q was first methylated as M4, and M1, M2, or M3 were derived from the methylated Q (Supplementary Fig. S1).
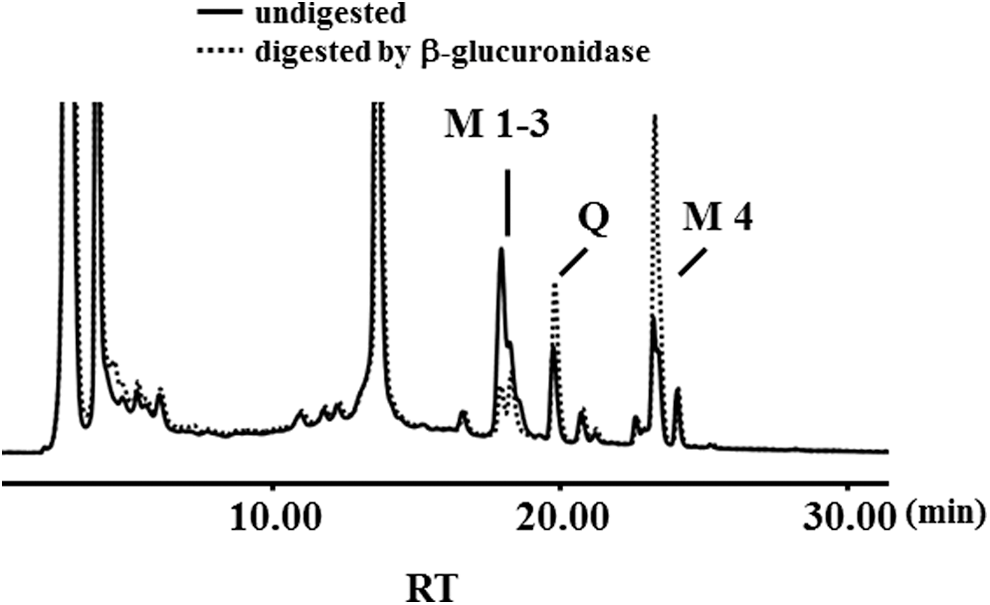
Chromatograms of total quercetin metabolites of medium sample incubated with (dashed line) or without (solid line) β-glucuronidase from Helix pomatia.

Chromatograms of medium samples that contained (A) total quercetin metabolites, (B) quercetin, (C) glucuronized quercetin, (D) isorhamnetin, (E) glucuronized isorhamnetin, (F) tamarixetin, and (G) glucuronized tamarixetin. Peaks with an asterisk are glucuronide metabolites of quercetin and isorhamnetin and tamarixetin (methylated quercetin).
Hyperglycemia decreased the production of some Q metabolites in HepG2 cells (Table 1). The HiGlu treatment decreased intracellular M1 and M3 by 19% and 25%, respectively (P ≤ .05), as compared to NGlu. The HiGlu treatment did not alter intracellular M2 and M4 concentrations. HiGlu decreased M4 in the medium by 53%, as compared to NGlu (P ≤ .05) and intracellular M4 tended to decrease along with the increase in medium Glu. The reduction in the medium and intracellular M4 was inversely correlated with Glu as shown in a linear regression test with R 2 = 0.83 and 0.36, respectively. HiGlu significantly reduced Q content in the medium and inside cells by 53% and 38%, respectively (P ≤ .05). The medium and intracellular Q contents were decreased in a Glu concentration-dependent manner with R 2 = 0.32 and 0.29, respectively. HiGlu lowered TQM in the medium by 23%, as compared to NGlu (P ≤ .05), and tended to decrease the intracellular TQM. There were inverse relationships between Glu and TQM in the medium and within cells as demonstrated in R 2 = 0.67 and 0.29 of the regression analysis, respectively. Concentration of intracellular Q metabolites appeared to be in parallel to medium metabolites. In this experiment, TQC in 5.5, 15, 30, and 50 mmol/L Glu media at 63.7 ± 4.1, 63.1 ± 2.2, 61.2 ± 1.4, and 57.5 ± 2.2 nmol, respectively, was not significantly different.
Cells were grown in DMEM with various Glu concentrations without FBS for 3 days, followed by incubation with 60 nmol of quercetin for 4 h. Values are mean ± SD (n = 3). Values without sharing the same superscript differ within a column in the same category, tested Tukey's HSD multiple comparison (P < .05).
DMEM, Dulbecco's modified Eagle's medium; FBS, fetal bovine serum; Glu, glucose; M1–M4, major metabolites of quercetin; TQM, total metabolites, excluding quercetin.
The effect of a 3-day treatment of C3G on Q metabolism appeared to follow the same trend as hyperglycemia, but with slight disparities (Table 2). In the medium, M1, M2+M3 (the peak of these Q metabolites coeluted so their values are combined), M4, Q, and TQM were decreased by C3G in a dose-dependent manner with regression R 2 = 0.70, 0.67, 0.80, 0.74, and 0.53, respectively. The highest C3G dose at 25 μmol/L led to a reduction in M1 by 30%, M2+M3 by 19%, M4 by 43%, and Q by 41% as compared to control (P ≤ .05). C3G also induced a similar pattern of intracellular Q metabolite concentrations. Of note, C3G at 25 μmol/L decreased M4 and TQM by 42% and 34% as compared to control. The negative effect of C3G on intracellular Q metabolite contents was exhibited in a linear fashion for M1, M4, and TQM with regression R 2 = 0.52, 0.60, and 0.64, respectively. In this experiment, TQC in 0, 1, 10, and 25 μmol/L C3G medium was 48.2 ± 2.3, 47.5 ± 0.8, 43.3 ± 2.0, and 40.8 ± 3.7 nmol, respectively, and the value of the 25 μmol/L C3G was significantly lower than those of 0 and 1 μmol/L (P ≤ .05).
Cells were grown in DMEM with various C3G concentrations without FBS for 3 days, followed by incubation with 60 nmol of quercetin for 4 h. Values are mean ± SD (n = 3). Values without sharing the same superscript differ within a column in the same category, tested Tukey's HSD multiple comparison (P < .05).
Peaks of M2 and M3 in the high-performance liquid chromatography analysis were not separated in the medium samples.
C3G, cyanidin-3-glucoside.
The effect of combined HiGlu and 25 μmol/L C3G on the production of Q metabolites is presented in Table 3. As compared to the NGlu, the combined treatment decreased M4 by 55% (P = .01) and Q by 46% (P = .018) in the medium, respectively. Other metabolites in the medium and within cells were not affected by the treatment. TQC in the NGlu with or without C3G were 65.1 ± 1.6 and 62.2 ± 2.5 nmol and those in the HiGlu with or without C3G were 53.1 ± 2.2 and 56.2 ± 5.8 nmol, respectively. The four TQC values were not significantly different.
Cells were grown in DMEM containing 5.5 or 50 mmol/L Glu and 0 or 25 μmol/L C3G without FBS for 3 days, followed by incubation with 60 nmol of quercetin for 4 h. Values are mean ± SD (n = 3). Values without sharing the same superscript differ within a column in the same category, tested Tukey's HSD multiple comparison (P < .05).
Q metabolism was examined in HepG2 cells grown in HiGlu with SOD and CAT (Table 4). M1 and M3 in the medium and within cells were not affected by HiGlu+SOD+CAT as compared to NGlu, and M2 in the medium was significantly increased by 44% (P = .001). HiGlu+SOD+CAT significantly decreased M4 in the medium and within cells by 76% (P = .008) and 79% (P = .003), respectively, as compared to NGlu. As compared to NGlu, HiGlu+SOD+CAT reduced TQM content in the medium by 34% and within cells by 58%, respectively (P = .003 and .026). Q in the medium and within cells was 70% (P = .007) and 23% (P = .027) lower in HepG2 cells treated with HiGlu+SOD+CAT, respectively, as compared to NGlu. TQC in the NGlu and HiGlu+SOD+CAT were 53.5 ± 4.5 and 36.4 ± 1.6 nmol, respectively (P = .003).
Cells were grown in DMEM with various Glu concentrations without FBS for 3 days, followed by incubation with 60 nmol of quercetin for 4 h. Values are mean ± SD (n = 3). Values without sharing the same superscript differ within a column in the same category, tested Tukey's HSD multiple comparison (P < .05).
CAT, catalase; SOD, superoxide dismutase.
Discussion
The inverse associations between dietary polyphenols and the risk for major chronic diseases, such as cancer and cardiovascular disease, are well appreciated. 27 However, it is difficult to establish a dose–response relationship in these outcomes, largely due to our limited understanding of the extent of their absorption and metabolic fate in the gastrointestinal tract and liver. 28,29 Thus, it is critical to elucidate factors that mediate absorption and metabolism of ingested polyphenols. In this study, we found the majority of Q metabolites were excreted to the medium, consistent with the available evidence that phase II metabolisms transform flavonoids for their rapid elimination from the body. 30 In contrast to our hypothesis that hyperglycemia would upregulate the production of phase II Q metabolites, we found that high Glu decreased the production of TQM in a dose-dependent manner. This reduction might be attributed partially to the nonsignificant degradation of Q in the high Glu condition as revealed by the decreased total Q recovered at the end of the treatments. However, this degradation cannot fully explain the observed results because the magnitude of these reductions varied between individual Q metabolites and the location. For example, M4, projected to be methylated Q, in the medium was decreased in a Glu-dependent manner, but the other three main metabolites remained unchanged. Our results appear to be in agreement with Wang et al. who found that the COMT activity was decreased in the liver of streptozotocin-induced diabetic rats, 31 probably due to hyperglycemia. Taken together, we speculate that high Glu milieu may downregulate the COMT capacity for Q metabolism. This suggestion is also consistent with our previous study showing that high dietary fructose and saturated fat decreased the UGT capacity toward Q in female rats. 32
Phase II enzymes mediate the biotransformation of polyphenols to facilitate their elimination from the body, but are subject to the regulation by these substrates. For example, luteolin inhibited the expression of phase II enzymes by modulating the AhR and Nrf2 pathways, 24 and genistein activated the expression and activity of phase II enzymes in mice. 22 In this study, we found that C3G alone at the highest dose apparently had an inhibitory effect on phase II enzymes toward Q. Similar to the negative influence of high Glu milieu, C3G had the largest impact on production of M4 among the four main metabolites, 23 suggesting that this anthocyanin might inhibit COMT activity and/or the expression. While they are in different flavonoid subclasses than C3G, epigallocatechin gallate and Q have been found to inhibit the COMT activity. 33
Interestingly, we did not see any interaction between C3G and HiGlu on the production of Q metabolites, which is opposite to our original hypothesis that C3G as a potent antioxidant should have a modulating effect on the HiGlu-induced changes in phase II enzymes. We also anticipated that administration of SOD and CAT would ameliorate the HiGlu-induced changes in phase II enzymes toward Q. However, the addition of the antioxidants exaggerated the Glu effect on the production of Q metabolites. While the mechanism(s) for these unexpected results remains to be examined, the larger reduction in Q content in the medium and inside the cells than the condition of HiGlu or HiGlu plus C3G implicates occurrence of Q degradation promoted by these two antioxidant enzymes.
There are several limitations in our study. First, we did not determine whether generation of ROS was altered by the study treatments, even though the increase was demonstrated in our previous study. 21 We administered antioxidants, either C3G or SOD plus CAT, to ameliorate oxidative stress induced by HiGlu, but we were uncertain whether their addition would yield the anticipated antioxidant protection. Second, the activity or protein of phase II enzymes, for example, UGT1A1 and UGT1A7 and COMT, 11 primarily responsible for Q metabolism, were not assessed. Their determination would have provided valuable information to help interpret the study results that the production of Q metabolites was decreased by all study conditions. Third, an inhibitor, for example, tolcapone or entacapone, 34 to antagonize COMT activity might have been employed to reveal whether this enzyme is responsible for the formation of M4, since this metabolite was predominantly decreased by the study treatments.
Low bioavailability and extensive metabolism mediated by the phase II enzymes may impede achievement of the maximum health benefits of flavonoids. The capacity of the phase II pathway is subject to the influence of a wide range of physiological and environmental factors. We examined the impact of a high Glu milieu with and without either C3G or SOD plus CAT on Q metabolism in cultured HepG2 cells. We found that all of the study conditions significantly decreased the production of Q metabolites, particularly the ones with methylated conjugates. This outcome nullified our hypothesis that a high Glu milieu would enhance the production of ROS, which upregulates the phase II pathway. In conclusion, Q metabolism is downregulated by hyperglycemia and C3G in HepG2 cells.
Footnotes
Acknowledgments
Supported by the Ministry of Agriculture, Forestry, and Fisheries in Japan and the U.S. Department of Agriculture (USDA)/Agricultural Research Service under Cooperative Agreement No. 1950-51000-087. The contents of this publication do not necessarily reflect the views or policies of the USDA nor does mention of trade names, commercial products, or organizations that imply endorsement by the U.S. government.
Author Disclosure Statement
No competing financial interests exist.
References
Supplementary Material
Please find the following supplemental material available below.
For Open Access articles published under a Creative Commons License, all supplemental material carries the same license as the article it is associated with.
For non-Open Access articles published, all supplemental material carries a non-exclusive license, and permission requests for re-use of supplemental material or any part of supplemental material shall be sent directly to the copyright owner as specified in the copyright notice associated with the article.