




Abstract
Esophageal cancer (EC) is commonly diagnosed in South Africa (SA), with high incidences occurring in SA's black population. Moringa oleifera (MO), a multipurpose tree, is used traditionally for its nutritional and medicinal properties. It has been used for the treatment of a variety of ailments, including cancer. We investigated the antiproliferative effect of MO crude aqueous leaf extract (MOE) on a cancerous esophageal cell line (SNO). SNO cells were exposed to a range of MOE dilutions to evaluate cytotoxicity (MTT assay). Oxidative stress was determined using the TBARS assay. The comet assay was used to assess DNA damage. We then determined cell death mechanisms by measuring phosphatidylserine (PS) externalization (flow cytometry), caspase-3/7 and caspase-9 activities, and adenosine triphosphate (ATP) levels (luminometry). Protein expression of Smac/DIABLO and PARP-1 was determined by western blotting. SNO cells were treated with a range of MOE dilutions to obtain an IC50 value of 389.2 μg/mL MOE (24 h), which was used in all subsequent assays. MOE significantly increased lipid peroxidation (P < .05) and DNA fragmentation (P < .0001) in SNO cells. The induction of apoptosis was confirmed by the increase in PS externalization (P < .0001), caspase-9 (P < .05) and caspase-3/7 (P = .22) activities, and decreased ATP levels (P < .0001). MOE significantly increased both the expression of Smac/DIABLO protein and cleavage of PARP-1, resulting in an increase in the 24-kDa fragment (P < .001). MOE possesses antiproliferative effects on SNO EC cells by increasing lipid peroxidation, DNA fragmentation, and induction of apoptosis.
Introduction
C
The incidence of EC in black South Africans is suggested to be associated with a high intake of linoleic acid via maize consumption. 6 Sammon and Alderson 8 in 1998 showed that linoleic acid increases prostaglandin E2 (PGE2) levels, which inhibit gastric acid secretion and affect pyloric and esophageal sphincters. This causes hypochlorhydric duodenogastro-esophageal reflux altering pH levels, rendering inhibition of protease activity and function and nonbreakdown of growth factors. This may contribute to carcinogenesis as cell signal transduction increases causing cell proliferation and tumor progression.
Studies on high EC risk populations have shown that individuals from the rural areas in Transkei and KwaZulu-Natal (South Africa) have poorer diets and lack basic healthcare. 9 They often rely on traditional plants, which are readily available as food sources and used for the treatment of various ailments, including cancer. Moringa oleifera (MO; Family: Moringaceae) commonly known as the drumstick tree is indigenous to India and also found throughout SA. 10 –12 Almost all parts of the tree possess nutritional and medicinal properties; however, the leaves are suggested to contain the highest vitamins, minerals, iron, essential amino acids, and proteins. Several studies have shown that MO leaves possess antioxidant and anticancer properties and are used in the treatment of diabetes mellitus and liver diseases. 10,12,13 Phytochemical analysis showed the presence of bioactive compounds, such as flavonoids, glucosinolates, isothiocyanates, niazimicin, and gallic acid, which possess anticancer effects. 10 –12,14 Current cancer therapies are expensive and often lead to drug resistance; therefore, alternative, cost-effective, traditional-based treatment is being investigated. This study investigated the antiproliferative effect of MO crude aqueous leaf extract on cancerous esophageal SNO cells.
Materials and Methods
Materials
MO leaves were collected from the KwaZulu-Natal region (Durban, South Africa) and verified by the herbarium (batch no. CT/1/2012, genus no. 3128). SNO cells were purchased from Highveld Biologicals. Cell culture reagents were purchased from Whitehead Scientific. ECL-LumiGlo® Chemiluminescent Substrate Kit was purchased from Gaithersburg, and western blot reagents were purchased from Bio-Rad. All other reagents were purchased from Merck.
Leaf extract
The MO leaf extract (MOE) was prepared by crushing 10 g of air-dried leaves in a mortar and pestle with subsequent addition of 100 mL deionized water. 15 –17 The resultant extract was boiled with continuous stirring (20 min), transferred to 50-mL conical tubes, and centrifuged (720 g for 10 min at room temperature [RT]). The upper aqueous layer (MOE) was removed, lyophilized, and stored (4°C). MOE stock solution was prepared (1 mg MOE in 1 mL complete culture media [CCM]) and filter sterilized (0.22-μM filter [Millipore]).
Cell culture and exposure protocol
SNO cells were cultured in 25-cm3 culture flasks (37°C and 5% CO2) in CCM comprising Eagle's minimum essential medium supplemented with 10% fetal calf serum, 1%
Cell viability assay
SNO cell viability was determined using the 3-(4,5-dimethyl-2-thiazolyl)-2,5-diphenyl-2H-tetrazolium bromide (MTT) assay. 19 SNO cells (15,000 cells/well) were seeded into a 96-well microtiter plate. The cells were incubated with varying MOE dilutions (0.1–10 mg/mL) in 6 replicates (300 μL/well) and incubated (37°C and 5% CO2) for 24 h. Control cells were incubated with CCM only. A CCM/MTT salt solution (5 mg/mL) was added (120 μL/well), and the plate was incubated (37°C for 4 h). Thereafter, supernatants were removed; 100 μL dimethyl sulfoxide (DMSO)/well was added and incubated (1 h). The optical density of the formazan product was measured (570/690 nm) using a spectrophotometer (Bio-Tek μQuant). The results were expressed as percent cell viability relative to the control. This experiment was repeated on 2 separate occasions before the concentration of half the maximum inhibition (IC50) of MOE for the cell line was determined.
Lipid peroxidation—quantification of malondialdehyde
The thiobarbituric acid (TBARS) assay was used to assess reactive oxygen species (ROS) by measuring malondialdehyde (MDA), end product of lipid peroxidation. 20 Following treatment, cells were lysed in 0.2% H3PO4 (100 μL) by passing the cell solution through a 25-gauge needle at least 25× and was transferred to test tubes with addition of 2% H3PO4 (200 μL), 7% H3PO4 (400 μL), and TBA/BHT solution (400 μL). A positive control of MDA and a negative control of CCM were prepared. All samples were adjusted to pH 1.5 and heated (100°C for 15 min). After cooling, butanol (1.5 mL) was added, vortexed, and allowed to separate into distinct phases. The upper butanol phase (800 μL) was transferred into eppendorfs and centrifuged (17,949 g for 6 min at RT). Hundred microliters from each sample was added to a 96-well microtiter plate in 6 replicates. The optical density was measured on a spectrophotometer (532/600 nm). The mean optical density was calculated, divided by the absorption coefficient (156 mM−1), and expressed in μM.
DNA damage
DNA damage was determined using the comet assay. 21 Three slides per sample were prepared as the first layer of 1% low melting point agarose (LMPA, 37°C), the second layer of 25 μL of cells (20,000) from the samples with 175 μL 0.5% LMPA (37°C), and the third layer of 0.5% LMPA (37°C) covered the slides. After solidification, the slides were then submerged in cold lysing solution (2.5 M NaCl, 100 mM EDTA, 1% Triton X-100, 10 mM Tris [pH 10], and 10% DMSO) and incubated (4°C for 1 h). Following incubation, the slides were placed in an electrophoresis buffer (300 mM NaOH and 1 mM Na2EDTA [pH 13]) for 20 min and thereafter subjected to electrophoresis (25 V for 35 min at RT) using Bio-Rad compact power supply. The slides were washed 3× with a neutralization buffer (0.4 M Tris [pH 7.4]) (5 min each). The slides were stained overnight (4°C) (40 μL ethidium bromide [EtBr]) and viewed with a fluorescent microscope (Olympus IXSI inverted microscope with 510- to 560-nm excitation and 590-nm emission filters). Images of 50 cells and comets were captured per treatment, and the comet tail lengths were measured using Soft imaging system (Life Science—©Olympus Soft Imaging Solutions v5) and expressed in μm.
Assessment of phosphatidylserine externalization
The annexin-V-FLUOS assay (Roche) was used to detect phosphatidylserine (PS) externalization, an early marker of apoptosis. Hundred microliters of each sample (1,000,000 cells/tube) was transferred to polystyrene flow cytometry tubes, stained with 100 μL annexin-V-FLUOS labeling solution, and incubated in the dark (15 min at RT). Four hundred microliters of annexin-V binding buffer (1×) was added, and the labeled cells were detected by fluorescence-activated cell sorting Calibur flow cytometer (BD Biosciences). The cells were gated to exclude cellular debris using FlowJo v7.1 software (Tree Star, Inc.). Approximately 50,000 events were obtained, and the data were analyzed using CellQuest PRO v4.02 software (BD Biosciences). The data were expressed as relative fold change.
ATP quantification
The CellTiter-Glo® assay (Promega) was used to quantify adenosine triphosphate (ATP) levels. SNO cells (20,000 cells/well) were seeded into an opaque polystyrene 96-well microtiter plate in 6 replicates. Following treatment, the CellTiter-Glo Reagent 2X was prepared according to the manufacturer's guidelines, and 100 μL of the reagent was added per well. The plate was then incubated in the dark (30 min at RT). Following incubation, the plate was read on the Modulus™ microplate luminometer. The data were expressed as RLU and fold change.
Caspase-3/7 and caspase-9 activities
Caspase-Glo® 3/7 and Caspase-Glo® 9 assays (Promega) were used to assess apoptosis. For each assay, the same procedure was followed: SNO cells were seeded into an opaque polystyrene 96-well microtiter plate in 6 replicates. Following treatment, the Caspase-Glo 3/7 and Caspase-Glo 9 reagents were prepared according to the manufacturer's guidelines. Hundred microliters of the reagent was added per well and incubated in the dark (30 min at RT). Following incubation, the luminescence was measured on a Modulus microplate luminometer. The data were expressed as RLU and fold change.
Western blotting
Western blotting assessed Smac/DIABLO and PARP-1 protein expression. Briefly, total protein was isolated using CytoBuster™ reagent supplemented with protease inhibitor (catalog no. 05892791001; Roche) and phosphatase inhibitor (catalog no. 04906837001; Roche). The bicinchoninic acid assay (Sigma) was used for protein quantification and was standardized to 1 mg/mL. 22 The samples were prepared in Laemmli buffer, 23 boiled (100°C for 5 min), and electrophoresed (150 V for 1 h) in 7.5% sodium dodecyl sulfate–polyacrylamide gels using Bio-Rad compact power supply. The separated proteins were electrotransferred to nitrocellulose membrane using the Trans-Blot® Turbo Transfer System (Bio-Rad) (20 V for 45 min). The membranes were blocked (1 h) using 3% bovine serum albumin in Tris-buffered saline (TTBS—NaCl, KCl, Tris, Tween 20, and dH2O, pH 7.4). Thereafter, the membranes were immune probed with primary antibody (Smac/DIABLO [ab68352], 1:200, and PARP-1 [ab110915], 1:1000) at 4°C overnight. The membranes were washed 4× (TTBS, 10 min each) and incubated with secondary antibody (mouse [ab97046], 1:2000, and rabbit [sc-2004], 1:10,000) at RT (1 h). The membranes were washed 4× (TTBS, 10 min each). To correct for loading error and normalize protein expression, β-actin was assessed (ab8226; 1:2000). Horseradish peroxidase chemiluminescence detector and enhancer solution were used, and the signal was detected with Alliance 2.7 image documentation system (UViTech). Protein expression was analyzed with UViBand Advanced Image Analysis software (UViTech, v12.14). The data were expressed as relative band density (RBD) and fold change.
Statistical analyses
Statistical analyses were performed using GraphPad Prism v5.0 software (GraphPad Software, Inc.). The results are expressed as mean ± standard error of the mean (SEM). The statistical significances were determined by Student's t-test with 95% confidence interval. The data were considered statistically significant with a value of P < .05.
Results
Cell viability assay
The MTT assay was used to assess SNO cell viability after exposure to MOE. At higher doses, at a range of 0.5–10 mg/mL, MOE was more effective as it significantly reduced viability of SNO cells (Fig. 1B, P < .0001). MOE induced a dose-dependent decline in cell viability, and an IC50 value of 389.2 μg/mL was obtained and used in all subsequent assays (Fig. 1A).
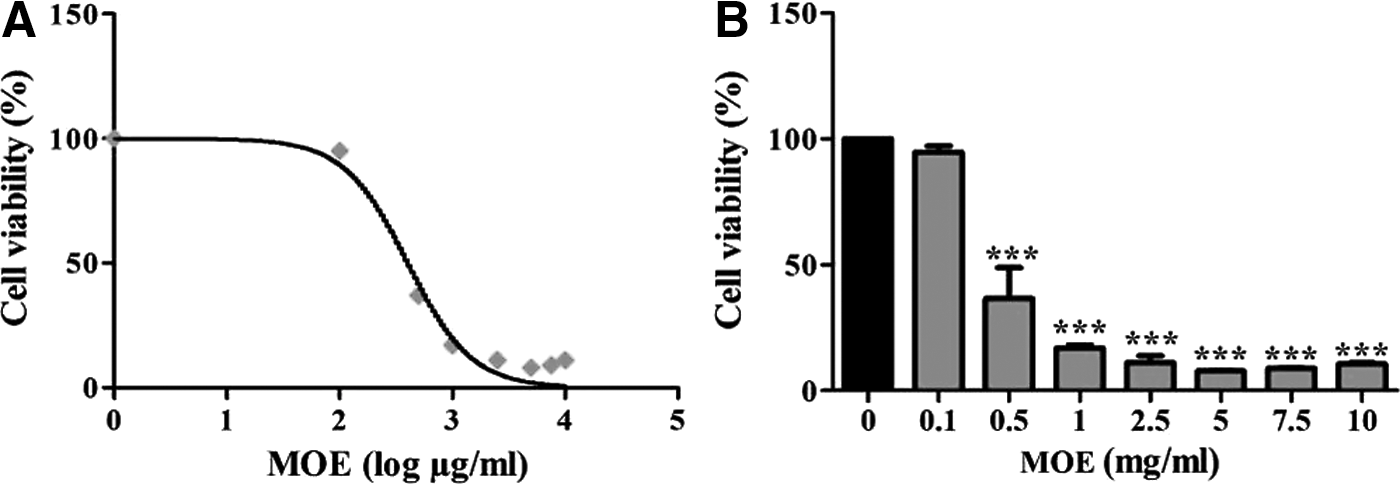
Percent SNO cell viability after exposure to MOE for 24 h
Lipid peroxidation
The TBARS assay was used to measure MDA levels. A significant increase in MDA levels was seen in the MOE treatment (0.09 ± 0.01 μM vs. control: 0.07 ± 0.00 μM; *P < .05) (Fig. 2).

Lipid peroxidation in SNO cells after exposure to MOE for 24 h (*P < .05).
DNA damage
The comet assay showed that MOE significantly increased DNA fragmentation in SNO cells. The comet tail length in MOE treatment compared to the untreated control was significantly longer (Fig. 3; 46.09 ± 0.77 vs. 21.44 ± 0.36; ***P < .0001).
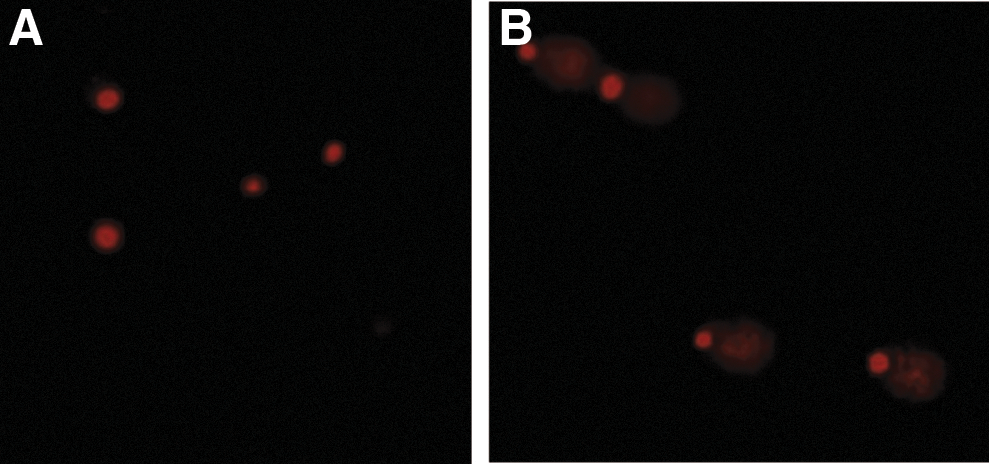
Comet assay images of control
Assessment of apoptosis
The effect of MOE on apoptotic markers, that is, PS externalization, caspase activity, and ATP levels, was determined and presented in Table 1.
P < .0001, * P < .05: significantly different compared to the control.
ATP, adenosine triphosphate; MOE, MO leaf extract; PS, phosphatidylserine; RLU, relative light units; SEM, standard error of the mean.
A significant increase in PS externalization was seen in the MOE-treated cells. In addition, an increase in caspase-9 (1.12-fold) and caspase-3/7 (1.09-fold) activities was noted. There was a significant 1.39-fold decrease in cellular ATP levels in the MOE treatment compared to the untreated control.
Western blotting
The protein levels of Smac/DIABLO and PARP-1 were assessed using western blotting (Fig. 4).
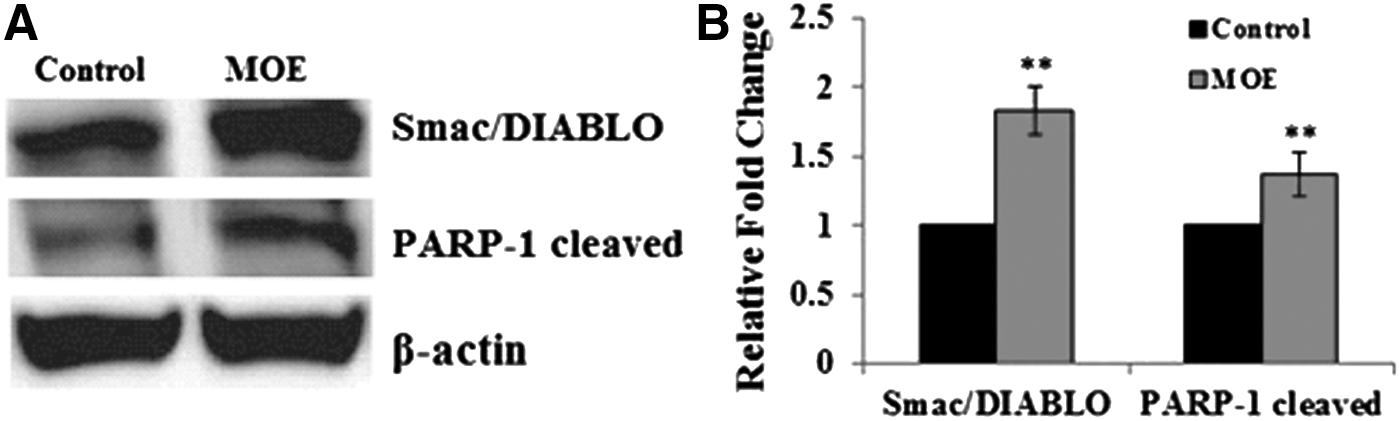
Protein levels
A 1.82-fold increase in Smac/DIABLO levels in the MOE-treated SNO cells was seen (0.45 ± 0.03 RBD vs. control: 0.25 ± 0.02 RBD, **P < .001) (Fig. 4). In addition, there was a 1.37-fold increase in the levels of cleaved PARP-1 (24-kDa fragment) (0.17 ± 0.01 vs. control: 0.13 ± 0.00, **P < .001) (Fig. 4).
Discussion
The balance between cell proliferation and apoptosis is critical for cellular homeostasis. 24 Often in disease states, there is aberration in apoptosis potentially leading to carcinogenesis. EC is one of the leading causes of cancer mortality 1 in SA. MOE is used traditionally throughout SA for the treatment of various ailments, including cancer. 10 Therefore, this study investigated the antiproliferative effect of MO crude aqueous leaf extract on SNO EC cells.
ROS are countered in cells by the production of antioxidants; however, ROS overproduction results in oxidative stress. 25 A chronic increase in oxidative stress has been implicated in damage to proteins, lipids, and DNA. Free radicals react with polyunsaturated fatty acids causing lipid peroxidation and damage to cellular membranes. MOE significantly increased ROS levels evidenced by lipid peroxidation in SNO cells (Fig. 2). Cancer cells have higher metabolic activity 26 ; therefore, exposure to compounds, such as MOE that contains polyphenols, may increase levels of ROS. Polyphenols present in MOE, such as gallic acid, possess pro-oxidant properties and have shown to induce apoptosis in cancer cell lines. 27 Chlorogenic acid, also a polyphenol present in MOE, caused ROS-induced apoptosis in K562 leukemia cells and human oral squamous cell carcinoma. 28 In addition, highly reactive hydroxyl radicals target DNA and induce damage. 29 A significant increase in DNA fragmentation was observed in MOE-treated cells (Fig. 3).
The mitochondria is a source of ROS production.
30
High levels of ROS and oxidative DNA damage signal for apoptosis via the mitochondria (intrinsic apoptotic pathway). Mitochondrial release of cytochrome c (cyt c) into the cytoplasm forms an apoptosome with ATP and Apaf-1, causing the cleavage and activation caspase-9.
31
MOE proapoptotic action was confirmed with an increase in caspase-9 (P < .05) and caspase-3/7 (P = .22) activities and a decrease in ATP levels (P < .0001) (Table 1), suggesting that MOE induces SNO cell death via the intrinsic pathway. Studies have shown that MOE possesses anticancer properties and induces apoptosis in various cancer cell lines.
12,13
MOE phytochemical composition showed that it abundantly contains glucosinolates, flavonoids, and phenolic acids.
32
In addition, it also contains niazimicin, 4-(α-
PARP-1 is a DNA repair-associated enzyme that maintains genome integrity. 35 When apoptosis occurs, the effector caspase-3/7 is responsible for cleavage of PARP-1 into an 89- and 24-kDa fragment inhibiting its repair mechanism and cell survival function. 35,36 MOE caused cleavage of PARP-1 with a significant increase in the 24-kDa fragment (Fig. 4). This again shows MOE apoptosis inducing effect on SNO cells. The 24-kDa fragment (DNA binding domain) irreversibly binds to DNA strand breaks, preventing repair, ultimately committing to cell death.
Furthermore, Smac/DIABLO is concurrently released from the mitochondria, which prevents inhibitor of apoptosis protein (IAP) from halting the apoptotic machinery. Smac/DIABLO protein levels were significantly increased (Fig. 4), thus allowing the execution of apoptosis. Chlorogenic acid induced ROS production with subsequent release of cyt c and Smac/DIABLO from the mitochondria in K562 leukemia cells leading to apoptosis. 28 Similarly in SNO cells, the significant increase in expression may be attributed to chlorogenic acid that is present in the crude extract. In addition, MOE increased PS externalization (2.52-fold) from the inner leaflet to the outer plasma membrane. 37
Charoensin 34 in 2014 showed that MOE possesses antiproliferative properties in HepG2, MCF-7, and fibroblast cells and induced quinone reductase activity, an anticarcinogenic phase II enzyme. In addition, MOE decreased NFkB signaling and synergistically acted with cisplatin to cause cytotoxicity in pancreatic cancer cells. 38 Studies suggest that the intake of MOE is safe below 2 g/kg body weight. 39 Further analysis conducted on the SNO cells treated with MOE over a longer time, 48 and 72 h, also showed a dose-dependent decline in cell viability (data not shown). Therefore, MOE antiproliferative effect on SNO cells can be attributed to its phytochemical composition.
MOE exerts an antiproliferative effect on SNO cells by inducing the intrinsic apoptotic pathway. The study shows a possible use of MOE in the treatment of EC. However, phytochemical analysis to identify bioactive compounds will ascertain the antiproliferative effect.
Footnotes
Acknowledgments
Miss C. Tiloke acknowledges the prestigious doctoral scholarship from the National Research Foundation, South Africa. The study was also supported by the funds from the College of Health Sciences (UKZN).
Author Disclosure Statement
No competing financial interests exist.