
Abstract
The aim of the present study was to evaluate the synergic effect of lycopene (LYC) treatment with a dietary control in a nonalcoholic fatty liver disease (NAFLD) model induced with a high-fat diet (HFD). Sprague–Dawley rats were fed during 4 weeks with a normal diet (ND·4w) or an HFD (HFD·4w) to produce an NAFLD model. Then, rats from the ND·4w group continued during 4 weeks with the same diet (ND·8w), and rats from HFD were fed during 4 weeks with an ND (HFD·4w+ND·4w) or an ND plus LYC (HFD·4w+ND+LYC·4w). LYC (20 mg/kg) was administered daily by gavage. ND and ND+LYC diets partially reverted the following alterations due to HFD: liver weight, serum low-density lipoproteins (LDL), hepatic total cholesterol (TC), and catalytic activity of hepatic superoxide dismutase, catalase, and glutathione peroxidase, as well as macroscopic and microscopic images of livers. A higher recuperation to reach normality was obtained with ND+LYC in: liver weight, hepatic TC, serum LDL, and, in some instances, macroscopic and microscopic images of livers. Failures to recovery with both NDs were observed for malondialdehyde level and serum aspartate aminotransferase activity. Taken together, the results from this study suggest the potentially protective role of LYC against NAFLD; however, more clinical trials are needed to support this idea.
Introduction
T
Potential health benefits of lycopene (LYC) have been studied for more than 75 years. 7,13,14 In particular, experimental studies have shown that LYC supplementation effectively prevents the development of various liver injuries 15 : Animals were fed during several weeks with a high-fat diet (HFD) and supplemented with LYC, 16 –18 an LYC metabolite, 16,19,20 or tomato juice as a source of LYC, 21,22 to prevent diet-mediated steatosis, 16,18,22 diethylnitrosamine-initiated HFD-promoted hepatocarcinoma, 17,19,20 and a metabolic pattern from an HFD. 21
The aim of this study was to assess the ability of LYC to return liver steatosis and to revert hepatic morphological changes produced by an HFD. The use of LYC to treat liver steatosis is further suggested after finding that LYC concentrations in serum and liver were significantly decreased in NAFLD patients. 23
Materials and Methods
Animals and treatments
Male Sprague–Dawley rats (150–180 g) from Harlan Laboratories were individually housed in stainless cages under conditions of controlled temperature (25°C ± 3°C) with a 12 h/12 h day–night cycle. Rats were acclimatized for 1 week, with a normal diet and water ad libitum. Experiments on animals were performed in accordance with the Animal Care and Use protocol of the University of Queretaro, which is based on Official Guidelines for Animal Testing of the Mexican Official Norm (NOM-062-ZOO-1999).
Rats were randomly assigned into two experimental groups: (1) Normal diet group, integrated by 22 rats with free access to normal diet (Harlan Teklad Global 18% protein rodent diet, 2018) and water during 4 weeks (ND·4w); (2) HFD group formed by 34 rats fed ad libitum with an HFD 24 and water during 4 weeks (HFD·4w), to develop an NAFLD model. At the end of these 4 weeks, four animals from each group were used for histological studies and six animals were used for biochemical markers. The remaining 12 rats from the ND·4w group continued consuming the normal diet during 4 additional weeks, i.e., normal diet during the 8 weeks, (ND·8w). The HFD·4w group was divided into two subgroups: One of them (n = 12 rats) received normal diet during the next 4 weeks (HFD·4w+ND·4w), and the other (n = 12 rats) received normal diet plus 20 mg LYC (LycoVit® 10% DC; BASF The Chemical Company) per kg body weight (BW) during the next 4 weeks (HFD·4w+ND+LYC·4w). LYC was administrated orally by gavage once a day; the other two groups (ND·8w and HFD·4w+ND·4w) received only the vehicle (1:1 water/oil emulsion). This dose of LYC was chosen based on our previous studies in which serum activity of superoxide dismutase (SOD) significantly increased in rats receiving 20 mg LYC per kg BW during 14 days. 25
Oral sucrose tolerance test
Three days before the sacrifice, animals were set on fasting conditions for 12 h. Blood samples were collected from the tail vein after a sucrose (2 g/kg) solution was given by gavage. Blood was collected at 0, 30, 60, 90, 120, 150, and 180 min for a glucose tolerance test, with an Accu-Check® system (Roche).
Biological samples and liver collection
Twenty-four hours after the last dose of treatments, animals were anesthetized to withdraw blood samples by cardiac puncture and sacrificed. Blood samples were centrifuged at 3000 g at 4°C for 10 min, and serum was stored at −70°C. The liver was removed, rinsed, and weighted. Livers for histopathology analysis were prepared using conventional techniques, and livers for other analysis were immediately snap-frozen in liquid nitrogen and stored at −70°C.
Biochemical analysis in serum
Serum concentrations of total cholesterol (TC) and triglycerides (TG) were determined using commercial kits (ELI Tech); high-density lipoprotein cholesterol (HDL), low-density lipoprotein (LDL), aspartate aminotransferase (AST), and alanine aminotransferase (ALT) were determined using commercial kits (Spinreact).
Oxidative stress markers
For SOD, catalase (CAT), and glutathione peroxidase (GPx) enzymatic determinations, liver samples were homogenized in 50 mM phosphate buffer, pH 7, containing 0.5 mM EDTA and 0.5% Triton, using a Polytron (Kinematica) and centrifuged at 9000 g for 15 min at 4°C. The cytosolic homogenates were stored at −70°C. SOD activity was measured using a commercial kit (Sigma-Aldrich), according to McCord and Fridovich. 26 CAT and GPx activities were assayed by the methods of Aebi 27 and Paglia and Valentine, 28 respectively. Lipid peroxidation was determined by a thiobarbituric acid reaction (thiobarbituric acid reactive substances [TBARS]) with malondialdehyde (MDA). 29 Protein concentration in the cytosolic fractions was determined by the bicinchoninic acid protein assay (Pierce, Inc.) using BSA as a standard.
Measurement of liver TGs and cholesterol
TG and TC quantification in liver was according to Folch's method. 30 Briefly, tissue was homogenized with 2:1 chloroform–methanol mixture (v/v), agitated during 15–20 min in an orbital shaker, and filtrated. The solvent phase was washed with 4 mL of 0.9% NaCl solution, vortexed, and centrifuged at 2000 g. Chloroform phase containing lipids was evaporated under vacuum, and TG and TC were determined by an enzymatic method using commercial kits (ELI Tech).
Liver histopathology
For histologic studies, liver tissues were fixed with 10% phosphate-buffered neutral formalin during 24 h. Then, tissue slices were dehydrated, embedded in paraffin, cut, and stained using hematoxylin and eosin. The degree of histopathology lesions in liver was semiquantitatively determined using the classification of Brunt 31 : grade 0, no fat; grade 1, fatty hepatocytes occupying <33% of the hepatic parenchyma; grade 2, fatty hepatocytes occupying 33–66% of the hepatic parenchyma; and grade 3, fatty hepatocytes occupying >66% of the hepatic parenchyma. The same experienced pathologist, who was blinded to the experimental group, examined all liver biopsies.
Statistical analyses
Results were expressed as mean values ± standard error (SE) or standard deviation. Differences between ND·4w and HFD·4w groups were determined by the two-sample t-test or the rank-sum test (P < .05). Differences among treated groups were assessed by ANOVA followed by a comparison of means using the Tukey test (P < .05). A chi-square test was performed for analysis of steatosis grading for which the level of statistical significance was taken at P < .1.
Results
First stage: production of NAFLD with an HFD during 4 weeks
At the end of the 4-week first stage, BW was significantly higher in rats of the ND·4w group than in rats of the HFD·4w group (Table 1). Additionally, although no deaths occurred during the experiment, some rats from the HFD·4w group had an unhealthy appearance (their hair was lost around the neck, and it was standing up all along the back). Moreover, the liver weight was significantly higher in rats from the HFD·4w group, as compared with that from the ND·4w group (Table 1).
Values are expressed as mean ± SE of six rats in each group. The statistical differences between groups of rats were calculated by t-test or rank-sum test.
ND·4w, normal diet during 4 weeks; HFD·4w, high-fat diet during 4 weeks; TG, triglycerides; TC, total cholesterol; HDL, high-density lipoprotein; LDL, low-density lipoprotein; AST, aspartate aminotransferase; ALT, alanine aminotransferase; SOD, superoxide dismutase; CAT, catalase; GPx, glutathione peroxidase; MDA, malondialdehyde; SE, standard error.
Impaired glucose tolerance, which is an indicator of the risk to develop NAFLD, 32,33 was significantly detected as higher blood glucose level at initial, and 30, 60, 90, 120, 150, and 180 min after a sucrose charge in the HFD·4w group (Fig. 1). Similarly, a significant elevation of serum TG, TC, HDL, and LDL concentrations, as well as hepatic TG and TC contents, in comparison with the ND·4w group, were observed (Table 1).
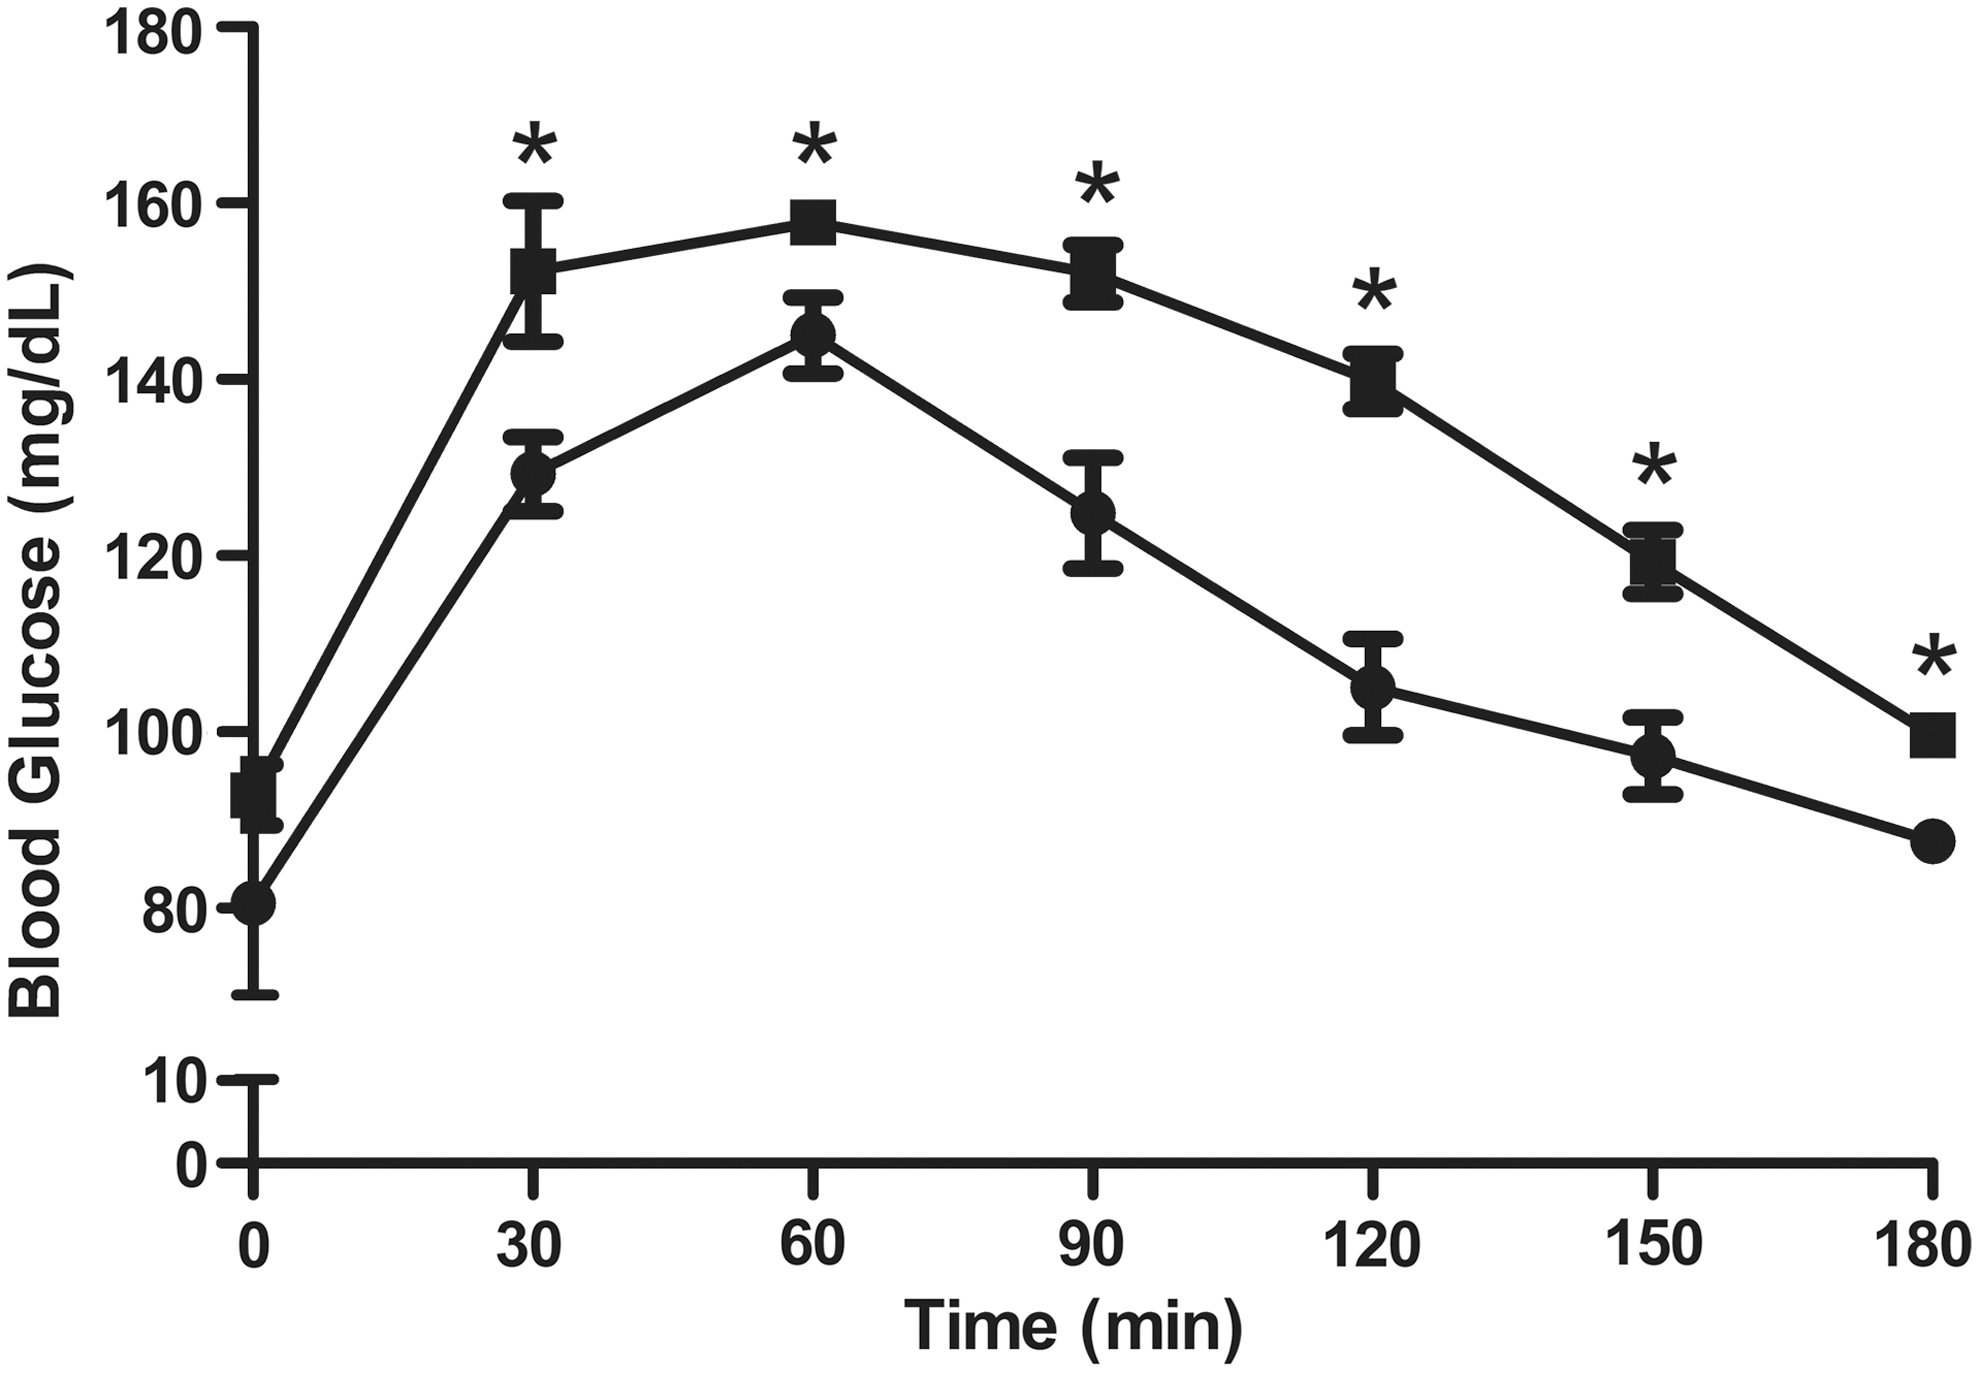
Glucose tolerance test of rats fed with ND·4w (●) or HFD·4w (■), and given 2 mg/kg of sucrose by gavage at zero time, as indicated in methods. All data are shown as the mean ± SE of six rats in each group. (*) Statistical differences between ND·4w and HFD·4w groups by t-test (P < .05). HFD, high-fat diet; SE, standard error.
The state of liver injury was also assessed by measuring ALT and AST in serum. The mean ALT activity was found to be significantly higher in the HFD·4w group than that in the ND·4w group (Table 1). As oxidative stress plays an important role in the progression of NAFLD, 12 we determined the hepatic activities of three antioxidant enzymes. Interestingly, significantly lower activities of SOD and GPx, as well as elevated levels of MDA, were recorded in the HFD·4w group compared with those of the ND·4w group (Table 1).
In addition to all these alterations, morphological changes in the liver were also evident. Macroscopic findings of livers from the HFD·4w group (Fig. 2d) were grossly larger, discolored, and fragile compared with those in the ND·4w group (Fig. 2a). Microscopic images of normal livers sections are presented in Figure 2b and c. Hepatocyte swelling and macrovesicular steatosis with numerous cytoplasmic vacuoles were observed in more than 90% of the hepatocytes (n = 4) from the HFD·4w group (Fig. 2e, f). The average steatosis grade was statistically different in the HFD·4w group when compared with that in the ND·4w group (Table 2).
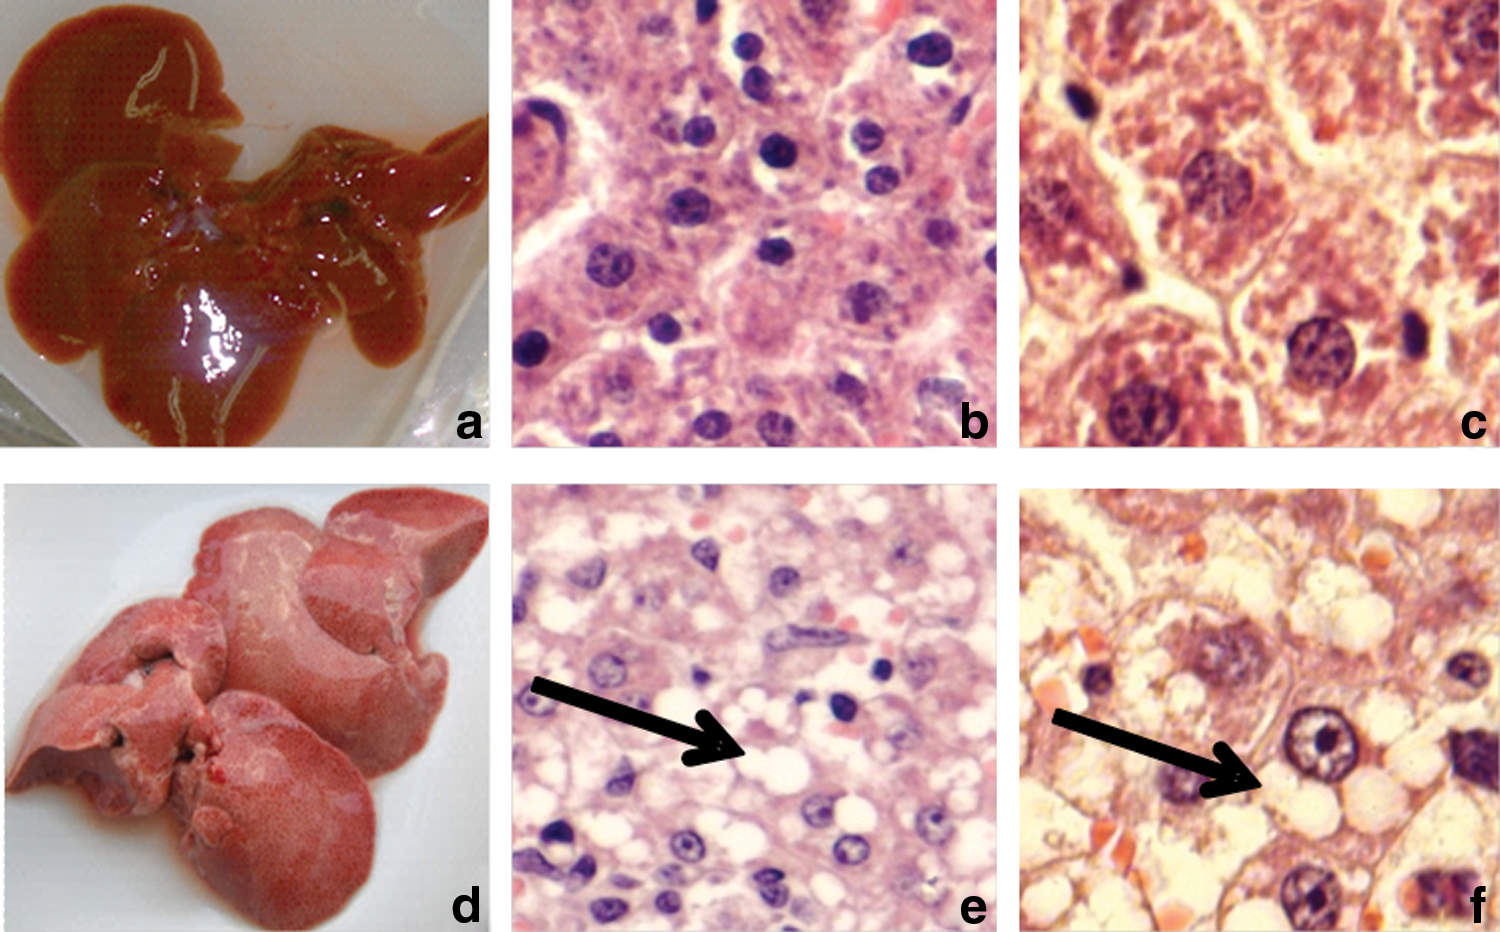
Macroscopic appearance of livers from ND·4w group
Scoring of hepatic steatosis is according to Brunt 31 classification.
The statistical differences between ND·4w and HFD·4w groups were analyzed by chi-square test (P < .1).
The statistical differences among ND·8w and HFD·4w+ND·4w or HFD·4w+ND+LYC·4w groups were analyzed by chi-square test (P < .025).
ND·4w, normal diet during 4 weeks; HFD·4w, high-fat diet during 4 weeks; ND·8w, normal diet during 8 weeks; HFD·4w+ND·4w, high-fat diet during 4 weeks and normal diet during the next 4 weeks; HFD·4w+ND+LYC·4w, high-fat diet during 4 weeks and normal diet plus LYC during the next 4 weeks; n, number of rats in each group; LYC, lycopene.
All data included in Table 1 and Figures 1 and 2 indicate that rats from the HFD·4w group imitated the findings observed in human NAFLD.
Second stage: recovery of NAFLD with diet alone or diet plus LYC
A single diet allowed a complete BW recuperation of damaged rats, and LYC supplementation did not represent any extra benefit, neither in food intake (Table 3). Nonetheless, LYC addition to a normal diet enabled a complete reestablishment of liver weight, a fact that was not observed with ND alone (Table 3). In regard to appearance of insulin resistance, similar fasting glucose levels and glucose peaks were observed in both groups of rats after the additional 4 weeks of ND (Fig. 3).
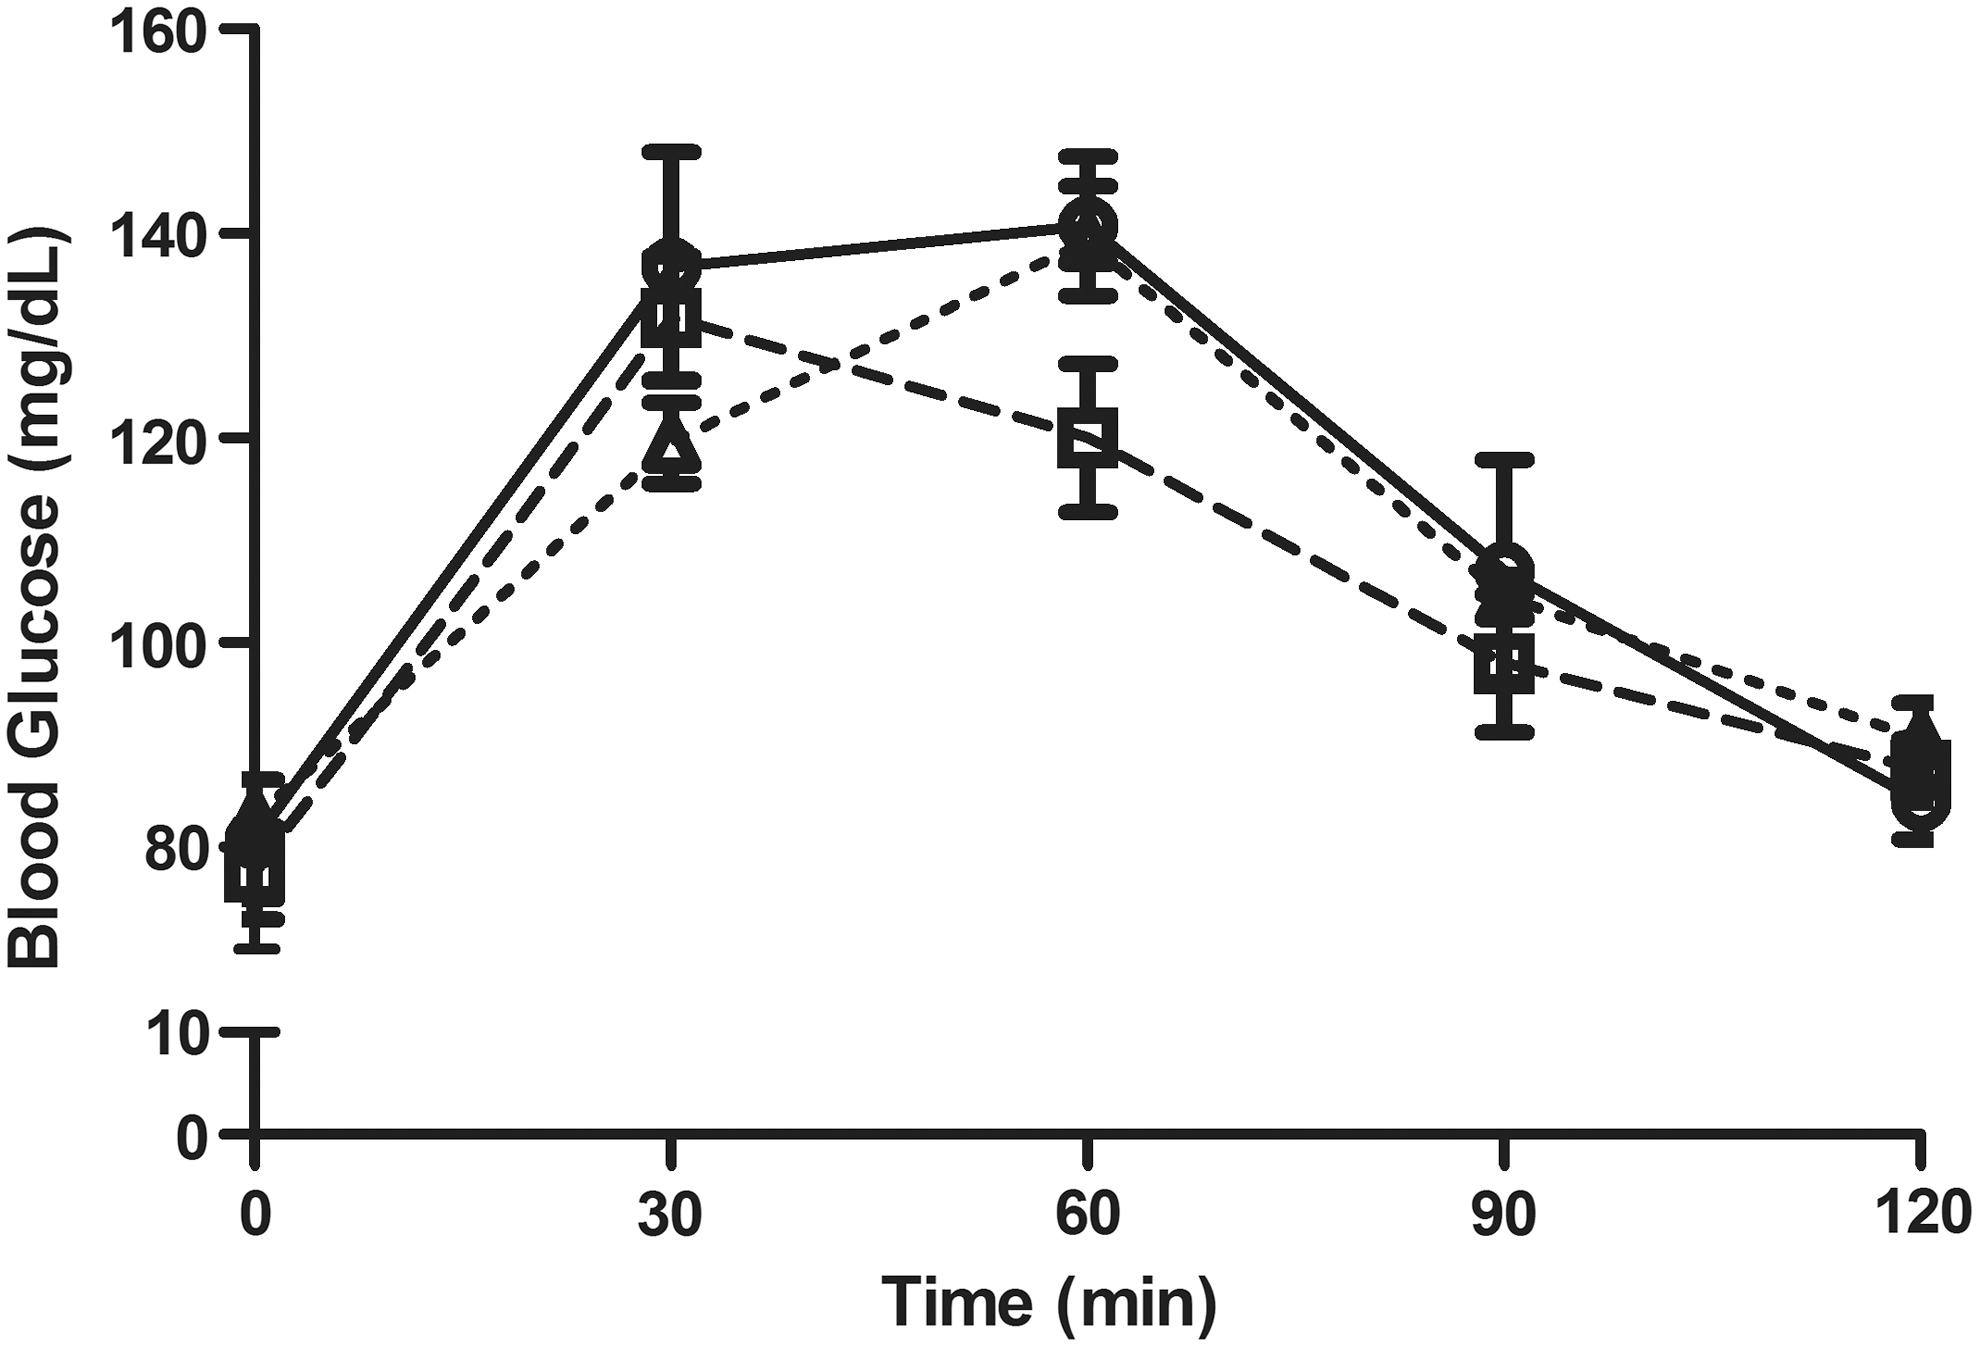
Glucose tolerance test in rats fed with ND·8w (○; solid line), HFD·4w+ND·4w (□; dashed line), and HFD·4w+ND+LYC·4w (Δ; dotted line), and given 2 mg/kg of sucrose by gavage at zero time, as indicated in methods. All data are shown as the mean ± SE of six rats in each group. LYC, lycopene.
Values are expressed as mean ± SE of six rats in each group. Different superscript letters within a row mean statistical significance among groups by Tukey test.
ND·8w, normal diet during 8 weeks; HFD·4w+ND·4w, high-fat diet during 4 weeks and normal diet during the next 4 weeks; HFD·4w+ND+LYC·4w, high-fat diet during 4 weeks and normal diet plus LYC during the next 4 weeks.
Serum lipids were lowered after feeding rats with ND and ND+LYC (Table 3). TC and HDL concentrations returned to normal values with either one or both diets, and TG values were even significantly lower than those obtained in the control group, i.e., ND·8w. Interestingly, LDL concentrations, which reached values as high as 346.3 mg/dL with HFD·4w (Table 1), showed a whole return to normal values (13.4 mg/dL) after feeding with the ND plus LYC; whereas in the absence of LYC, the obtained value did not reach normality (Table 3). In relation to hepatic lipid measurements (Table 3), TG values recovered similarly after feeding rats with the ND, independently of the presence of LYC. Furthermore, evidence shows recuperation to normal values of TC in the liver from rats receiving LYC, in comparison to the partial recuperation of rats not receiving LYC.
The elevated AST activity, recorded once rats acquired liver steatosis, did not return to normal values with either one or both diets; whereas ALT activity returned to normal values after rats were fed indistinctly with ND·4w or ND+LYC·4w (Table 3).
When normal diet was maintained in the ND·4w group, the hepatic activities of enzymes assayed as oxidative stress markers changed as follows: SOD activity was raised significantly, whereas CAT and GPx activities decreased significantly (Table 3). Changes in hepatic SOD, CAT, and GPx activities have been previously reported in accordance to the age of the rats 34 ; however, once HFD was switched to ND or ND+LYC, the activity of these enzymes increased. In the HFD·4w+ND·4w group, SOD and CAT activities remained below the values obtained in the LYC-treated group; whereas GPx values were higher than those detected in the other groups. In the HFD·4w+ND+LYC·4w group, SOD and GPx activities were comparable to those observed in the ND·8w group, whereas CAT activity was similar to that registered in the ND·4w group. Although MDA values increased with the development for steatosis, and remained constantly lower in the ND·8w group, they did not lessen after changing to ND·4w, either with or without LYC supplementation (Table 3), in spite of steatosis being decreased in livers of these rats, as described next.
After 4 weeks of the change of diet from HFD to ND, the macroscopic appearance changed from a discolored liver (Fig. 2d) to a more colored one with some discolored zones only in the HFD·4w+ND·4w group (Fig. 4d). The LYC supplementation to ND attained a complete macroscopic recovery of injured livers, which became characteristically red and brilliant (Fig. 4g). Switching to ND decreased from 90% of affected cells (Fig. 2e, f) to an average more than 50% in the hepatocytes of rats with ND (Fig. 4e, f), whereas the addition of LYC to ND allowed to reach values below 50% injured cells (Fig. 4h, i). Furthermore, in livers from the HFD·4w+ND·4w group, grade 2 steatosis was observed in three rats, and grade 3 steatosis was seen in three rats (Table 2). In the HFD·4w+ND+LYC·4w group, hepatic steatosis decreased, as one rat did not show steatosis, one rat presented grade 1 steatosis, two rats presented grade 2 steatosis, and the other two rats presented grade 3 steatosis. Average steatosis grade was statistically different among ND·8w and HFD·4w+ND·4w or HFD·4w+ND+LYC·4w groups (P < .025), and there was no statistically significant difference between HFD·4w+ND·4w and HFD·4w+ND+LYC·4w groups.
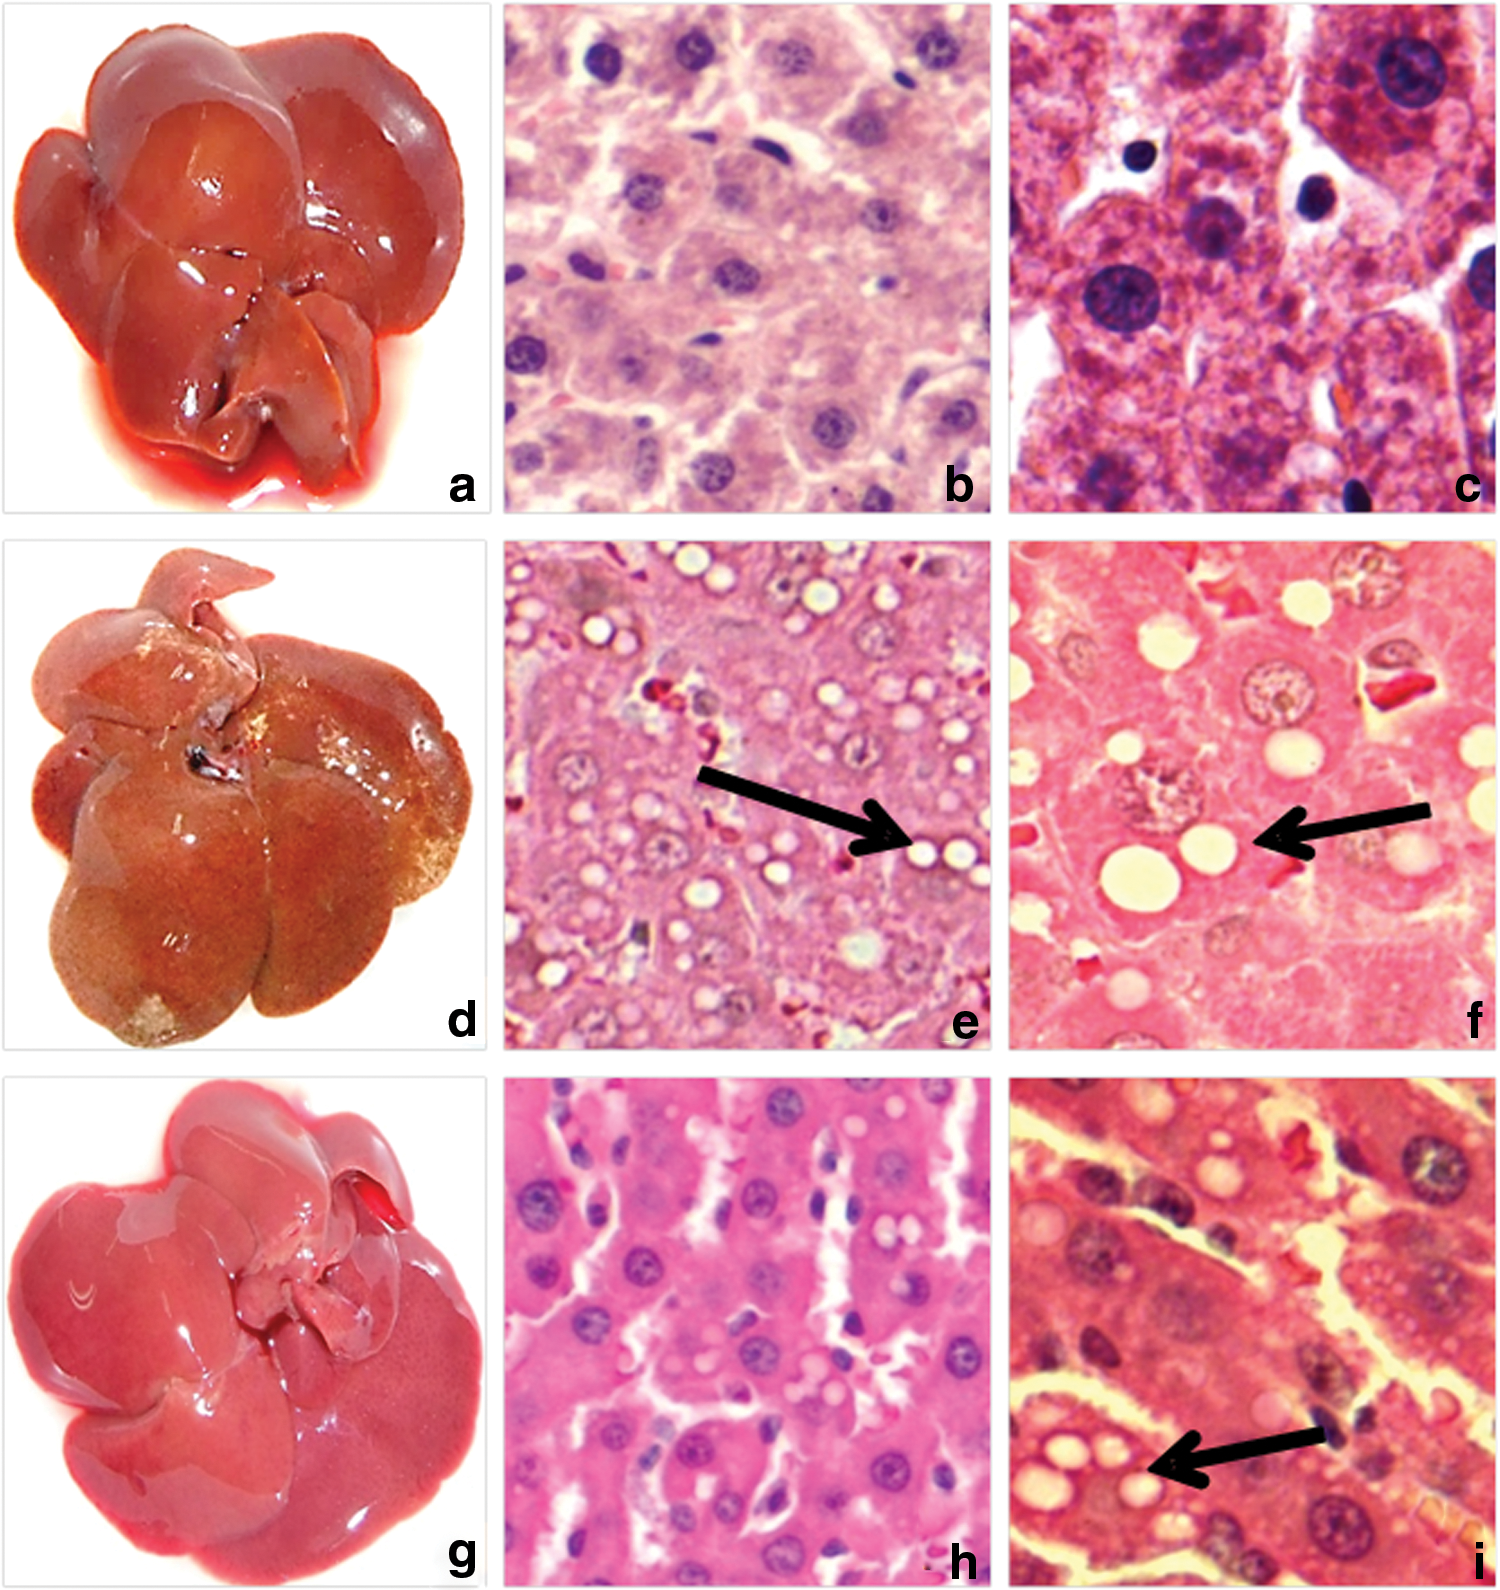
Macroscopic appearance of livers from ND·8w group
Discussion
All changes obtained in rats after 4 weeks of being fed with HFD are reported in results, and have been repeatedly found in previous studies, 16 –22,25 and allowed us to properly assay the therapeutic efficacy of ND plus LYC against ND alone.
Recuperation after switching to ND or ND+LYC was observed for the following indicators: BW and food intake (Table 3), insulin resistance (Fig. 3), serum TG, TC, HDL and ALT, and hepatic TG (Table 3). The general increase in catalytic activity of SOD, CAT, and GPx observed after switching to ND·4w or ND+LYC·4w is positive; nevertheless, given the recorded numbers for these activities (Table 3), it is hazardous to say which one of both diets provides superior results. The positive results obtained in these enzymes after reprogramming rats to ND alone are in complete accordance with other authors. 9 –11 In all studied cases, LYC supplementation did not impede the beneficial actions of ND alone. The only instance in which recovery was clearly better with ND alone is BW increase (Table 3).
Addition of LYC to normal diet resulted in a superior alleviation of HFD-mediated disturbances in liver weight, serum LDL, hepatic TC (Table 3), and macroscopic and microscopic abnormalities of rat livers (Fig. 4g–i). The complete normalization of LDL values after switching to ND+LYC·4w (Table 3) is of particular relevance, given the paramount role of LDL in cholesterol mobilization from liver. Such circumstances help to explain the entire normalization in hepatic TC, recorded also in the same group of rats (Table 3). Microscopic study, considered the gold standard for diagnosis and staging of NAFLD, 35 did not show a whole recuperation (Fig. 4e, f, h, i), but positive differences in favor of the presence of LYC are evident. This is the first report showing that the use of LYC added to a normal diet improves the recuperation from an NAFLD model, and not only prevents its development. 16,18,22
From all indicators of liver injury tested, only AST and hepatic MDA (Table 3) did not show any improvement with ND, single or combined with LYC. Most authors associate the beneficial actions of LYC to its well-known antioxidant properties. 17,36 –39 Our results heightening catalytic activity of SOD and GPx after feeding rats with ND plus LYC (Table 3) are in agreement with this point of view. Additionally, Hsu et al. 38 reported that administration of 3% and 9% of tomato paste, and an important source of LYC, during 8 weeks increased CAT activity in hamster livers. However, failure of ND and ND plus LYC to revert high MDA values was unexpected and contrary to a previous study showing the preventive effect of LYC supplementation (2 or 4 mg/kg BW) to increased MDA levels in serum and liver of rats fed an HFD during 6 weeks. 16 These limitations of LYC to normalize hepatic MDA (Table 3) argue for additional actions of the carotenoid, as those reported by Bernal et al., 21 who showed an LYC-mediated prevention of a metabolic pattern from an HFD. Besides, the action of LYC inducing protein synthesis, 18,19,22 a topic not studied in the present work, cannot be neglected. Further work is required to experimentally analyze these possibilities.
At present, lifestyle intervention with special emphasis on diet excellence remains the standard of therapeutic approaches to reduce steatosis. Results in this article highly suggest the incorporation of LYC into balanced diets to evaluate the advantages in a further clinical study. The results obtained in the present work might be of major relevance to the public health burden since the use of bioactive compounds, as adjunctive therapy to lifestyle modification, seems to be crucial for the treatment of NAFLD.
Footnotes
Acknowledgment
The authors are grateful to The National Council of Science and Technology, Mexico (CONACYT) for contributing a scholarship grant for R.M.P.Z.
Author Disclosure Statement
No competing financial interests exist.