
Abstract
This study investigated the dose- and time-dependent effects of caffeine consumption throughout puberty in peripubertal rats. A total of 85 male SD rats were randomly divided into four groups: control and caffeine-fed groups with 20, 60, or 120 mg/kg/day through oral gavage for 10, 20, 30, or 40 days. Caffeine decreased body weight gain and food consumption in a dose- and time-dependent manner, accompanied by a reduction in muscle and body fat. In addition, it caused a shortening and lightening of leg bones and spinal column. The total height of the growth plate decreased sharply at 40 days in the controls, but not in the caffeine-fed groups, and the height of hypertrophic zone in the caffeine-fed groups was lower than in the control. Caffeine increased the height of the secondary spongiosa, whereas parameters related to bone formation, such as bone area ratio, thickness and number of trabeculae, and bone perimeter, were significantly reduced. Furthermore, serum levels of IGF-1, estradiol, and testosterone were also reduced by the dose of caffeine exposure. Our results demonstrate that caffeine consumption can dose- and time-dependently inhibit longitudinal bone growth in immature male rats, possibly by blocking the physiologic changes in body composition and hormones relevant to bone growth.
Introduction
T
The purpose of this study was to investigate the effects of a range of caffeine doses on parameters of bone growth and maturation in prepubertal male rats during their growth spurt and to determine the lowest dose and duration with negative effects on longitudinal bone growth. In addition, the effects of caffeine on serum levels of hormones, such as IGF-1, estradiol, and testosterone, which are important endocrine factors in the pubertal growth spurt, were evaluated.
Materials and Methods
Animals
Eighty-five immature male Sprague-Dawley rats were obtained at 17 days of age with their mothers from Samtako Biokorea and were allowed to acclimate under controlled humidity (40–50%), temperature (22–24°C), and light conditions (12-h light–12-h dark cycle). Animal care was consistent with institutional guidelines, and the Hanyang University ACUC committee approved all procedures involving animals (HY-IACUC-2013-0110A). All animals were housed individually the day after weaning at 21 days of age and were fed standard rat chow ad libitum. The experiment was started when the rats were 22 days of age, as postnatal day (PD) 22–25, which is considered the beginning of puberty in rats. 10,11
Experimental design
A baseline group (n = 5) (CT0) was killed at the beginning of the experiment (21 days of age). Then, 20 animals were assigned to each of four groups based on their mean body weights for an even distribution, eliminating variation in mean body mass among the groups. The average initial body weight for each group was CT, 58 ± 5.3; CF1, 57.7 ± 4.8; CF2, 57.7 ± 4.7; and CF3, 57.9 ± 4.4g. Caffeine (Sigma-Aldrich) was dissolved in distilled water with 10 mL/kg calculated to deliver 20, 60, or 120 mg/kg body weight/day (designated as CF1, CF2, or CF3, respectively) and administrated by gavage to ensure complete consumption of the established daily dose. The control (CT) group received distilled water. Five animals from each group were killed at 10, 20, 30, or 40 days. Treatment duration of 10–40 days was selected at the time of rapid skeletal growth period of puberty (from 22 to 62 days old) in rats. 11 The choice of dose levels was based on literature data coupled with preliminary dose–response studies to avoid sublethal effects at the top dose level. 8,9 The median lethal dose of caffeine administered orally to rats is known to be 192 mg/kg. 12 The highest dose (120 mg/kg) was chosen in this study based on the study, which showed no renal toxicity and demonstrated inhibition of long bone growth in prepubertal rats. 13 Thus, the highest dose in the study was chosen to investigate the effect of caffeine on longitudinal bone growth in a time-dependent manner within the safe range of renal toxicity. The other two doses (20 and 60 mg/kg) were employed to determine whether the effects noted at the 120 mg dose were present in a dose-related manner. We chose 20 mg/kg as the lowest dose. Although 30 mg/kg/day of exposure in pregnant rats has been reported to be a safe level for fetal development, 14 plasma levels of caffeine are not always indicative of the exposure to a specific organ. Thus, a lower dose at 20 mg/kg was selected. Taking into account species differences in caffeine deposition, the dose of 20 mg/kg was comparable with human consumption of ∼2 cups of coffee daily.
Body surface area (BSA)-based dose calculations from animals to humans are more appropriate than those based on body weight. 15 Using BSA for dose conversion [the dose conversion correlation between humans and rats (human:rats = 1:6.17)], the dosages employed in this study were equivalent to much safer doses of ∼3.2, 9.6, and 19.4 mg/kg in humans (for a 20 kg child, 4.8, 14.4, and 28.8 mg/kg). Animals were examined for clinical signs and weighed on a daily basis, and food intake was also monitored. Body weight was measured to the nearest 0.1 g with an electronic scale (Dretec Corp.) and recorded on the day before the start of feeding of caffeine until the end. All were killed 24 h after the last treatment using established protocols and ethical procedures. Terminal blood samples were collected by heart puncture and the serum samples were stored at −70°C.
Dual-energy X-ray absorptiometry (DXA)
Body composition was evaluated at the end of the experiment using dual-energy X-ray absorptiometry (Discovery W QDR series; Hologic, Inc.) with the small animal software package. The bone mineral content (BMC, g) and bone mineral density (BMD, g/cm2) of the whole body, lumbar vertebrae, and both femurs and tibiae were analyzed. Lean body mass (LBM) and total body fat were also measured.
Tibia and femur preparation
Both leg bones (femurs and tibiae) were dissected, and then weighed, and their lengths were measured from the top of the plateau to the bottom of the lateral malleolar process with a precision digital caliper (± 0.03 mm) (NA500-150S; Bluebird), as described in a previous report. 16
Histomorphometric analysis
Both tibiae were fixed in 10% buffered formalin for 48 h and decalcified in a solution of 10% ethylenediaminetetraacetic acid in 0.1 M Tris at 4°C. After decalcification, the tibiae were cut in half longitudinally with a razor blade and embedded in paraffin. Serial longitudinal sections (7 μm thickness) were obtained from the proximal part of the tibiae using a rotation microtome (RM 2155 Autocut; Leica), and the cartilage matrix stained with Alcian blue.
17
All histomorphometric evaluations were performed using an image analysis system (Leica LAS software) coupled to a light microscope (DM4000B; Leica). Based on the zone definitions of the growth plate (GP),
18
it was divided into the resting zone (RZ), proliferative zone (PZ), and hypertrophic zone (HZ) (Supplementary Fig. S2; Supplementary Data are available online at
Hormone measurements
The serum levels of IGF-1, estradiol (E2), and testosterone were measured using commercially available enzyme-linked immunosorbent assay (ELISA) kits (Cusabio Biotech Co., LTD.). Intra- and interassay coefficients of variance for IGF-1 (8%, 10%), E2, and testosterone (<15%) were less than 15%. Under the conditions of our test, the limits of detection were 0.156 ng/mL for IGF-1, 15 pg/mL for E2, and 0.06 ng/mL for testosterone. Absorbance was read in the ELISA reader against a blank well at 450 nm within 15 min (BioRad). All samples were run in duplicate.
Statistical analysis
Data for each group are expressed as means ± standard deviations. All data were analyzed using SPSS, ver. 10.0 for Windows (SPSS, Inc.). Statistical significance was determined by Kruskal–Wallis one-way analysis of variance for multiple group comparisons and the Mann–Whitney U-test or t-test for two-group comparisons. Significance was accepted at P < .05.
Results
The effect of caffeine on body weight gain and food intake in growing rats
The body weights of all animals increased progressively throughout the investigation (Fig. 1a). However, noticeably less body weight gains were seen in the CF2 and CF3 groups. The body weight gains in the CF3 group were consistently 9–10% less than those of the control animals every 10 days over the 30 days of treatment, eventually reaching 64–65% of the control after 30 and 40 days of exposure. The 20 or 60 mg doses of caffeine also continuously decreased the percentage of body weight as relative to the controls. Average daily food intake was calculated at 1-week intervals (Fig. 1b). Food consumption in all the caffeine-fed groups decreased in a dose- and time-dependent manner (P < .05 vs. CT; P < .05 CF1 vs. CF2 or CF3). The food efficiency ratio (FER) was calculated by dividing the body weight gain by the food intake to investigate if the decreased weight gain is mainly due to the reduced food intake (Fig. 1c). All caffeine-fed groups showed generally lower FERs compared with the CT. A significant decrease in FER was observed in the CF3 group throughout the experimental period. The CF2 group also showed a significant decrease at the first, fourth, and sixth week of experiment (P < .05 CT vs. CF2 or CF3; P < .05 vs. CF1).
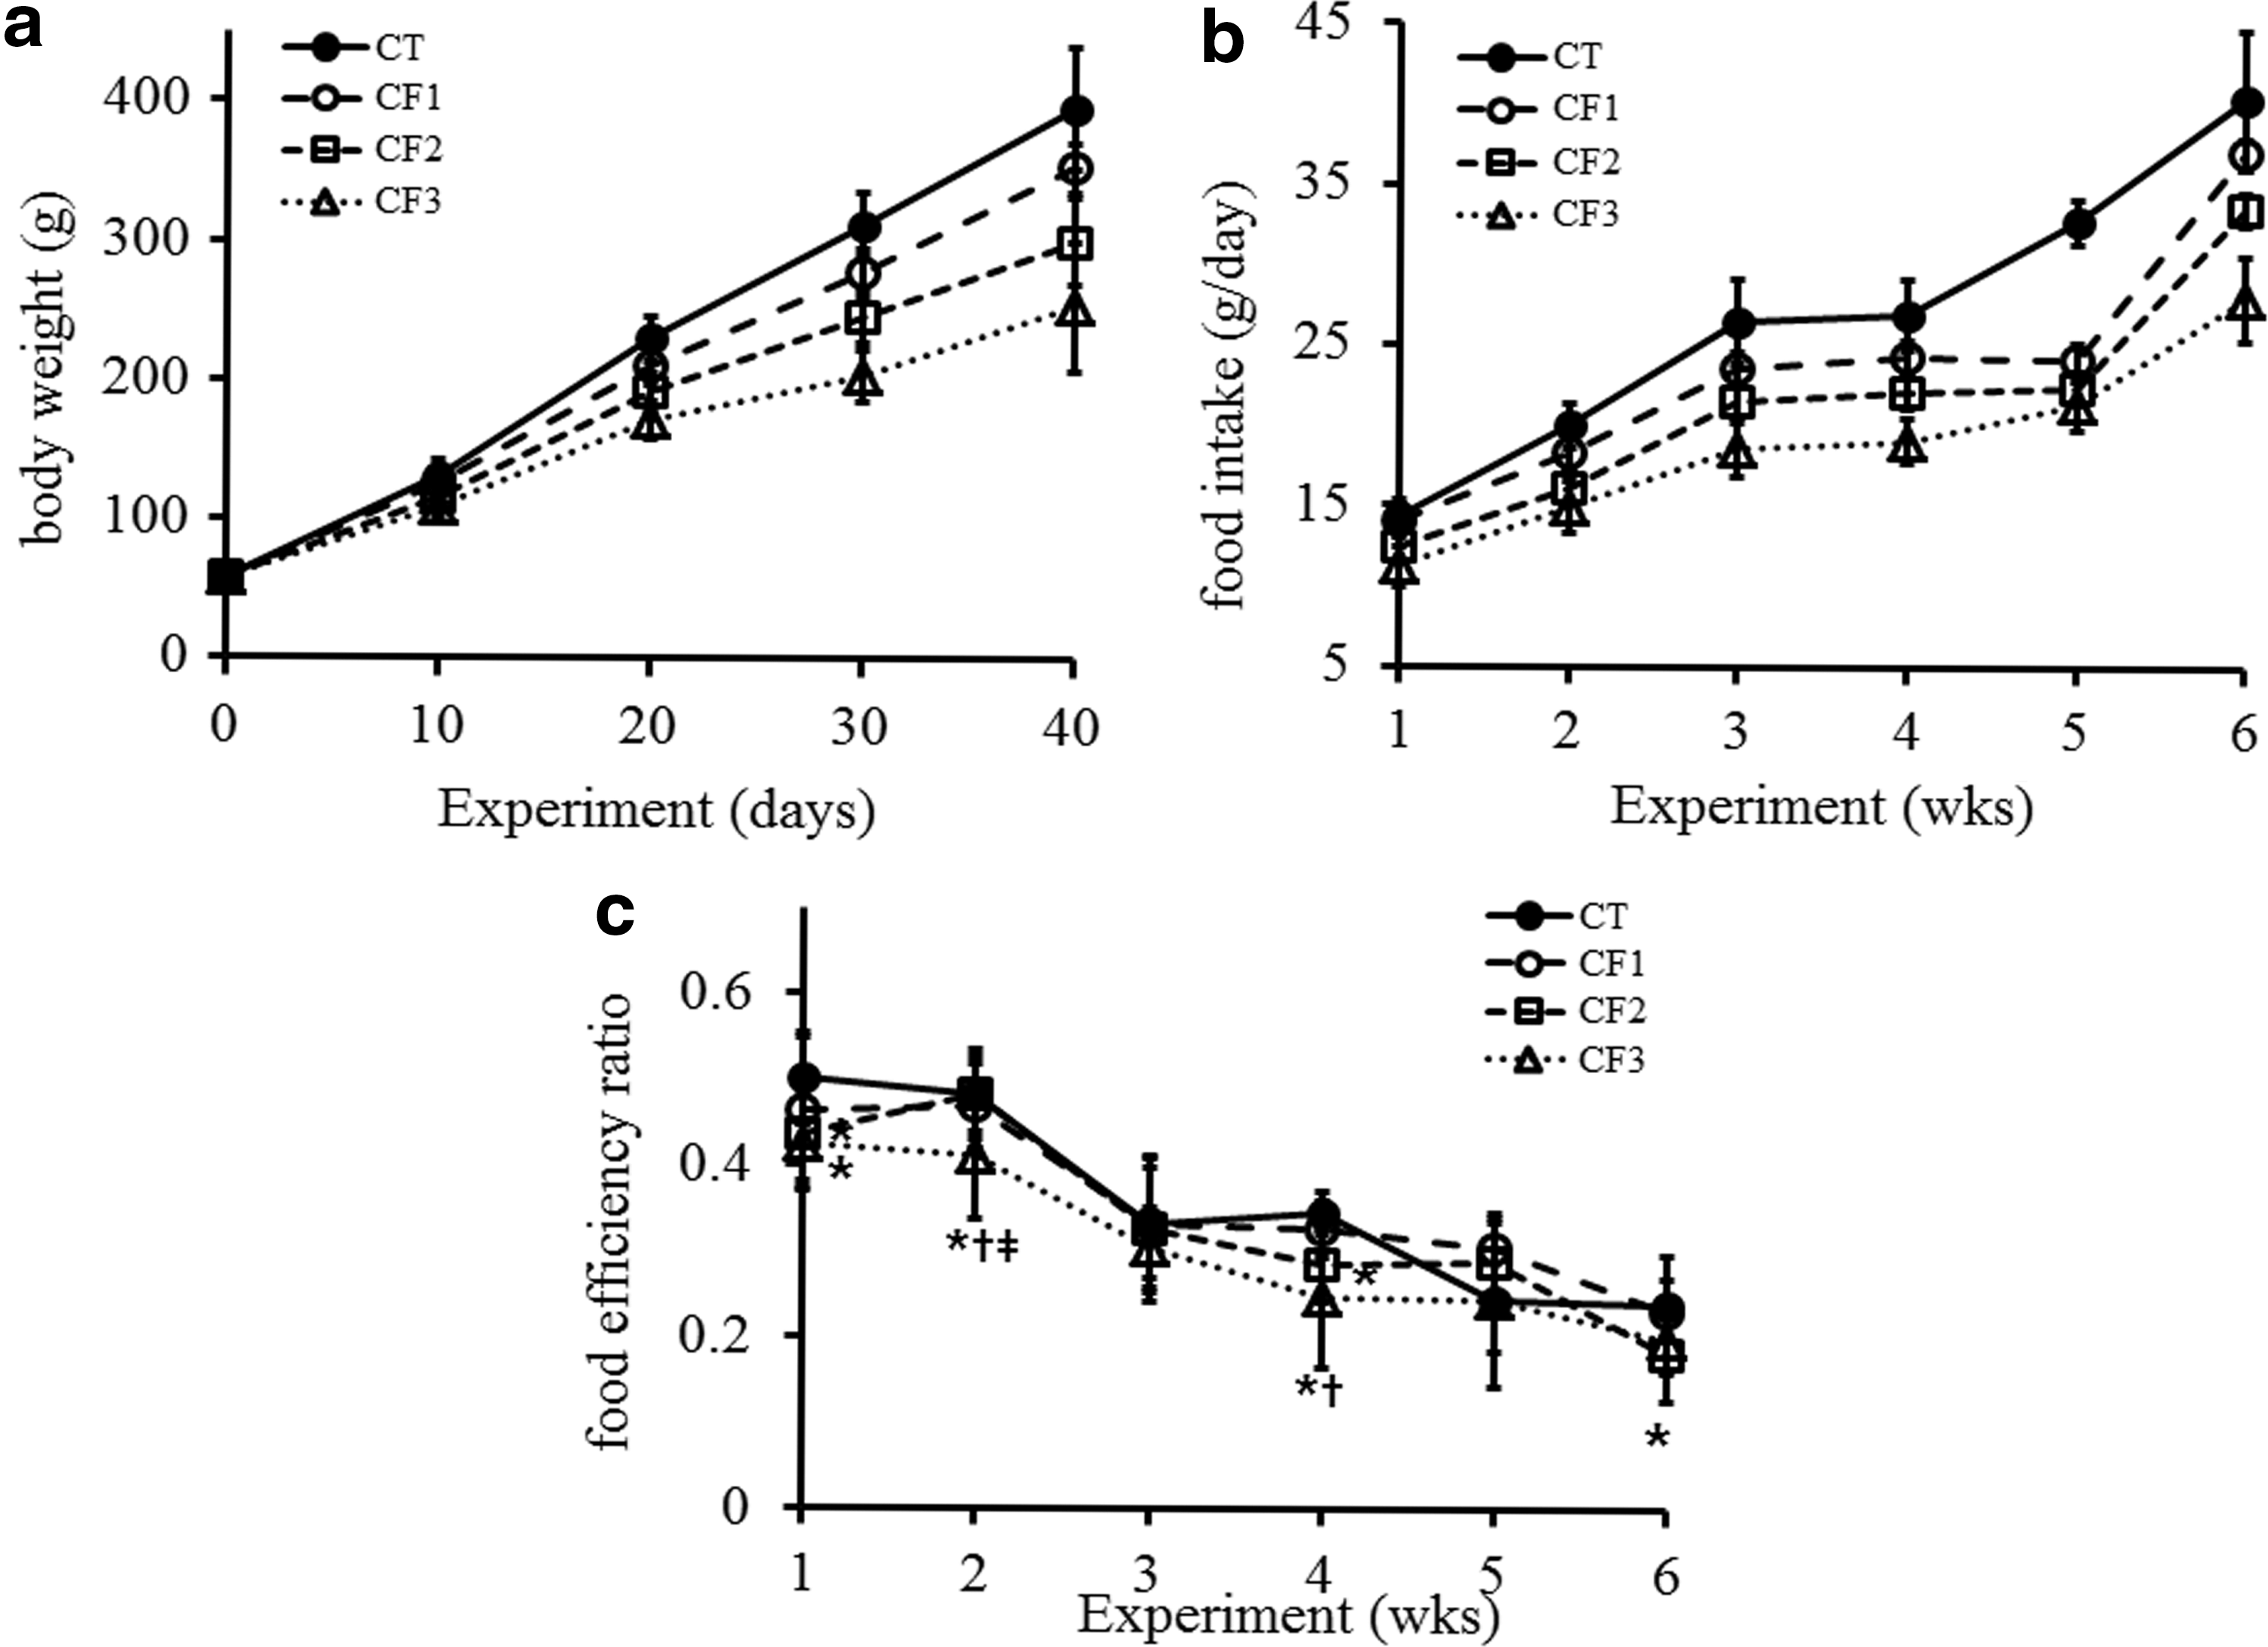
Effect of caffeine on body weight and food consumption in immature male rats.
The effect of caffeine on body composition
LBM decreased in parallel with total body mass in the caffeine-fed groups throughout the experimental period, with significant reductions attained in CF2 and CF3 (P < .05 vs. CT) (Table 1). The dose dependency of the reduction of body fat was clearly seen after 30 days of exposure (P < .05 vs. CT; P < .05 CF1 vs. CF2 or CF3). Likewise, the percentage of body fat tended to decrease in the caffeine-fed groups, and statistically significant decreases were attained in all the caffeine-fed groups after 40 days of exposure. In the controls, body fat percentage increased progressively, accompanying the increase in total body fat, and this increase was greatly attenuated in the caffeine-fed groups. The BMC of all regions did not differ between the control and CF1, whereas there was a significant decrease in CF2 and CF3 on and after 20 days of exposure (Table 2). Significant reductions were noted in CF3 on and after 30 days of exposure compared with the other caffeine-fed groups (P < .05 vs. CT; P < .05 CF1 vs. CF2 or CF3; P < .05 CF2 vs. CF3). On the other hand, the BMD of the tibia decreased in the caffeine-fed groups on and after 30 days of exposure, and significance relative to the control was attained in CF2 or CF3 by 30 days of exposure.
Values are given as mean ± SD of five rats per group at each designated time point.
P < .05 versus CT.
P < .05 versus CF1.
P < .05 versus CF2.
SD, standard deviation; TBM, total body mass; LBM, lean body mass; LBM%, LBM divided by TBM; fat%, total body fat divided by TBM; CT, control; CF1, 20 mg caffeine-fed; CF2, 60 mg caffeine-fed; CF3, 120 mg caffeine-fed.
Values are given as mean ± SD of five rats per group at each designated time point.
P < .05 versus CT.
P < .05 versus CF1.
P < .05 versus CF2.
BMC, bone mineral content; BMD, bone mineral density.
The effect of caffeine on the length and weight of long bones
The mean length of the femur increased in all groups, but the increment was less in the caffeine-fed groups (Table 3, Fig. 2). The treatment-related lower growth rate in femur length and weight was profound in CF3 (P < .05 vs. CT; P < .05 CF1 or CF2 vs. CF3) on and after 30 days of exposure. A treatment-related relative decrease in tibia length was observed in both CF2 and CF3 on and after 20 days of exposure (P < .05 vs. CT). Because vertical growth of the vertebral body follows the same process as long bone growth, 10 the length of the spinal column obtained with DXA was used as a measure of axial growth. Spinal length (mm) was measured from the upper border of the first cervical vertebra to the lower border of the fourth sacral vertebra (Supplementary Fig. S1). The caffeine-fed animals had relatively reduced spinal lengths throughout the experimental period, and significant shortening was attained with the highest dose compared with the control or other doses on and after 20 days of exposure.

Representative pictures of the long bones in the control and caffeine-fed groups at
The length of the spinal column was measured from the DXA image as indicated in Supplementary Figure 2. Values are given as mean ± SD of five rats per group at each designated time point.
P < .05 versus CT.
P < .05 versus CF1.
P < .05 versus CF2.
DXA, dual-energy X-ray absorptiometry.
The effect of caffeine on the GP
GP height decreased progressively in all groups (Table 4, Fig. 3). There was a sharp reduction in GP height between 30 and 40 days, particularly in the control. Although GP height did not differ significantly between the groups, it was lower in the caffeine-fed groups throughout the first 30 days of exposure, but this effect was reversed after 40 days. On the other hand, a significantly lower HZ height was noted in CF3 at 10 or 30 days of exposure and in all the caffeine-fed groups at 30 days of exposure (P < .05 vs. CT). Although HZ height was reduced in the caffeine-fed groups, the number of cells or columns increased compared with the control, in particular at 40 days of exposure. PZ height gradually decreased with age in all groups. The caffeine-fed animals had dose-dependent decreases in mean cell number in the PZ. The numbers of cells and columns fell in the caffeine-fed animals for 30 days, but then increased at 40 days, while the number of columns was consistently lower than in the controls. In addition, relatively long and sparse columns in the PZ were noted in the caffeine-fed groups (Fig. 3).
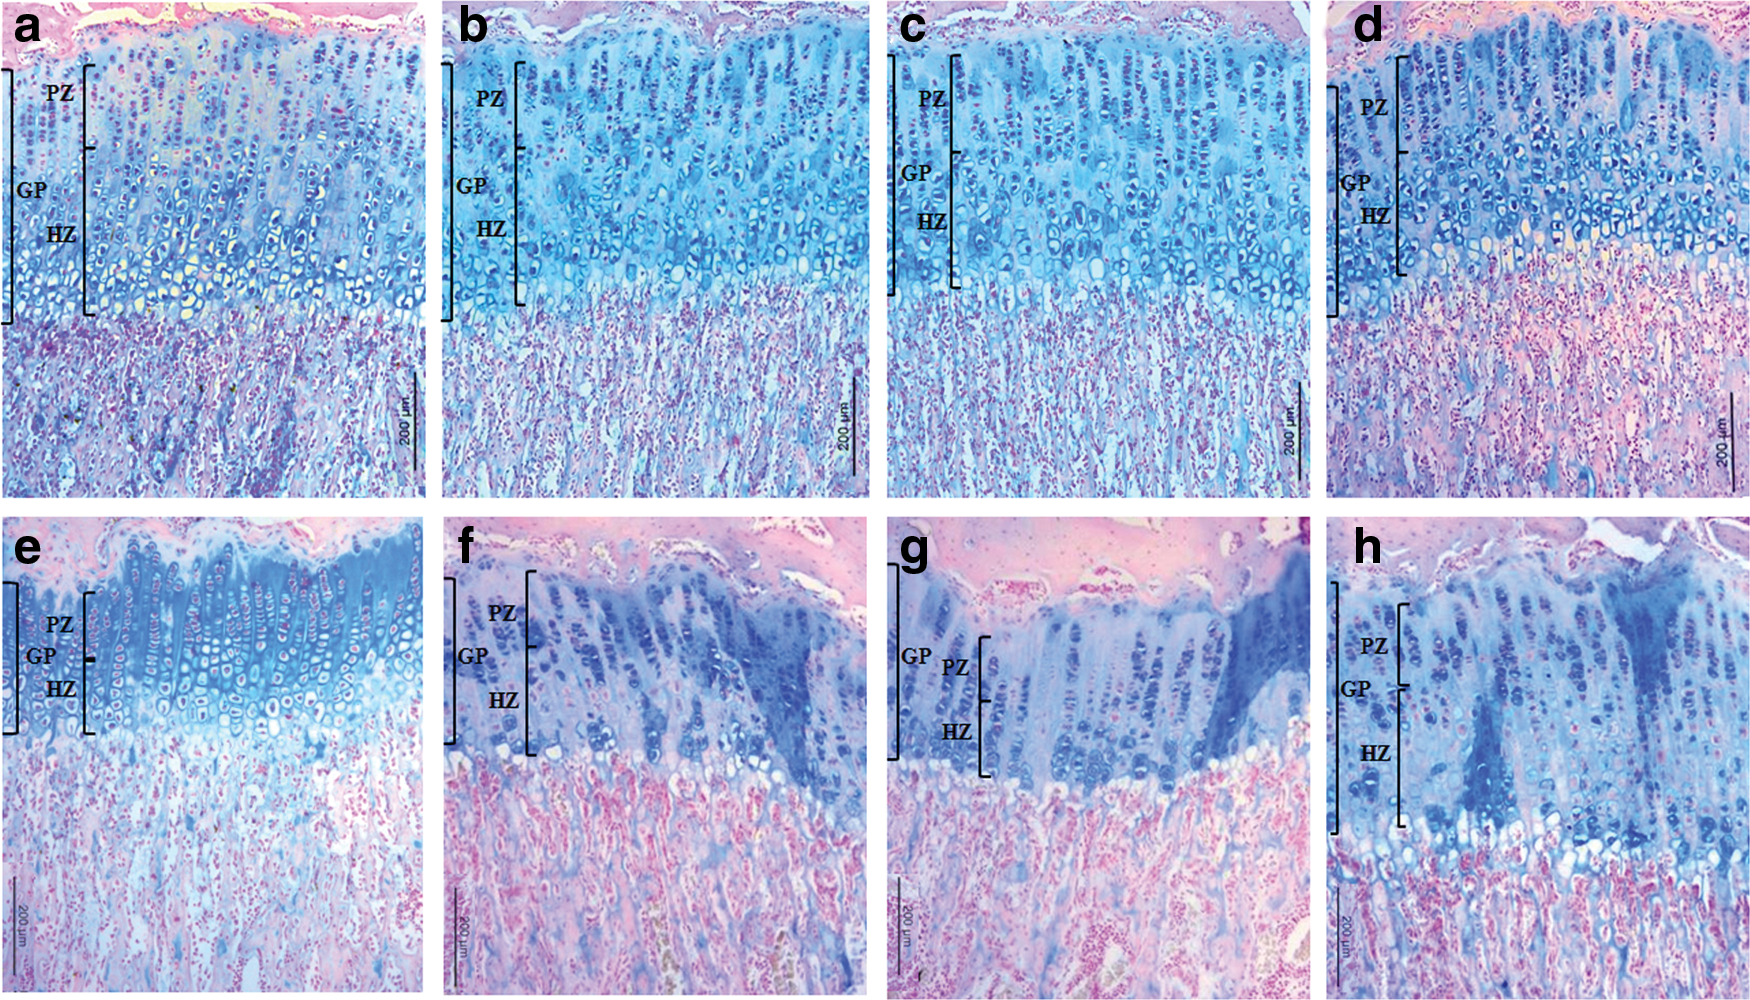
Representative sections of the proximal tibia growth plate (GP) from the control and caffeine-fed groups at 30
Measurements given in μm represent the longitudinal dimension of the structures parallel to the long axis of the bone. The data for the number of cells or columns represent the mean value of eight measurements within the same defined region (0.307277 mm2) at a 200-fold magnification in both tibiae; the data on cell number per column for the PZ and HZ represent the mean number of cells in a single column spanning the longitudinal diameter of the zone. Values represent mean ± SD for both tibiae of five rats per group at each designated time point.
P < .05 versus CT.
P < .05 versus CF1.
P < .05 versus CF2.
GP, growth plate; PZ, proliferative zone; HZ, hypertrophic zone.
The effect of caffeine on trabecular bone formation
The height of secondary Sn in the control increased progressively and peaked at 30 days (Table 5). The height of the Sn then slightly decreased. However, Sn height in the caffeine-fed groups was almost unchanged throughout; all parameters related to bone formation were significantly lower than in the control on and after 20 days of exposure to caffeine (Fig. 4), with a substantial decrease in the bone area ratio and trabecular number and thickness; as a consequence, there was increased trabecular separation. In the caffeine-fed animals, the decrease in the bone area ratio was shown to be accompanied by a thinning of the newly formed trabeculae. The decrease in the number of trabeculae in all the caffeine-fed groups reached a significant level on and after 30 days of exposure and was accompanied by a significant increase in trabecular separation.
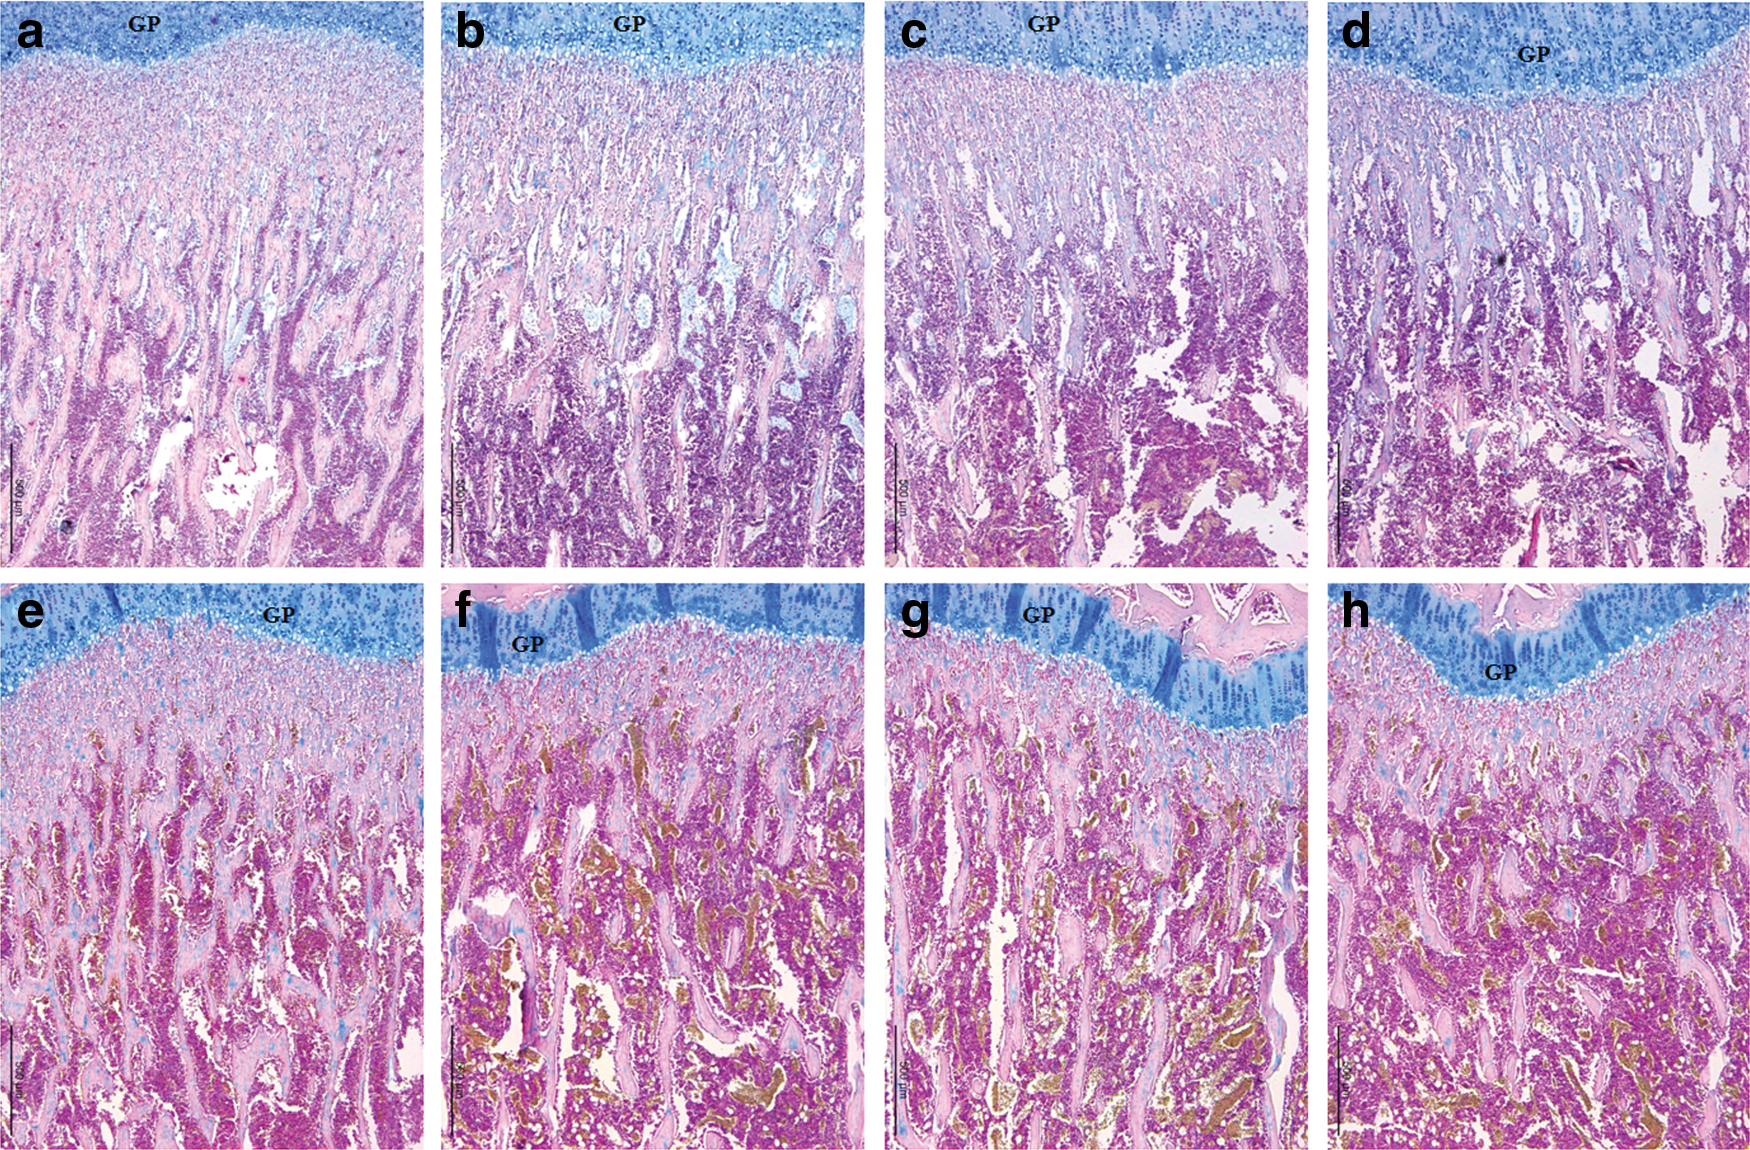
Representative sections of the proximal tibia cancellous bone from the control and caffeine-fed groups at 30
The height measurements represent the longitudinal dimension of the structure parallel to the long axis of the bone. Whole fields of vision on four consecutive Alcian blue-stained sections of each tibia were evaluated for the analysis of the secondary spongiosa at 100-fold magnification. Values represent mean ± SD for both tibiae of five rats per group at each designated time point.
P < .05 vs. CT.
P < .05 vs. CF1.
P < .05 vs. CF2.
B.Ar./T.Ar., trabecular bone volume; Tb.Wi, trabecular width; Tb.N, trabecular number; Tb.Sp, trabecular separation.
The effect of caffeine on serum levels of IGF-1, estradiol, and testosterone
The initial serum level of IGF-1 at 21 days of age was 268.4 ± 30.56 ng/mL, and a sharp increase was found at 10 days in the control (corresponding to PD30) (Fig. 5a). However, the sharp increase in IGF-1 at 10 days was not observed in CF2 and CF3. CF3 had significantly reduced levels of IGF-1 compared with the control at 30 and 40 days of exposure (P < .05). On the other hand, E2 levels in the controls were relatively constant (Fig. 5b). There was a slight increase of E2 in CF1, which was significant at 40 days (CT vs. CF1; 33.2 ± 2.5 vs. 38.8 ± 2.1 pg/mL) (P < .05). In contrast, E2 levels in CF3 fell significantly after 30 and 40 days of exposure (P < .05). Serum testosterone levels increased after 20 days in all groups, but less so in the caffeine-fed animals (Fig. 5c).
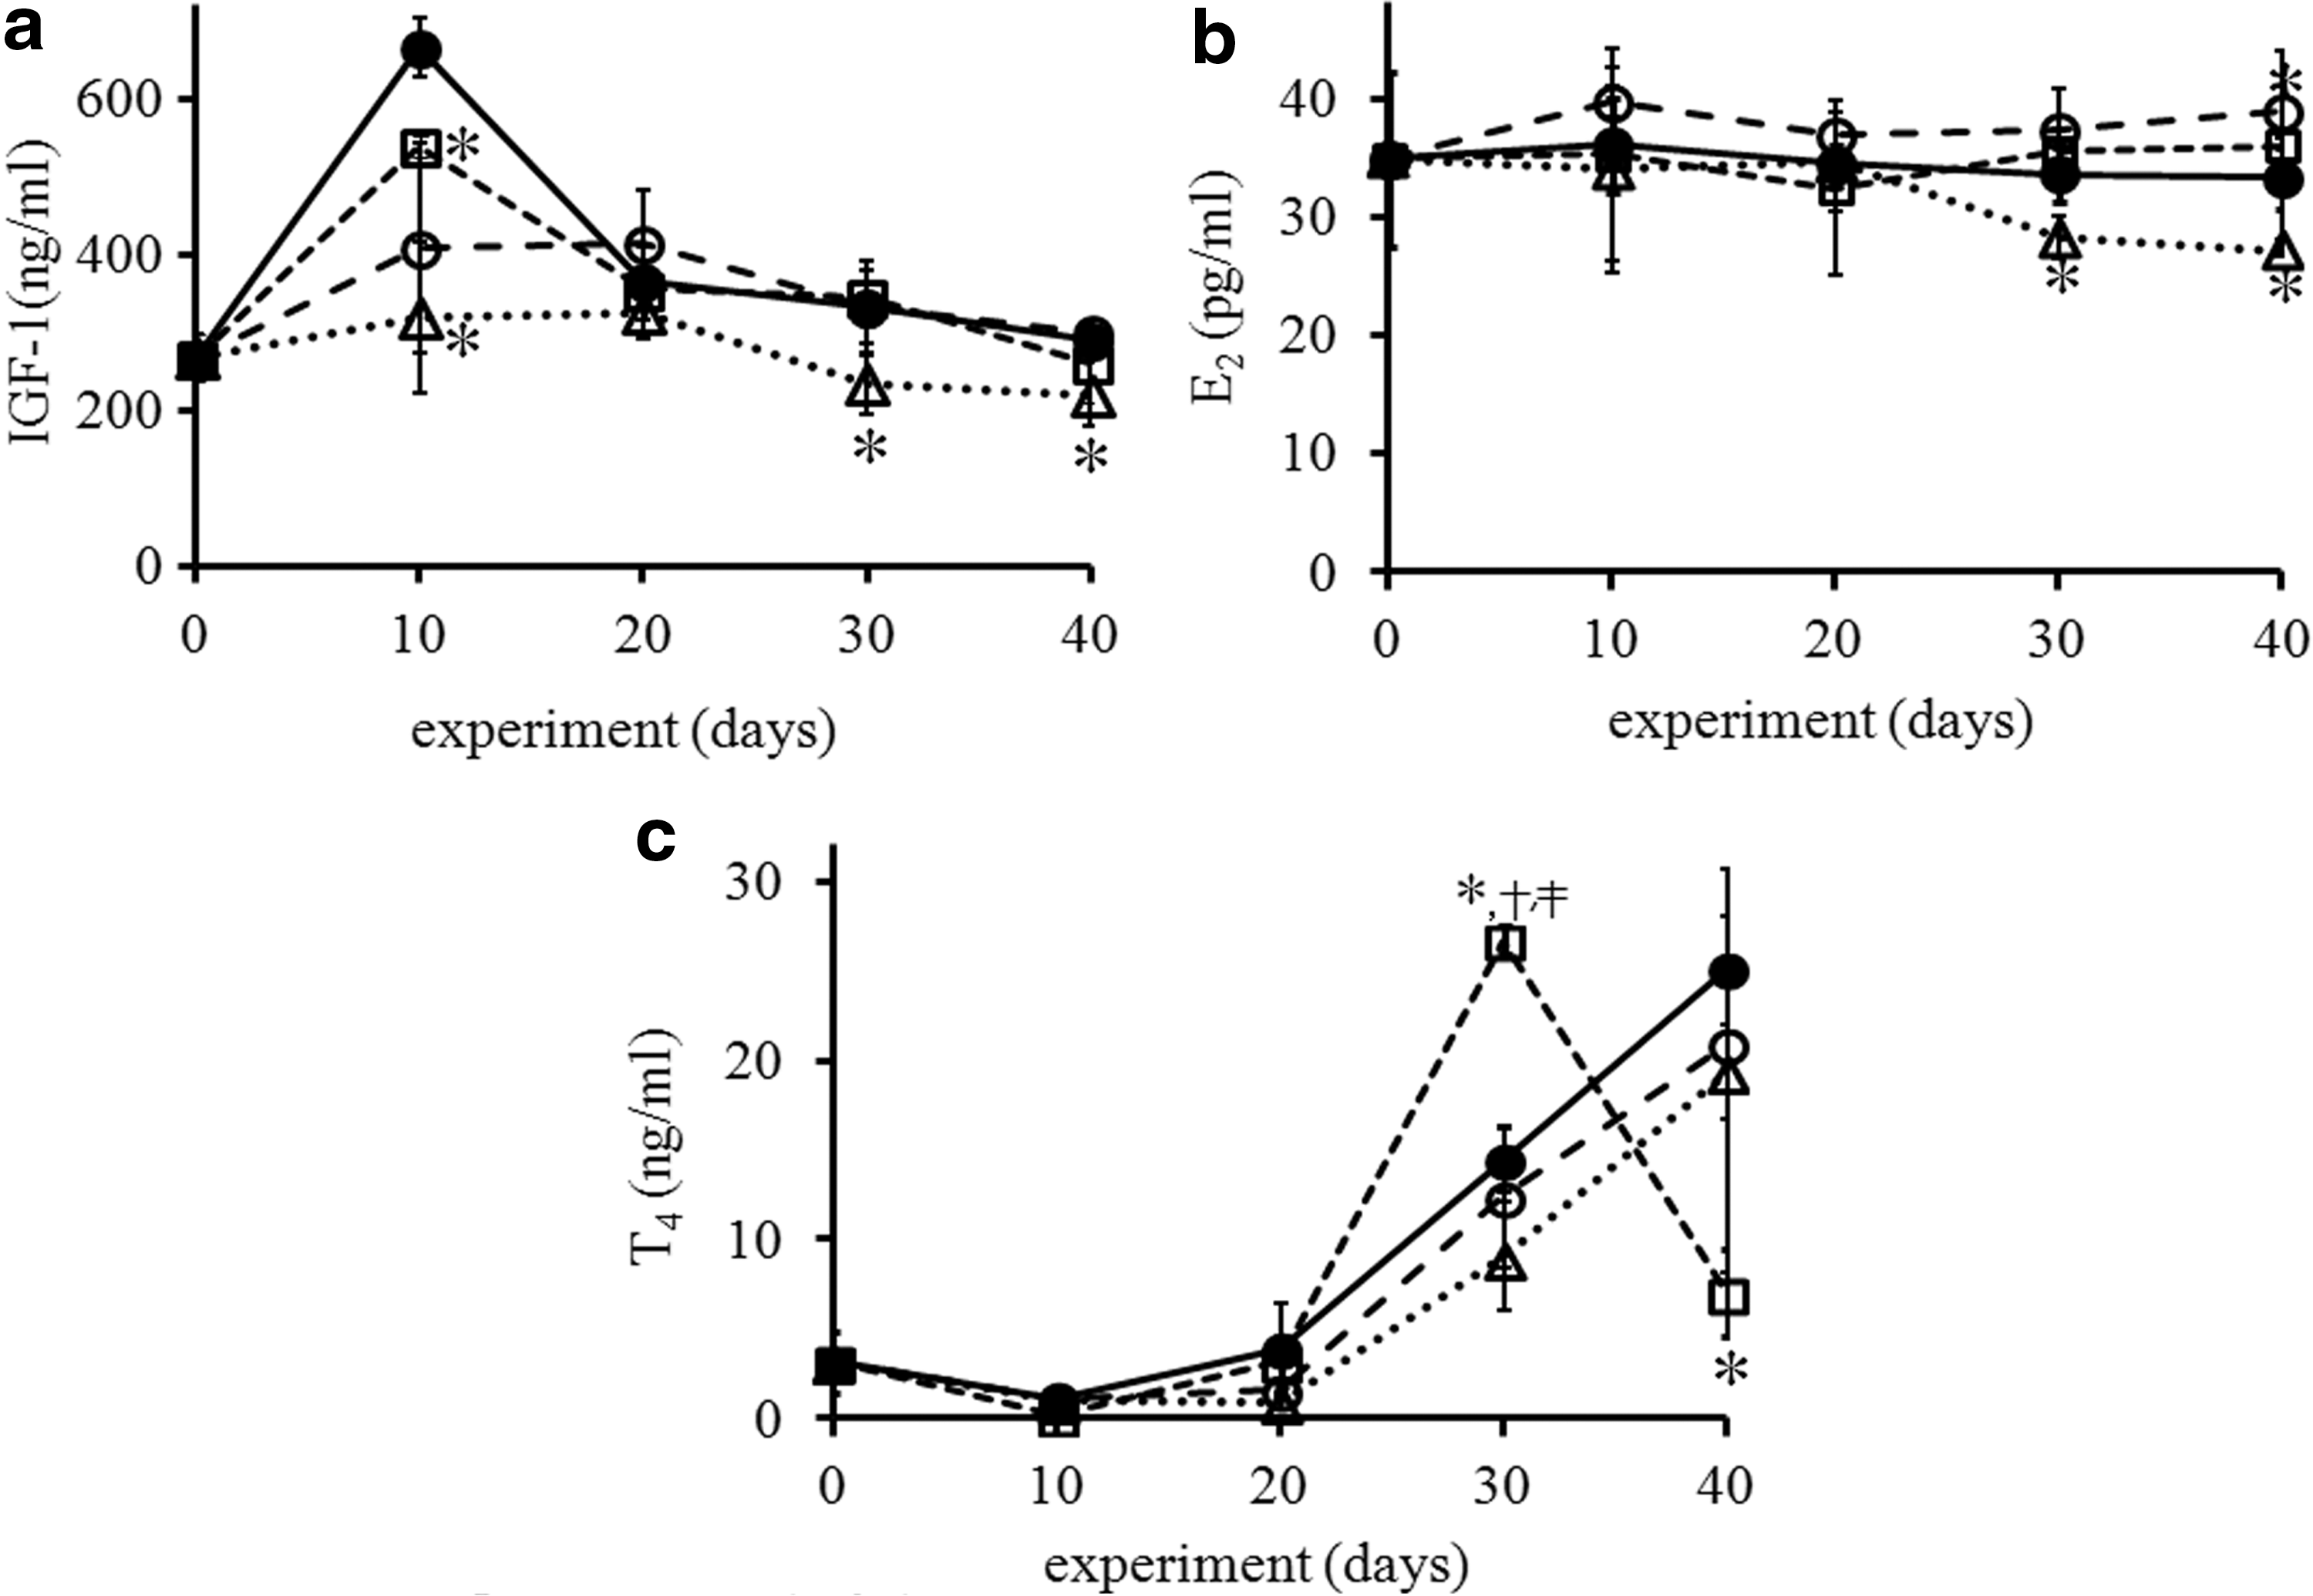
Effect of caffeine on serum levels of
Discussion
Our results provide clear evidence that caffeine consumption inhibits longitudinal bone growth in immature male rats in a dose- and time-dependent manner, possibly by inhibiting food intake and altering the secretion of hormones relevant to pubertal bone growth. The reduced body weight was accompanied by the reduced food consumption, which seemingly suggests a causal relationship between body weight and food consumption, rather than direct effects of caffeine consumption. However, a decreased FER observed in the caffeine-fed groups suggests that the reduced body weight is not simply due to the food intake, but due to altered metabolic activities resulting from caffeine consumption. Caffeine has been reported to speed up metabolism by enhancing the catabolism of fatty acids. 20 Therefore, the reduced body weight gain may be attributed to both reduced food consumption and increased catabolism.
Like prenatal caffeine exposure in humans and rodent models, 21,22 prepubertal exposure inhibited body weight gain (Fig. 1a). This agrees with previous work, where it was shown that immature male rats fed 100 mg caffeine for 4 weeks had significantly lower body weights. 23 However, other studies have reported no significant effects on food intake or body weight, 24 possibly due to a difference in caffeine dose and administration route. Because body weight and food intake have important effects on the onset of puberty, 24 significant reductions in body weight most likely influence pubertal onset and progression, although the critical levels of caffeine have not been defined. In addition, caffeine elevates the resting metabolic rate by increasing the catabolism of fatty acids, 20 causing loss of body weight. Therefore, the poor weight gain in the caffeine-fed groups may be due to increased catabolism in addition to decreased food intake.
Among the major physical changes of normal puberty, skeletal growth is the most striking. LBM and body fat are strong positive factors affecting bone strength during the adolescent growth spurt. 25 LBM primarily reflects muscle mass and begins to increase during early puberty, whereas body fat increases with the stage of puberty. 26 Caffeine seems to interfere with fat deposition more than muscle growth, even after short-term exposure. Studies on growing rats have revealed negative effects of caffeine on BMD when the animals were adults. 27,28 In general, after the growth spurt, linear growth slows considerably, while bone mineralization rises steeply. 29 Although we observed the animals during their growth spurts, this may have been too early to detect rapid bone mineralization and profound negative influence of caffeine on BMD.
Experimental studies have not obtained consistent effects on bone elongation in caffeine-treated males. Some studies have suggested that caffeine has a negative influence, 28,30 but others reported no effect or even a positive influence 27,31 depending on the stage of life during treatment, its duration, and the dose. However, we are unaware of any reports in the literature examining the effects of caffeine using a paradigm similar to the one used in the present study—exposure to a range of caffeine doses for different durations throughout the rapid growth period of long bone. Longitudinal growth, as assessed on femur, tibia, and spine, was dose-dependently reduced in caffeine-fed animals (Table 3; Fig. 2). This effect is analogous to the decreased body and femur lengths observed in fetal animals after prenatal exposure to caffeine. 8,22 Caffeine's negative effects on long bone growth may be due to inhibition of endochondral ossification, which is dependent on the activity of the GP. 27 Chondrocyte activity in the GP is most active during the growth spurt between PD20 and 40, 10,18 and then progressively decreases after 8 weeks of age. 18,32 Consistent with these observations, we noted peak GP heights after 10 and 20 days (corresponding to PD30–40), and then a rapid decrease after 30 and 40 days (Table 4). The decreased rate of change in GP height between 30 and 40 days in caffeine-fed animals seemed to mainly result from caffeine's deleterious effects on the HZ as a pattern of change similar to that observed for GP height was noted in the HZ, but not in the PZ. In fact, the change in GP height is highly correlated with the size and volume of the HZ chondrocytes. 18,32 The fewer changes in HZ height by age in the caffeine-fed groups suggest that the adverse effect of caffeine on the GP is mediated by the inhibition of hypertrophic activities. Although the numbers of cells and columns in the HZ were elevated in the caffeine-fed groups, small and irregularly aligned chondrocytes were observed in them (Table 4, Fig. 3). Given that chondrocyte enlargement has been shown to be a much faster and more efficient means for elongating the columnar units, 18,32 impaired chondrocyte hypertrophy seems to be the major cause of the shortening of long bones by caffeine. Considering that the secondary Sn consists of lamellar bone without cartilage cores, 32 the similar heights of the secondary Sn in the caffeine-fed groups may be a reflection of impaired osteoblast activity or mineralization. As expected from the few fairly thin spicules in the caffeine-fed groups (Fig. 4), deleterious effects of caffeine were already noted after 10 days of exposure. The decreased BMC seems instead to be related to decreased bone size rather than mineral deficiency (Table 2).
Longitudinal bone growth is tightly governed by complex endocrine controls. IGF-1 is known to be a primary regulator of the prenatal and pubertal growth spurt (PD20–40) in male rats. 8,33 –35 Although the appropriate level of IGF-1 for the growth spurt is not known, a rapid increase in IGF-1 around PD30 might be important. However, a sharp increase in IGF-1 at PD30 was not noted in the caffeine groups (CF2 and CF3). Consistent with these observations, caffeine exposure has been shown to decrease hepatic IGF-1 production in fetal rats. 8 Considering that IGF-1 augments increasing chondrocyte size, 34 the reduced level of IGF-1 may contribute to the decreased HZ height in the caffeine-fed animals. Estrogen is also an important stimulus for long bone growth during the pubertal growth spurt. 36 –38 Consistent with this, significantly decreased E2 levels were noted after 30 days of exposure in CF3. In contrast, the 20 mg dose of caffeine increased E2 levels compared with the control perhaps because of a biphasic effect of dose on serum levels of E2. 38 In addition, androgens are important for long bone growth. 35,37 Prenatal caffeine exposure has been shown to lower testosterone levels in the male offspring of humans 39 and rats. 7 We found that pubertal caffeine exposure had similar effects on testosterone levels. However, several studies have reported that chronic caffeine consumption increased serum testosterone levels in adult humans 39 and animals. 40 The unexpectedly high level of testosterone noted at 30 days of exposure in CF2 could be explained by biphasic dose responses. However, it is clear that caffeine consumption can interfere with serum testosterone levels in immature male rats, contributing to impaired bone growth.
These results suggest that caffeine can interfere with the endogenous endocrine changes that accompany the pubertal growth spurt. Our results in male rats clearly demonstrate that a range of caffeine doses can alter parameters related to pubertal growth, such as body composition, BMC, and BMD, and lead to shortening and lightening of long bones. As the lowest dose adopted in this study also affected parameters related to pubertal growth, further studies are required to determine the minimal safe dose of caffeine that avoids interfering with pubertal growth and whether, and to what extent, the initial negative influence of caffeine is sustained in the long term.
Footnotes
Acknowledgments
Y.-Y. C. and Y. C. have contributed equally to this article. The authors would like to thank Mr. Taegeun Kim for his excellent technical assistance with DXA. This research was supported by the Basic Science Research Program through the National Research Foundation of Korea (NRF) funded by the Ministry of Education (2013R1A1A3006054, 2014R1A1A2053601) and the research fund of Hanyang University (HY-2014).
Author Disclosure Statement
No competing financial interests exist.
References
Supplementary Material
Please find the following supplemental material available below.
For Open Access articles published under a Creative Commons License, all supplemental material carries the same license as the article it is associated with.
For non-Open Access articles published, all supplemental material carries a non-exclusive license, and permission requests for re-use of supplemental material or any part of supplemental material shall be sent directly to the copyright owner as specified in the copyright notice associated with the article.