
Abstract
We aimed to investigate the mechanism of brain damage in diet-induced obese (DIO) rats and diet-resistant (DR) rats from the viewpoint of redox state and nuclear related factor 2 (Nrf2) signaling pathway. Sprague-Dawley rats were fed with a high-fat diet for 10 weeks to obtain the DIO and DR rats.
Introduction
O
The comparisons between DIO and DR rats are visible in many organs in rodents. 6 –8 Teske et al. 9 found that the DIO rats are more sensitive to antagonism of orexin 1R (OX1R) and agonists of OX2R than DR rats. Obesity-resistant S5B rats showed greater cocaine-conditioned place preference than the obesity-prone Osborne-Mendel rats. 10 HFD increased malonaldehyde levels in the spleen and decreased antioxidant enzyme expressions in DIO mice, but not in DR mice. 11,12 These studies suggested that oxidative damage may account for obesity induced by HFD. It was reported that the neuronal response in brain regions has been altered in individuals prone to obesity, which may represent an important mechanism contributing to obesity. 13 Understanding these different phenotypes in the brain of obesity-prone people is critical. However, the comparison of redox state in the brain between DIO and DR rats remains limited.
The oxidative stress levels can reflect the redox state, while nuclear related factor 2 (Nrf2) and its dependent activating gene heme oxygenase 1 (HO-1) and other downstream factors such as NAD(P)H quinone oxidoreductase 1 (NQO1) are important components in the cellular stress response, which combat various oxidative stresses. 14,15 Although previous studies have shown that the obese phenotype is associated with the alteration of structure and function in brain, 16 it is unclear whether these changes are core factors of obesity and whether the redox state and Nrf2 signaling pathway play an important role in the brain of obese people. Thus, we designed the present study to investigate the redox state, including the reduced glutathione (GSH), oxidized glutathione (GSSG), and glutathione peroxidase (GSH-Px), and the expressions of Nrf2 and its downstream proteins in the brain of DIO and DR rats.
Materials and Methods
Animals and diets
Fifty male SD rats (body weight 140–160 g; SPF degree) were purchased from the Academy of Military Medical Sciences (Beijing, China). All the rats were housed in plastic boxes individually at 20–23°C with food and water available. Rats were fed with standard laboratory chow for the first week to adapt to the new environment. During the experimental period, rats were given either a normal-fat (NF) diet (345.3 kcal/100 g, 10% fat content) or a high-fat (HF) diet (435.96 kcal/100 g, 40% fat content). The HF and NF diet formulations (SPF degree) were also purchased from the Academy of Military Medical Sciences. All experimental procedures were approved by the Animal Ethics Committee of Capital Medical University and conducted in compliance with the animal-use guidelines.
Experimental protocol
After the acclimation period, 10 rats were randomly assigned to receive an NF diet according to their body weights, and
Preparation of serum samples
Rats were anesthetized with an intraperitoneal injection of sodium pentobarbital, and blood samples were collected from the heart and immediately transferred into chilled polypropylene tubes for plasma preparation. Blood samples were centrifuged at 3500 g for 15 min at 4°C. Serum was collected and stored at −80°C until the assay.
Measurement of GSH, GSSG, and GSH-Px in serum and brain tissue
The GSH, GSSG, and GSH-Px level in serum and brain tissue were measured using assay kits purchased from Jiancheng Biotech Co., Ltd. (Nanjing, China). Briefly, the protein concentration of the brain was determined by using the BCA protein assay kit (Pierce Biotechnology, Rockford, IL, USA). The standard curves of GSH and GSSG concentration were made respectively. The total GSH was measured first, and then the GSH and GSSG levels were measured respectively, and the GSH/GSSG ratio was calculated. GSH-Px levels were also determined according to the guidelines of the kit.
Measurement of peptide YY and cholecystokinin in brain tissue and serum
The peptide YY (PYY) and cholecystokinin (CCK) level in serum and brain tissue were measured using assay kits purchased from RayBiotech, Inc. (Atlanta, GA, USA). Sigma Plot software, which can perform four-parameter logistic regression models, was used to calculate the concentration of PYY and CCK.
Western blot analysis of Nrf2, HO-1, NQO1, and manganese superoxide dismutase
Brain tissue was ground in a tissue grinder in the RIPA buffer (150 mM NaCl, 1% NP-40, 0.5% sodium deoxycholate, 0.1% sodium dodecyl sulfate [SDS], 50 mM Tris-HCl) for 2 h at 4°C and then centrifuged at 16,000 g for 15 min. The supernatant was separated and collected for protein analysis. The protein concentration was determined by using the BCA protein assay kit (Pierce Biotechnology). Then, the protein samples were loaded and separated by a 12% SDS-acrylamide gel electrophoresis and wet transferred to polyvinylidene fluoride blots at the voltage of 60 V for 2 h. The membrane was blocked by a fresh blocking buffer (Tris-buffered saline, containing 5% skim milk powder) at room temperature for 1 h. Immunoblots were performed with appropriate antibodies. Primary antibody (diluted in 1:1000 with TBST and 1% nonfat dry milk) for anti-Nrf2 (Abcam, Cambridge, United Kingdom), anti-HO-1 (Abcam), anti-NQO1 (Santa Cruz Biotechnology, Inc., Santa Cruz, CA, USA), and anti-manganese superoxide dismutase (MnSOD; Cell Signaling Biotechnology, USA) were incubated with membrane overnight at 4°C. β-Actin (Santa Cruz Biotechnology, Inc., Boston) was used as housekeeping in the brain in our study. The proper secondary antibodies were added and incubated for 2 h at room temperature. The blots were washed thrice with the TBST buffer and transferred proteins were visualized by an alkaline phosphatase reaction kit according to the manufacturer's instructions. Then FluorChem FC2 software (Alpha Innotech Corp., San Leandro, CA, USA) was used to analyze the gray value of the protein expression in each group.
Statistical analysis
Data are presented as means and their standard errors. All statistical analyses were performed using SPSS 13.0 (SPSS, Inc., Chicago, IL, USA). All data were analyzed by a one-way analysis of variance, followed by the LSD test and Dunnett T3 test.
Results
GSH, GSSG levels, and GSH/GSSG ratio in serum and brain tissue
The GSH levels and GSH/GSSG ratio in serum showed no significant differences among CON, MOD, DIO, and DR rats (P > .05). Compared to the CON group, DIO and MOD rats had higher levels of GSSG in serum (P = .008; P = .009), whereas compared with DIO and MOD rats, the DR rats showed lower GSSG levels in serum (P = .006; P = .006) (Table 1). As shown in Table 2, the GSSG levels in brain showed no significant differences among CON, MOD, DIO, and DR rats (P > .05). Compared with CON rats, the MOD rats showed significantly decreased GSH levels and decreased GSH/GSSG ratios in brain (P = .002). The levels of GSH in the brain of DR rats were higher (P = .000; P = .000; P = .000) and the GSH/GSSG ratio was higher (P = .011; P = .003; P = .005) compared with CON, MOD, and DIO rats (Table 2).
Mean values were significantly different from those of the CON group: a P < .05.
Mean values were significantly different from those of the MOD group: b P < .05.
Mean values were significantly different from those of the DIO group: c P < .05.
DIO, diet-induced obesity; DR, diet resistant; CON, control; MOD, oxidative stress; GSH, reduced glutathione; GSSG, oxidized glutathione.
Mean values were significantly different from those of the CON group: a P < .05.
Mean values were significantly different from those of the MOD group: b P < .05.
Mean values were significantly different from those of the DIO group: c P < .05.
GSH-Px levels in serum and brain tissue
The level of GSH-Px in the brain tissue is also different among four groups and it is significantly higher in DIO rats (P = .007) than that in the CON group. The GSH-Px level in serum was significantly higher only in the MOD group compared with the CON group (P = .041) (Table 3).
Mean values were significantly different from those of the CON group: a P < .05.
Mean values were significantly different from those of the MOD group: b P < .05.
Mean values were significantly different from those of the DIO group: c P < .05.
GSH-Px, glutathione peroxidase.
PYY and CCK concentration in the brain
The PYY concentration showed no significant difference among the four groups. Compared with the CON rats, the CCK concentration was higher in the brain of DR rats (P = .031) (Table 4).
Mean values were significantly different from those of the CON group: a P < .05.
Mean values were significantly different from those of the MOD group: b P < .05.
Mean values were significantly different from those of the DIO group: c P < .05.
CCK, cholecystokinin; PYY, peptide YY.
The expression of Nrf2, HO-1, MnSOD, and NQO1 in the brain
The protein expression of Nrf2 was upregulated in the brain of MOD and DIO compared to the CON rats (P = .000; P = .000). Compared to the MOD and DIO rats, the Nrf2 protein expression was downregulated significantly in the brain of DR rats (P = .001; P = .000) (Fig. 1). The HO-1 and MnSOD expressions showed no significant differences among the groups (P > .05) (Figs. 2 and 4). The NQO1 protein expression in the brain of MOD (P = .008; P = .006) and DIO (P = .034; P = .025) was also significantly upregulated compared to the CON and DR rats (Fig. 3).
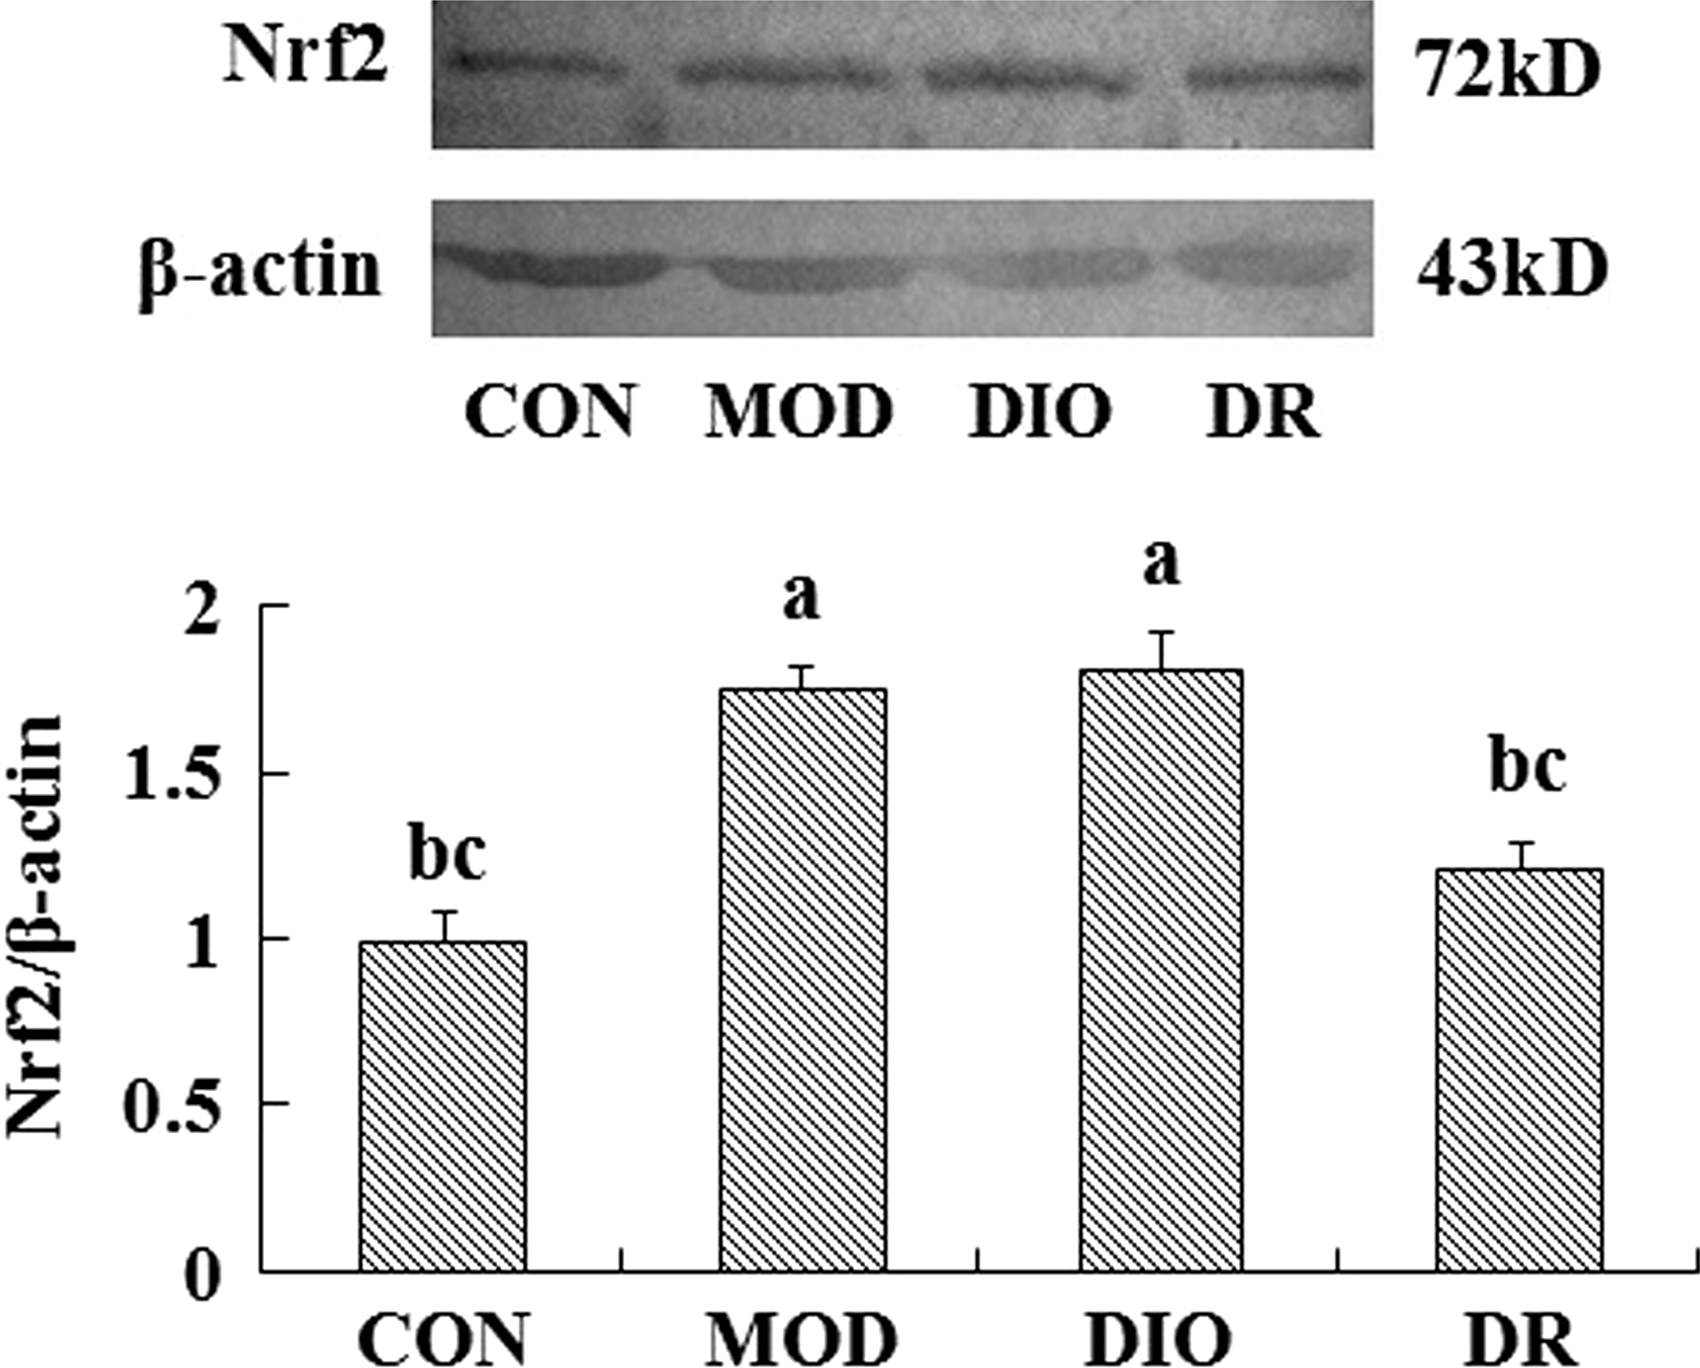
The Nrf2 expression in the brain of DIO and DR rats induced by HFD (mean ± SE, n = 4). Mean values were significantly different from those of the CON group: a P < .05; mean values were significantly different from those of the MOD group: b P < .05; mean values were significantly different from those of the DIO group: c P < .05. DIO, diet-induced obesity; DR, diet resistant; CON, control; HFD, high fat diet; MOD, oxidative stress; Nrf2, nuclear related factor 2; SE, standard error.
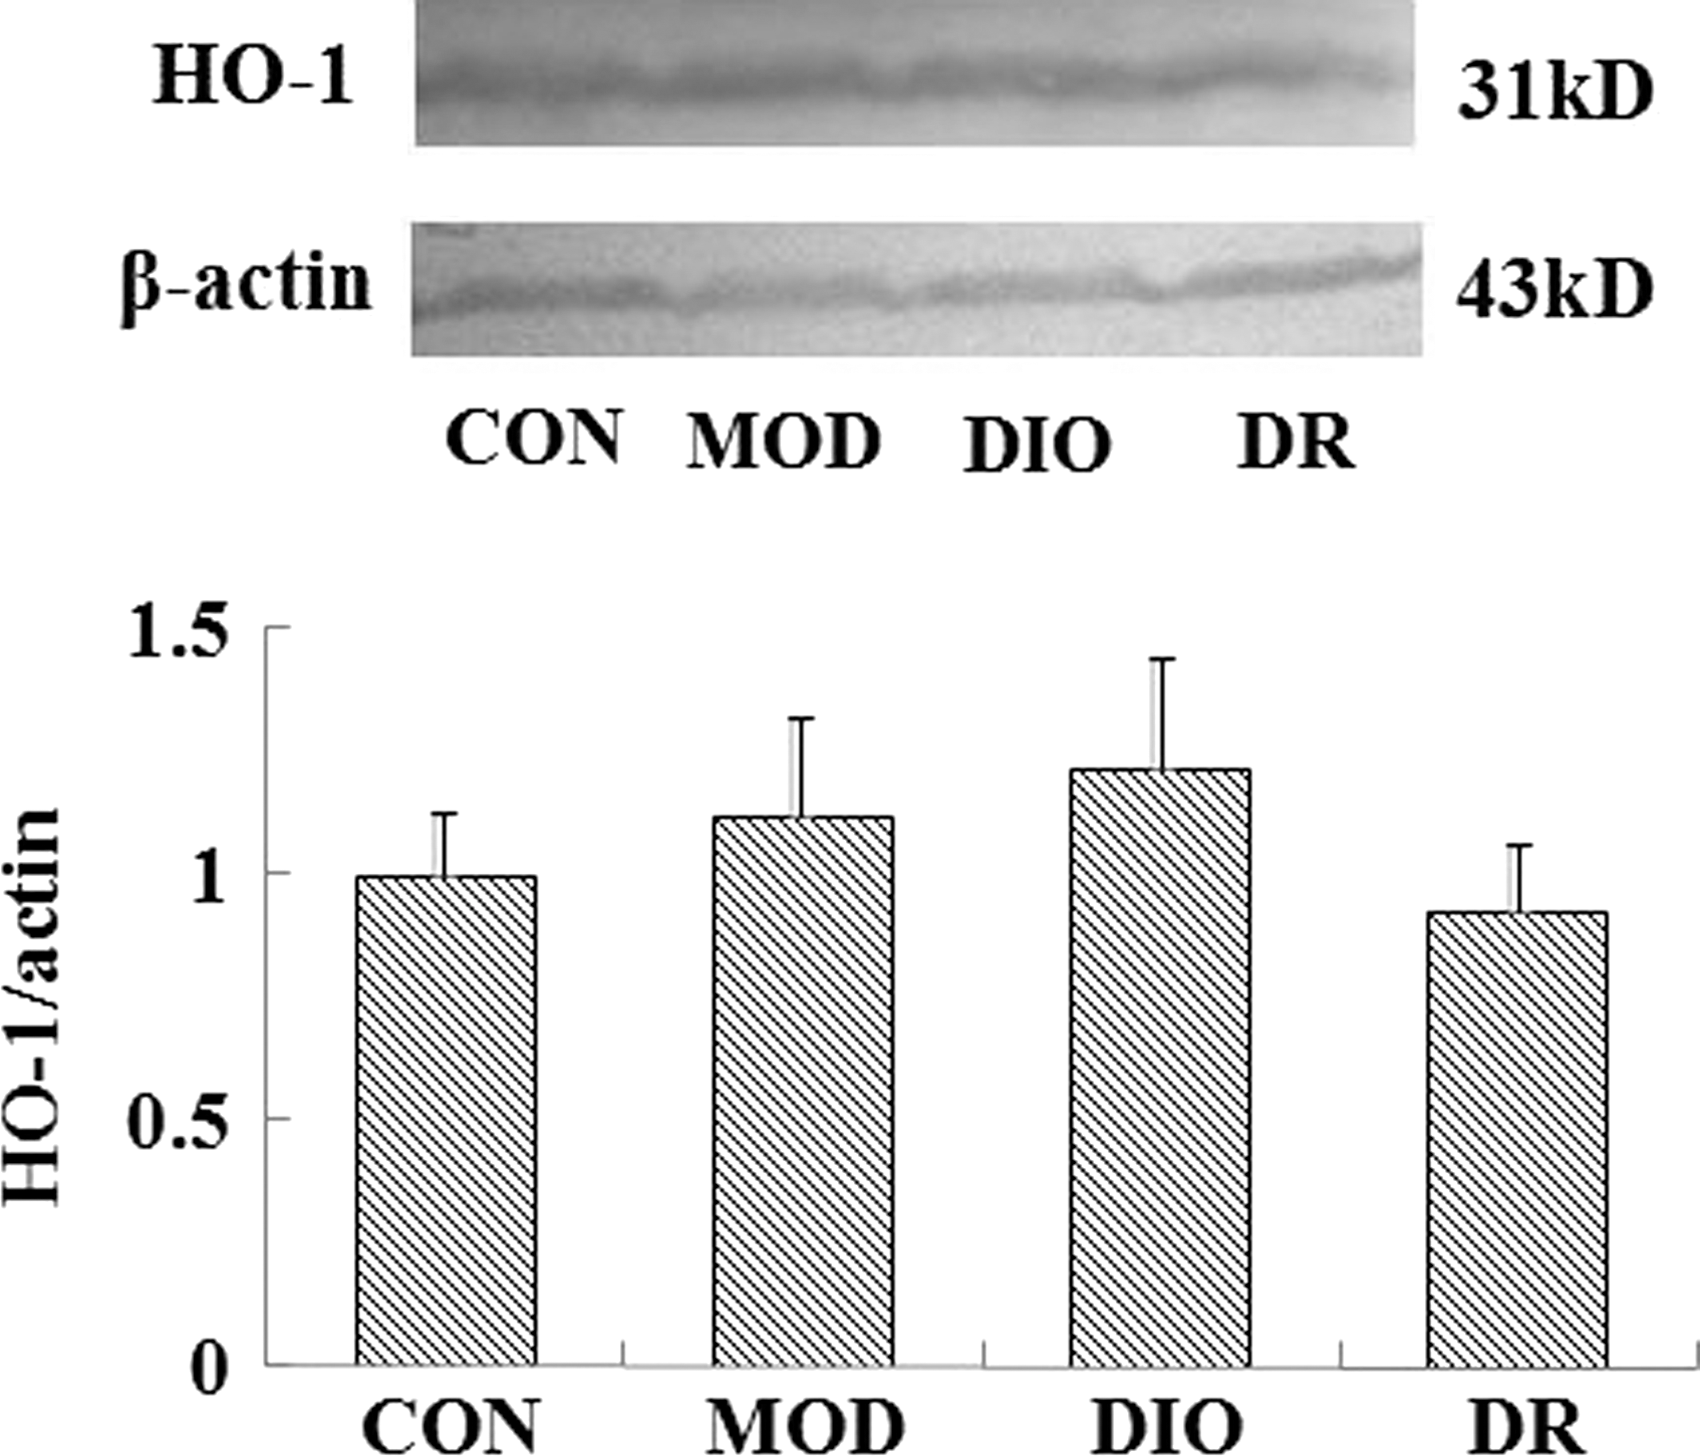
The HO-1 expression in the brain of DIO and DR rats induced by HFD (mean ± SE, n = 4). HO-1, heme oxygenase 1.
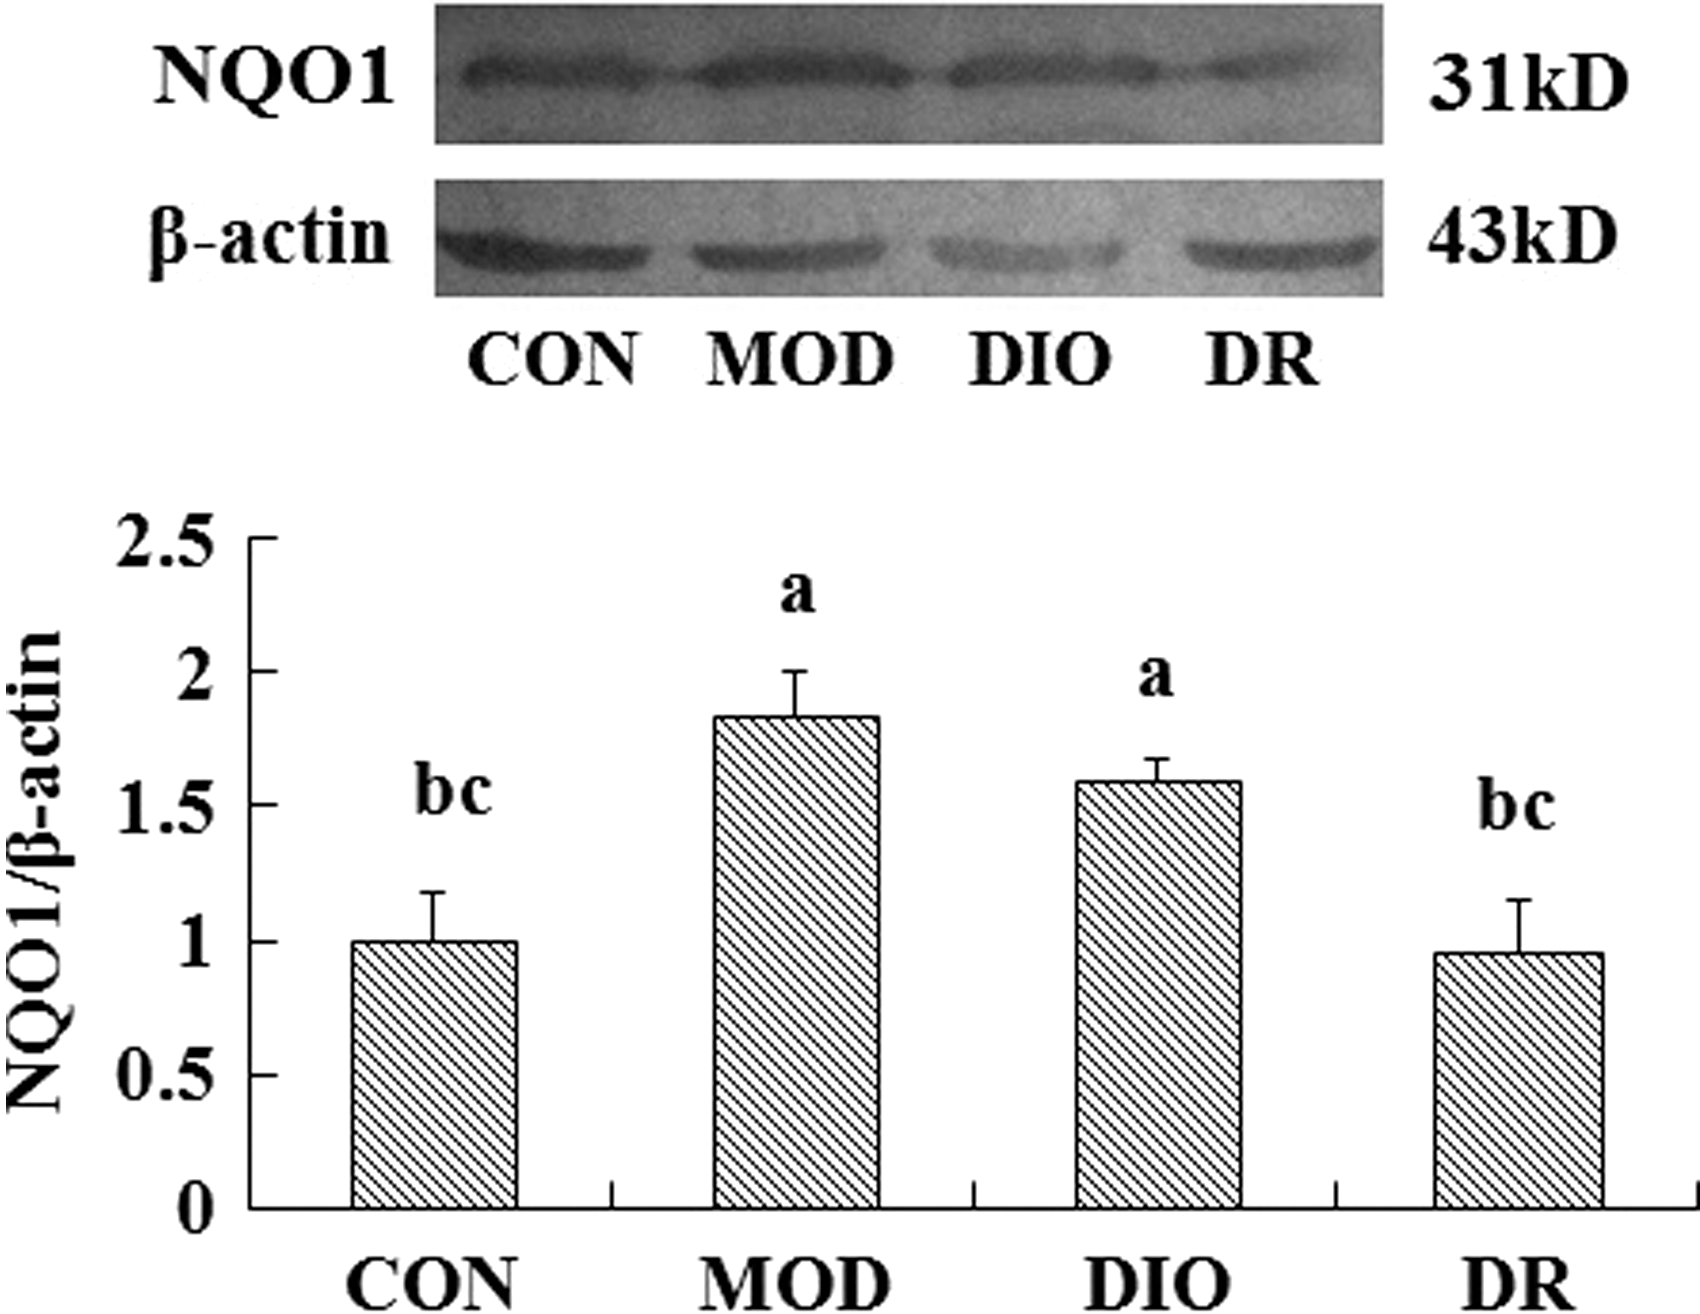
The NQO1 expression in the brain of DIO and DR rats induced by HFD (mean ± SE, n = 3). Mean values were significantly different from those of the CON group: a P < .05; mean values were significantly different from those of the MOD group: b P < .05; mean values were significantly different from those of the DIO group: c P < .05. NQO1, NAD(P)H quinone oxidoreductase 1.
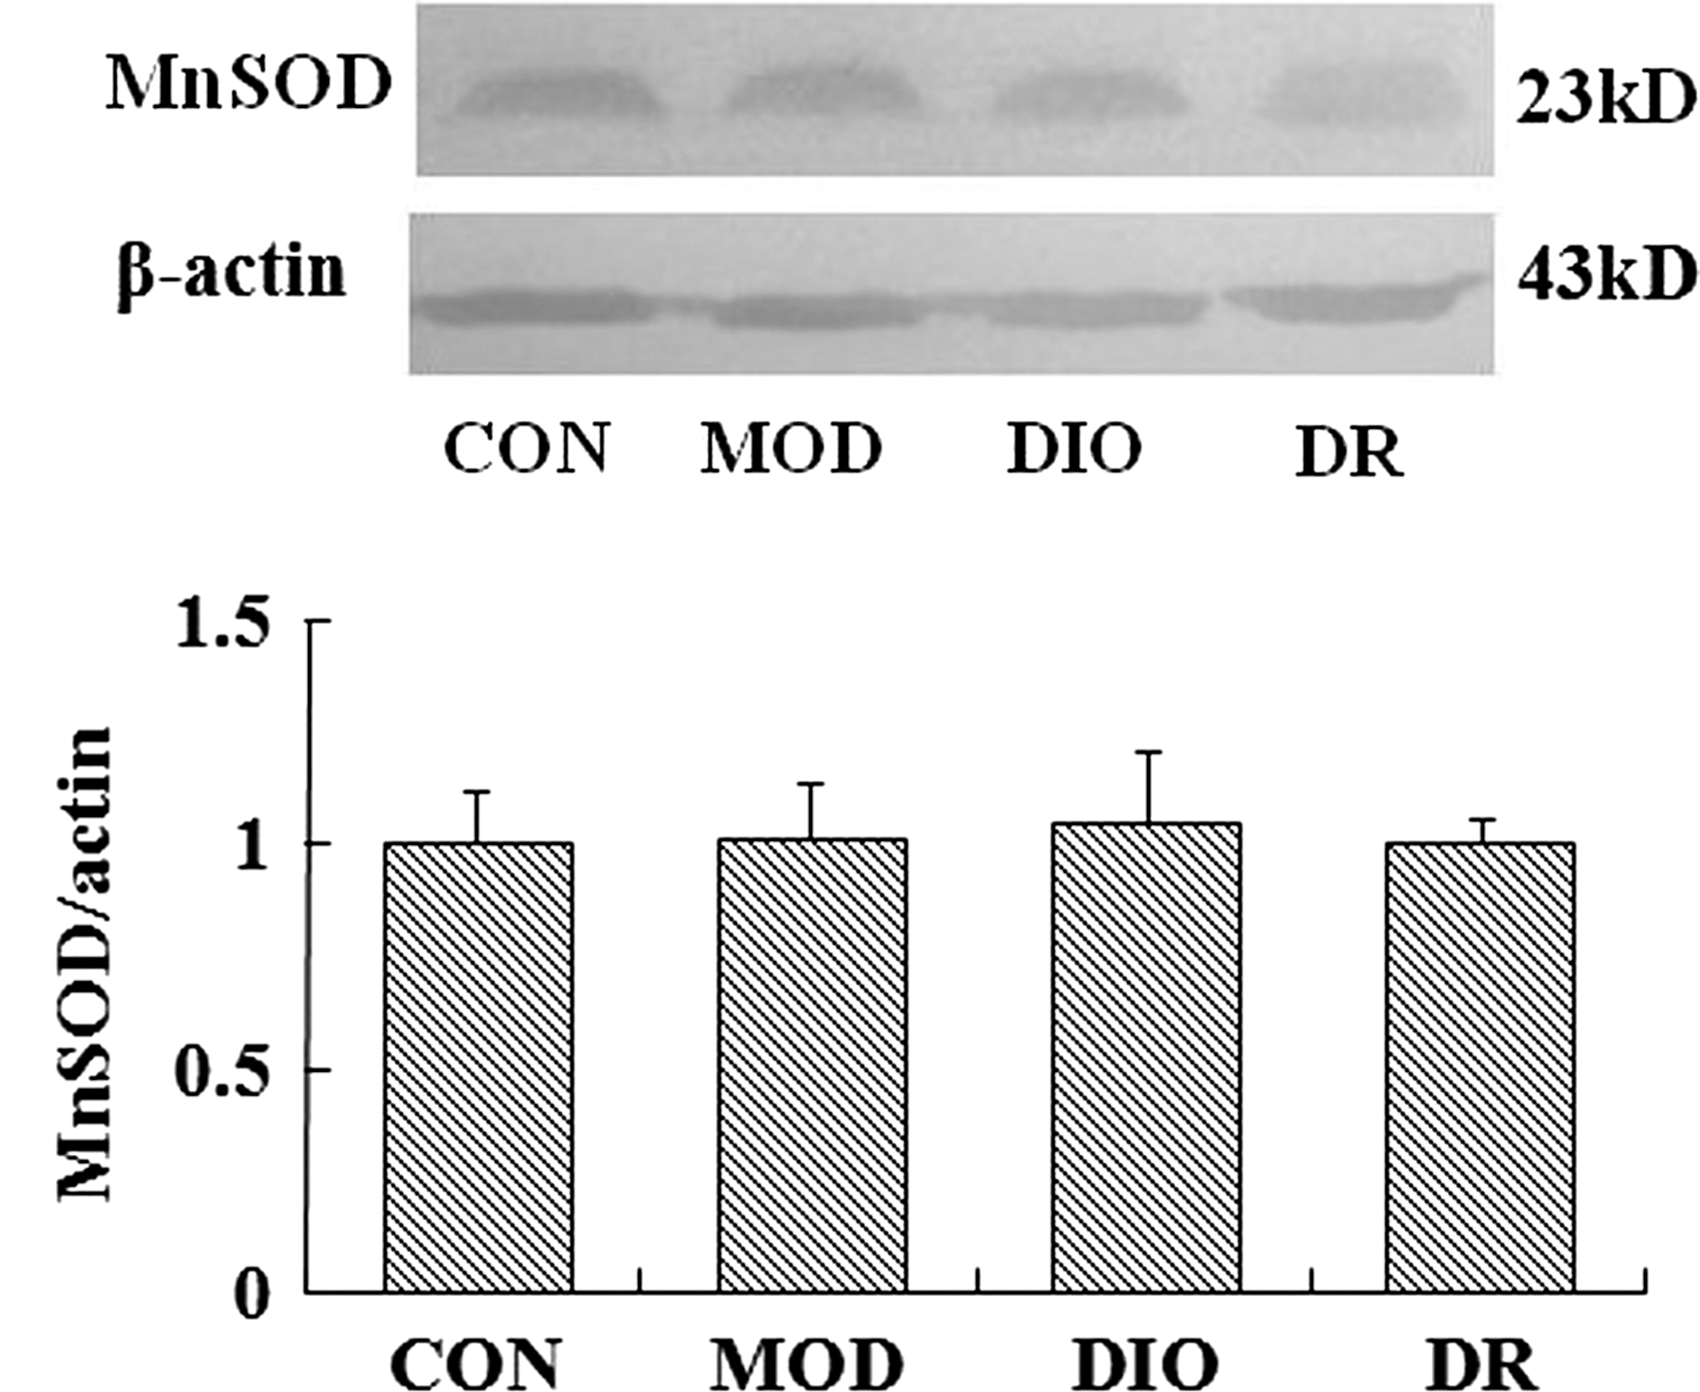
The MnSOD expression in the brain of DIO and DR rats induced by HFD (mean ± SE, n = 5). MnSOD, manganese superoxide dismutase.
Discussion
Consumption of HFD contributes to the onset of obesity. 17 DIO and DR rats were used to delineate the contributing factors to obesity induced by HFD. This model has been of great interest because the genesis of obesity proneness and resistance is similar to that in humans. 18 In our previous study, rats show distinct susceptibility to the development of obesity when fed with HFD. We classified rats as DIO and DR according to the amount of weight gained and the body fat mass after feeding with HFD for 10 weeks.
Our previous study showed that the final body weight, the perirenal fat, the testicular fat, omental fat, and the body fat mass of DIO rats were higher compared with DR rats. 19 The difference between DIO and DR rats seems to be the key factors related to obesity.
Obesity is associated with an increased risk of neurodegenerative disease characteristic with brain deficits; the brain damage may play an important role in obesity. 20 Thus, the present study was performed to examine the difference of redox state in the brain of DIO and DR rats. Oxidative stress status, defined as an excessive production of reactive oxygen species (ROS), may be related with the development of obesity. 21 The ratio between reduced GSH and GSSG has been used as an important biomarker of the redox balance in oxidative stress. 22 Thus, the GSH, GSSG concentrations, and GSH/GSSG ratio were tested both in the serum and brain of DIO and DR rats. In the present study, compared to CON group, DIO and MOD rats had higher levels of GSSG in serum, whereas the MOD rats showed a significantly decreased GSH level and decreased GSH/GSSG ratio in the brain. The levels of GSH in the brain of DR rats were higher and the GSH/GSSG ratio was higher compared with CON, MOD, and DIO rats. The results indicated that, in the brain tissues of DIO rats, the GSH was depleted with a concomitant increase in its oxidized form. Moreover, the GSSG is rapidly and efficiently exported to serum under oxidative stress in DIO rats.
GSH-Px is a peroxide decomposition enzyme in cells, which can catalyze GSH converting it to GSSG. GSH-Px was reported to be involved in obesity, but GSH-Px concentrations in the brain tissue of DIO and DR rats have not been studied. 23 In our study, the GSH-Px levels in the brain of DIO rats were significantly higher than that of DR rats, which indicate that the occurrence of oxidative in the brain of DIO rats, and GSH-Px was released to catalyze the transforming of GSH to GSSG.
Brain hormonal alterations were also associated with obesity, such as CCK, ghrelin, and PYY. 24 –26 DIO rats exhibited a different behavioral and neuronal response to CCK than DR rats. 24 The differences in PYY expression in DIO and DR rats were also reported. 27 CCK is among the most abundant neuropeptides expressed in the mammalian brain. 28 HFD may affect CCK stores so that there is less CCK available for release. Changes in CCK responsiveness seem to develop independent of adiposity. 29 In our study, we found that the PYY concentration in brain tissue showed no significant difference among the four groups. While the CCK concentration was increased in the brain of DR rats compared with that of CON rats, we did not find the difference of PYY and CCK between DIO and DR rats, which indicates that the HFD has no influence on PYY and CCK concentration in the brain tissue of both DIO and DR rats.
An increased production of ROS can lead to activation of stress-sensitive signaling pathways. The transcription factor Nrf2 plays a vital role in antioxidant response element-mediated expression of antioxidant enzymes as well as in the prevention of oxidative stress. 14 Recent studies pointed out that Nrf2-mediated signaling is also required for Nrf2-driven HO-1 expression and MnSOD expression in many chronic diseases such as diabetes. 30 NQO1 is a cytosolic reductase that plays important roles in the cellular response to oxidative stress. Upregulation of NQO1 has been shown to protect cells against various cytotoxic quinones and oxidative stress by catalyzing the reduction and detoxification of quinine substrates. The expression of NQO1 is elevated by oxidative stress or inflammatory stress through nuclear accumulation of Nrf2. Thus, in this work, we focused on Nrf2, HO-1, NQO1, and MnSOD expressions in the brain of DIO and DR rats.
The changes in the expressions of Nrf2 and activated NQO1 suggested that HFD indeed activates the transcription of key antioxidant genes by triggering the translocation of Nrf2 into the nucleus in DIO rats. As a protective protein, HO-1 plays a remarkable antioxidative role in various diseases. In our study, the HO-1 expression showed no significant difference between DIO and DR rats, which indicated that HFD could regulate Nrf2/NQO1 signaling pathway, but not MnSOD and HO-1 in DIO rats. Likewise, Matoušková et al. 31 observed upregulated Nrf2 and NQO1 in the liver of obese rats. Kim et al. 32 also observed increased levels of Nrf2 mRNA in obese mice. In the case of NQO1, Cheng et al. 33 also observed 3.6-fold NQO1 mRNA increase in livers of male obese mice. Similar to these studies, an enhanced expression of Nrf2 in the brain of obese rats is expected to play a role in protective adaptation. Accordingly, elevated activities of NQO1 may cause alterations in DIO rats, but not DR rats.
Conclusion
In summary, the results of this study suggest that an altered redox state in the brain of DIO rats has known to be important in obese rats compared to DR rats. These findings indicate that the redox state and Nrf2/NQO1 signaling pathway were alerted in DIO rats, but not in DR rats.
Footnotes
Acknowledgments
This work was supported by grants from the National Natural Science Foundation of China (No. 81102122 and No. 81472982). W.-W.M. contributed to the implementation of the experiment and the data analysis; B.-J.D. drafted the article and did the data analysis; L.-J.W. and Y.S. did the Western blot. R.X. designed the study and is the corresponding author.
Author Disclosure Statement
Everyone in our work has approved the final version of the article. No competing financial interests exist.