
Abstract
Crude okra (Abelmoschus esculentus L.) polysaccharide (RPS) was obtained by water extraction and alcohol precipitation. Three purified fractions of RPS, designated RPS-1, RPS-2, and RPS-3, were fractioned by diethylaminoethyl (DEAE)-cellulose chromatography. Their molecular weights, monosaccharide compositions, infrared (Fourier transform infrared [FT-IR]) spectra, and nuclear magnetic resonance (NMR) spectra were analyzed. Their immunomodulatory activity was evaluated with an in vitro cell model (RAW264.7 cells). In vivo immunomodulatory activity of RPS-2 was evaluated in normal and cyclophosphamide-induced immunosuppressed mice. The results showed that the molecular weights of RPS-1, RPS-2, and RPS-3 were 600, 990, and 1300 kDa, respectively. RPS-1 and RPS-2 were mainly composed of galactose, rhamnose, galacturonic acid, and glucuronic acid, while RPS-3 was mainly composed of galactose, rhamnose, galacturonic acid, glucuronic acid, and glucose. FT-IR and NMR spectrum data indicated a rhamnogalacturonan I characteristic of polysaccharide. Both RPS and its purified fractions RPS-1, RPS-2, and RPS-3 significantly increased RAW264.7 cell proliferation, nitric oxide (NO) production, inducible nitric oxide synthase (iNOS) expression, and tumor necrosis factor (TNF)-α, interferon (IFN)-γ, and interleukin (IL)-10 secretion (P < .05). The purified fraction RPS-2 also increased the spleen index, splenocyte proliferation, and cytokine secretion in vivo. These results indicate that okra polysaccharides may potentially serve as novel immunomodulators.
Introduction
O
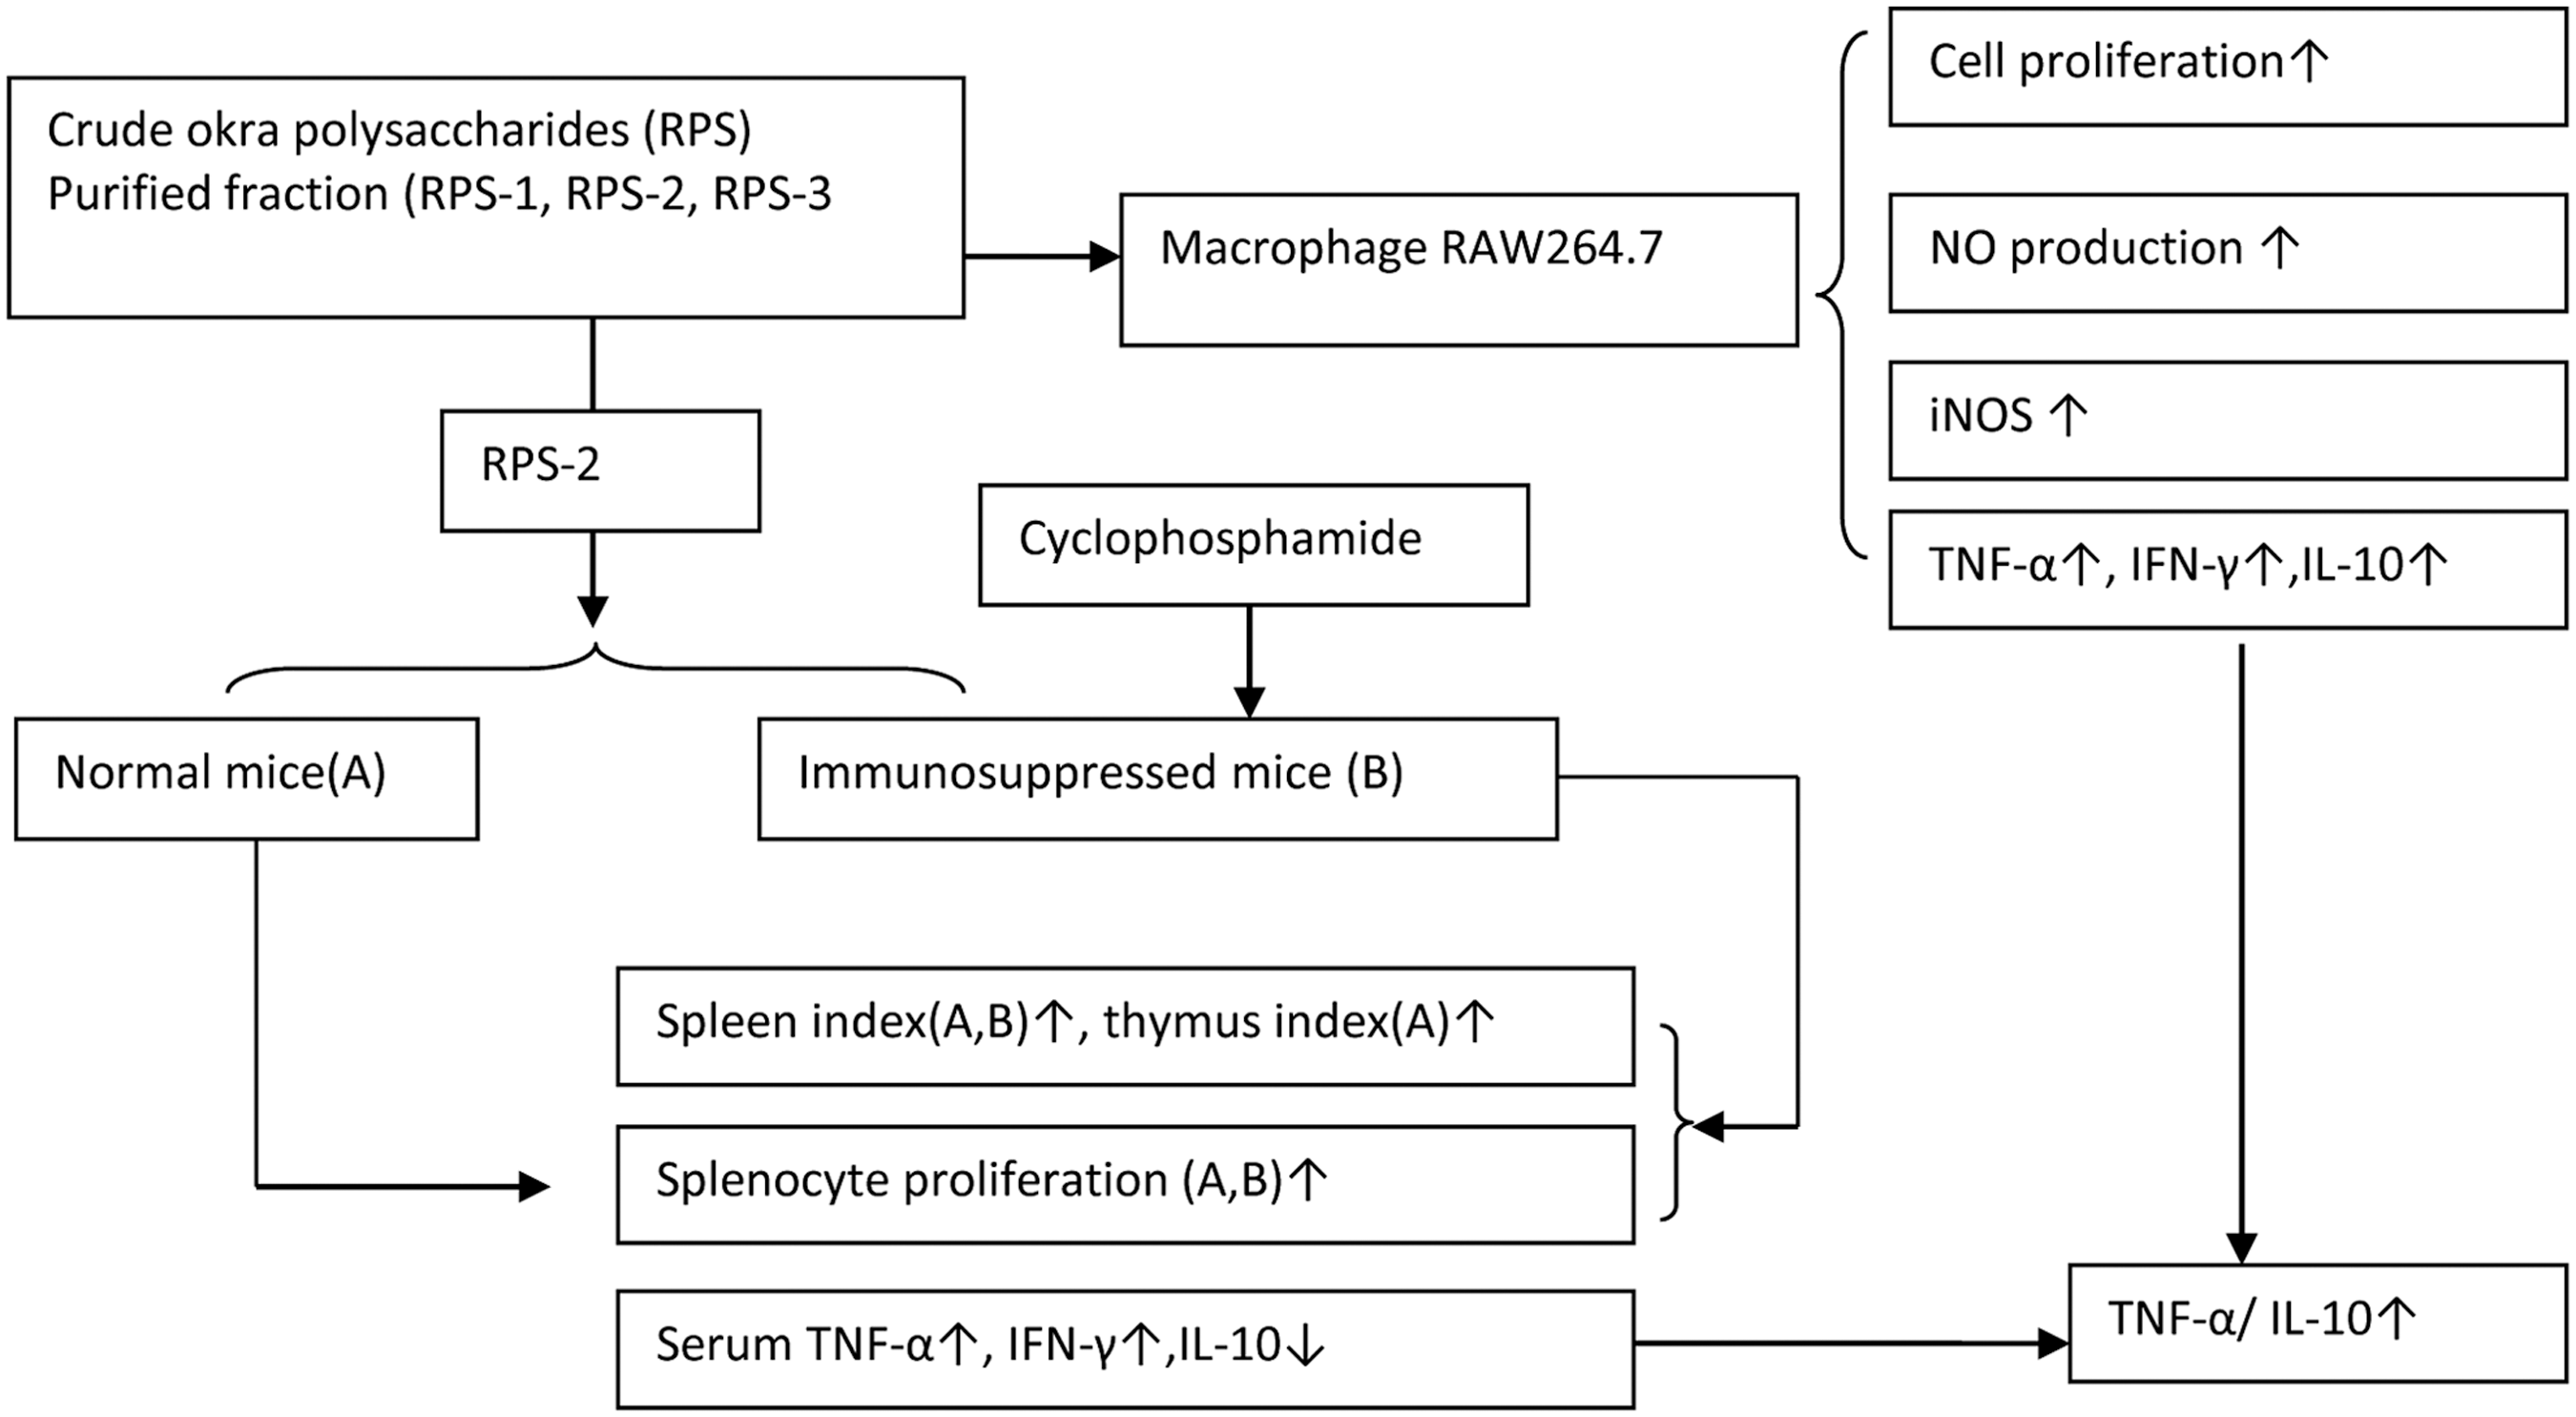
Schematic figure of immunomodulatory studies of okra polysaccharides.
Materials and Methods
Materials and reagents
Okra (Abelmoschus esculentus L.) fruits were purchased from Nan Guo supermarket in Haikou, China. RAW264.7 cells were purchased from the cell bank of the Chinese Academy of Science (Shanghai, China). Rabbit polyclonal anti-inducible nitric oxide synthase (iNOS) antibodies were purchased from Cell Signaling Technology (Beverly, MA, USA), glyceraldehydrate-3-phosphate dehydrogenase (GAPDH) rabbit monoclonal (mAb) and horseradish peroxidase (HRP)-conjugated goat anti-rabbit IgG were purchased from Santa Cruz Biotechnology (Santa Cruz, CA, USA). The Cell Counting kit-8 (CCK-8 kit) was purchased from Dojindo China Co. Ltd. (Shanghai, China). LPS (purified lyophilized powder) from Escherichia coli O111:B4 was purchased from Sigma-Aldrich (St. Louis, MO, USA). Rhamnose, arabinose, xylose, mannose, glucose, galactose, fucose, and galacturonic acid were also purchased from Sigma-Aldrich.
Animals
BALB/c inbred mice (8 weeks old, 18–20 g, half male and half female) were provided by the Laboratory Animal Center of Guangzhou. The animals were maintained on a 12-h dark/12-h light cycle at ∼20°C and allowed free access to standard laboratory pellet diet (Laboratory Animal Center of Guangzhou, Guangzhou, China) and water during the experiments. All animal experimental protocols complied with national legislation and company policy on the care and use of animals according to the related code of practice (Project License: SYXK [China, Hainan] 2014–0025 of the Pharmaceutical Institute of Hainan Province).
Isolation and purification of okra polysaccharides
Fresh okra pods (2.5 kg) were cleaned with distilled water, homogenized, and macerated with 9 L distilled water overnight. After centrifugation, the pellets were extracted twice with 4 and 3 L of distilled water, respectively. All the supernatants were collected, concentrated to 2 L at 70°C, and centrifuged at 4300 rpm (Sigma3k15; Sigma) for 5 min. The supernatant was precipitated by the addition of anhydrous ethanol to a final concentration of 65% (v/v) and incubation for 24 h. After centrifugation, the precipitate was dissolved in distilled water (1 L) and centrifuged again, and then, the supernatant was lyophilized. The crude okra polysaccharide (22.2 g) was obtained, named RPS (raw polysaccharides). RPS (15 g) was deproteinated using the Sevag reagent (chloroform:n-butanol = 4:1, v/v) and precipitated with ethanol. 19 After centrifugation, the precipitate was collected and lyophilized, producing the deproteinated polysaccharide named deproteinated rough polysaccharide (DRPS) (13.2 g).
DRPS (5 g) was redissolved in 200 mL of distilled water with stirring overnight. After centrifugation, the supernatant was applied to a diethylaminoethyl (DEAE)-cellulose column (8.0 × 20 cm). DRPS was sequentially eluted with distilled water (2 L), 0.25 M phosphate-buffered saline (PBS; 4 L), 0.5 M PBS (3 L), and 0.5 M NaOH (3 L) at a flow rate of 13 mL/min. Each eluate was concentrated, dialyzed, and lyophilized, yielding three main fractions: RPS-1 (0.25 M PBS), RPS-2 (0.5 M PBS), and RPS-3 (0.5 M NaOH). The fractions were diluted in Dulbecco's modified Eagle's medium (DMEM) to a concentration of 2 mg/mL and filtered through sterile 0.22 μm filters.
Preliminary characterization of okra polysaccharide
General methods
The phenol-sulfuric acid method was used to determine the total sugar content. 20 The standard was a combination of various monosaccharides prepared according to sugar composition. The Coomassie Brilliant Blue staining method was performed to determine the protein content, with bovine serum albumin used as a standard. A modified sulfamate/m-hydroxydiphenyl method was performed to determine the uronic acid content, 21 with galacturonic acid as the standard.
Homogeneity and molecular weight determination
The homogeneity and the molecular weights of the polysaccharide fractions were determined by high-performance gel-permeation chromatography (HPGPC) using a LC-10ATvp Plus HPLC system (Shimadzu, Tokyo, Japan), equipped with a Superose 6 prep grade column (7.5 × 300 mm; Shimadzu) and an RID-10A detector (Shimadzu). The column temperature was 25°C. Samples of okra polysaccharides were filtered (0.45 μm) before injection and eluted with 0.2 M NaCl solution at a flow rate of 0.8 mL/min. The standard curve was established with T-series dextrans of known molecular weight, based on the elution volume and the molecular weight.
Determination of the monosaccharide compositions
High-performance liquid chromatography (HPLC) was applied to analyze the monosaccharide compositions of the polysaccharides. 22,23 Briefly, a polysaccharide (2 mg) was hydrolyzed first by methanolysis with 2 M MeOH/HCl at 80°C for 16 h and then by acid hydrolysis with 2 M trifluoroacetic acid (TFA) at 120°C for 1 h. The resulting monosaccharides were derived with 1-phenyl-3-methyl-5-pyrazolone and subsequently separated on a precalibrated DEAE-cellulose column (8.0 × 20 cm) assembled on a Shimadzu HPLC system. 24 The column was eluted with 18% (v/v) acetonitrile in PBS (0.1 M, pH 7.0) at a flow rate of 1 mL/min. The absorbance at 245 nm was monitored.
IR spectroscopy
FT-IR analysis of RPS was carried out using the potassium bromide (KBr) pellet method with a NEXUS 670 FT-IR spectrophotometer (Thermo Nicolet; Thermo Electron Corporation, Madison, WI, USA) in the range 400–4000 cm.
Nuclear magnetic resonance spectra analysis
The 13C-nuclear magnetic resonance (NMR) spectrum was obtained on a Bruker AV600 spectrometer at 75 MHz. The sample (20 mg) was dissolved in deuterated water (1 mL, 99.8%) with overnight stirring at room temperature. The spectrums were recorded at 25°C after 57,000 scans.
In vitro macrophage stimulatory activity assay
Cell culture
The RAW264.7 mouse macrophage cell line was cultured as previously described. 25 Twelve hours before starting the experiments, cells were seeded in 24-well tissue culture plates at a density of 2 × 10⁵ cells/mL for the measurement of nitric oxide (NO) release and iNOS expression. All the experiments were repeated thrice.
Cytotoxicity assay
To evaluate the possible cytotoxic effects of the tested samples, the cell viabilities of RAW264.7 macrophages cells treated with RPS, RPS-1, RPS-2, or RPS-3 at a concentration of 200 μg/mL were determined by the CCK-8 kit, according to the manufacturer's instructions. In brief, RAW264.7 cells were preincubated in 96-well plates at a density of 2 × 10⁴ cells/mL for 12 h. The supernatant was replaced with a new culture medium in the absence or presence of polysaccharides at a concentration of 200 μg/mL, and then cultured at 37°C in a humidified incubator with 5% CO2 and 95% air for 24 h. The supernatants were discarded, 10 μL aliquots of CCK-8 reagent were added, and then cultured in the incubator for 0.5–4 h. The absorbance was measured at 490 nm on a Bio-Rid 680 microplate reader every 15 min. The cell viability was described as the survival rate (%) compared with the mean absorbance of the control. Noncytotoxic doses of RPS, RPS-1, RPS-2, and RPS-3 were selected to conduct macrophage stimulation.
Cell survival rate% = (As − Ab)/(Ac − Ab) × 100%, where As was the absorbance of the experimental well (cell with culture medium, CCK-8, polysaccharides), Ac was the absorbance of control well (cell with culture medium, CCK-8, no polysaccharides), and Ab was the absorbance of blank well (culture medium, CCK-8, no cell and polysaccharides).
NO assay
After preincubation of RAW264.7 cells (2 × 10⁵ cells/mL) for 12 h, cells were treated with RPS, RPS-1, RPS-2, and RPS-3 at different concentrations (25, 50, 100, and 200 μg/mL) or LPS (1 μg/mL) for 24 h, in 2 mL of culture medium. The inductive effect on NO production was determined by analyzing NO levels with the Griess reagent, according to manufacturer's instructions. Briefly, 50 μL of cell culture supernatants were transferred to 96-well plates and then mixed with equal volumes of Griess reagent. The samples were incubated for 15 min at room temperature. The optical densities were measured at 570 nm using a Bio-Rad 680 microplate reader (Bio-Rad Laboratories, Inc., Hercules, CA, USA) and nitrite concentration was determined using a standard curve generated with known concentrations of NaNO2.
Western blotting
After preincubation of RAW264.7 cells (2 × 10⁵ cells/mL) for 12 h in 24 well plates, cells were treated with okra polysaccharides and LPS for 24 h. Following culture, iNOS expression induced by RPS, RPS-1, RPS-2, RPS-3, and LPS was detected by western blot as previously described. 25 In brief, cells were harvested, lysed, and 40 μg total protein was loaded onto a 12% sodium dodecyl sulfate (SDS)–polyacrylamide gel and then transferred to a nitrocellulose membrane. The membranes were blocked by incubation in the PBS buffer containing 0.1% Tween 20 and 5% skim milk powder for 2 h. The membranes were then incubated for 2 h with primary antibodies at a 1:1000 dilution (rabbit polyclonal anti-iNOS antibody; GAPDH rabbit mAb). After three washes, the membranes were incubated with HRP-conjugated goat anti-rabbit IgG (1:1000) for 1.5 h and then developed with an enhanced chemiluminescent method kit for 30–300 sec. The bands were detected by Gel Imaging System (Bio-Rad Laboratories, Inc.). Bandscan 5.0 software was used to quantify the western blots for protein expression.
In vivo experiment
Design of in vivo experiment
BALB/c inbred mice were randomly divided into eight groups, each consisting of 10 mice and allowed 1 week to adapt to their environment before the treatments. Groups of mice with different treatments in in vivo experiments are shown in Table 1. The first group was the normal control group, treated only with normal saline (NS) solution (0.9% g/mL) by intraperitoneal injection on days 1, 3, 5, 6, and 7. The second group was the immunosuppressed group, treated only with cyclophosphamide (Cy) at a dose of 100 mg/kg at day 6 by intraperitoneal injection. Three of the eight groups were RPS-2 groups treated only with RPS-2 at doses of 25, 50, or 100 mg/kg bodyweight on days 1, 3, 5, and 7 and treated with NS on day 6. The other three of the eight groups were RPS-2+Cy groups, treated with RPS-2 at a dose of 25, 50, or 100 mg/kg body weight on days 1, 3, 5, and 7 and with 100 mg/kg Cy by intraperitoneal injection on day 6. On day 9, the animals were weighed and blood samples were collected to obtain serum, and then the animals were killed by decapitation; the spleen and thymus were excised from the animal and weighed immediately and then placed in cold PBS. The relative spleen and thymus size were calculated according to the following formula: spleen or thymus index (mg/g) = (weight of spleen or thymus weight/body weight).
Cy, cyclophosphamide; NS, normal saline; RPS-2, raw polysaccharides-2.
Preparation of mouse splenocytes
Splenocytes were prepared as described by Kim et al. 26 In brief, the murine spleens were gently homogenized and passed through a sterilized copper sieve (200 mesh) to obtain single cell suspensions. After centrifugation, the red blood cells were removed by treatment with red blood cell lysis buffer (NH4Cl-Tris). Then, after washing twice with DMEM, the splenocytes were resuspended in complete DMEM (with 10% fetal calf serum, 1% glutamine, 100 unit/mL penicillin, and 100 μg/mL streptomycin) and adjusted to a density of 5 × 10⁶ cells/mL.
Splenocyte proliferation assay
Splenocyte proliferation was assessed using the CCK-8 kit according to manufacturer's instructions. In brief, the cell suspension (50 μL/well) was seeded into four wells of a 96-well plate, thereafter the polysaccharide (final concentration 25, 50, and 100 μg/mL) was added giving a final volume of 100 μL. Con A (10 μg/mL) and LPS (1 μg/mL) were used for measuring the proliferation of T and B lymphocyte in splenocyte cultures. After incubation at 37°C in a humidified incubator with 5% CO2 and 95% air for 24 h, aliquots of 10 μL of CCK-8 reagent were added and then cultured in the incubator for another 2–4 h. The absorbance was measured at 450/630 nm on a Bio-Rad 680 microplate reader.
Macrophage cytokine secretion
Cytokine levels in the serum of the different groups and the supernatant of cultured RAW264.7 macrophages stimulated by okra polysaccharides were tested by commercial enzyme-linked immunoabsorbent assay kits (Excell Bio, Shanghai, China), according to the manufacturer's instructions. RAW264.7 cells (2 × 10⁵ cells/well) were cultured with different concentrations of RPS, RPS-1, RPS-2, and RPS-3 (final concentrations of 25, 50, 100, and 200 μg/mL) and LPS (1 μg/mL) for 24 h at 37°C, and their supernatants were collected to detect levels of interferon (IFN)-γ, tumor necrosis factor (TNF)-α, and interleukin (IL)-10.
Statistical analysis
Statistical calculations were carried out using SAS software (SAS Institute, Inc., Cary, NC, USA). Data are reported as the mean ± standard deviation of three (or 10) repeats. One-way analysis of variance and Duncan's test were used to determine the statistical significance between groups. A P-value of <.05 was considered statistically significant.
Results
Isolation and purification of okra polysaccharide
Fresh okra pods (2.5 kg) were extracted with water at room temperature, precipitated with 65% ethanol, lyophilized, and 22.2 g of total crude okra polysaccharide was obtained, a yield of 0.89%. The sugar content was 45.5% and the protein content was 6.3%. The lyophilized crude polysaccharide RPS (15 g) was deproteinated using the Sevag reagent and 13.2 g of DRPS was obtained, with a protein content of 4.6% and a yield of 0.88%. DRPS (5 g) was fractioned by ion-exchange chromatography on a DEAE-cellulose column, eluted with distilled water, PBS, and NaOH, sequentially. Four peaks were observed, the fractions of the three main peaks were named RPS-1 (eluted with 0.25 M PBS), RPS-2 (eluted with 0.5 M PBS), and RPS-3 (eluted with 0.5 M NaOH) (Fig. 2A).

Isolation, purification, and molecular weight of okra polysaccharides.
Preliminary characterization of okra polysaccharides
Homogeneity and molecular weight determination
HPGPC was applied to determine the molecular weight and homogeneity of polysaccharides. Each elution profile showed a single and symmetrically sharp peak, revealing RPS-1, RPS-2, and RPS-3 to be homogeneous polysaccharides. The molecular weight of RPS-1, RPS-2, and RPS-3 were 600, 990, and 1300 kDa, respectively (Fig. 2B–D).
Chemical properties and monosaccharide composition
Table 2 shows that the total sugar contents of RPS, RPS-1, RPS-2, and RPS-3 were 45.5%, 89.3%, 91.2%, and 94.9%, respectively. The uronic acid content was 21.3%, 27.5%, 29.3%, and 35.9%, respectively. The monosaccharide composition of RPS was mainly galactose (40%), rhamnose (29.9%), galacturonic acid (13.9%), and glucuronic acid (9.4%). The purified fractions RPS-1 and RPS-2 were mainly composed of galactose (33.1% and 35.5%), galacturonic acid (31.9% and 31.4%), rhamnose (20% and 20.3%), and glucuronic acid (11.4% and 11.7%). RPS-3 was mainly composed of galacturonic acid (25.1%), galactose (21.6%), galacturonic acid (17.8%), glucose (14.9%), and rhamnose (11.8%) (Table 1). In addition, the protein contents of RPS and DRPS were 6.3% and 4.8%, respectively. These results demonstrated that RPS-1, RPS-2, and RPS-3 had different chemical compositions.
Yield = (weight of crude polysaccharide/weight of fresh fruit) ×100.
Yield = (weight of fractionated polysaccharide/weight of crude polysaccharides injected for ion-exchange chromatography) ×100.
PBS, phosphate-buffered saline; nd, not detected.
Analysis of IR spectrum
The IR spectrum of RPS-1, RPS-2, and RSP-3 are shown in Figure 3A–C. The very wide stretching vibration absorption peak at 3440 cm−1 was caused by -OH. The peak at 2931 cm−1 and deformed peak at 1415 cm−1 was from stretching vibration of C-H. The unsymmetrical peaks at 1612–1618 cm−1 were derived from C = O stretching vibration. The C = O symmetrical stretching vibration absorption peak at 1311–1417 cm−1 is the characteristic absorption peak of protonated carboxyl in uronic acid, and the peak at 1149–1143 cm−1 is also characteristic of uronic acid. Absorption peaks at 894 cm−1 and 840 cm−1 are characteristic of the β-configuration and α-configuration, respectively.

FT-IR spectrum and 13C-NMR (75 MHz, D2O, 25°C) spectrum of okra polysaccharides. FT-IR spectrum of RPS-1
Analysis of 13C-NMR spectrum
13C-NMR analysis results are presented in Figure 3D–F. The anomeric configuration determination by 13C-NMR spectroscopic analysis was in accordance with the FT-IR and indicated the rhamnogalacturonan I characteristic of polysaccharides.
Effect of okra polysaccharides on RAW264.7 macrophage cell viability
The results of the cell cytotoxicity assay indicate that compared with the negative control (NC), the survival rate of cells treated with RPS, RPS-1, RPS-2, and RPS-3 at a concentration of 200 μg/mL was significantly increased (P < .05). Furthermore, the cell viability was similar to or higher compared with the positive control (PC; LPS treatment), and there were no significant differences between the RPS, RPS-1, RPS-2, and RPS-3 groups and the PC, which suggests that the polysaccharides have no cytotoxic effects on RAW264.7 macrophages at the concentration of 200 μg/mL (Table 3).
Cells were treated with different polysaccharides at 200 μg/mL for 24 h, and then a CCK-8 assay performed as described in the text. Values are mean ± SD (n = 3). Different superscripts indicate a significant difference (P < .05).
NC, negative control; SD, standard deviation.
Effect of okra polysaccharides on NO production by RAW264.7 macrophages
All the polysaccharides were able to stimulate RAW264.7 macrophages to produce NO compared with the NC (Fig. 4A–D). From concentrations of 50–200 μg/mL, RPS significantly increased NO production compared with the NC. RPS-1 and RPS-3 also significantly increased NO production from concentrations of 25–200 μg/mL. RPS-2 significantly increased NO production at concentrations from 100 to 200 μg/mL. At a concentration of 200 μg/mL, the amount of NO in the different treatment groups was similar to that of the PC, with no significant differences in the NO level in RAW264.7 cells stimulated by the three different purified fractions (Fig. 4E).
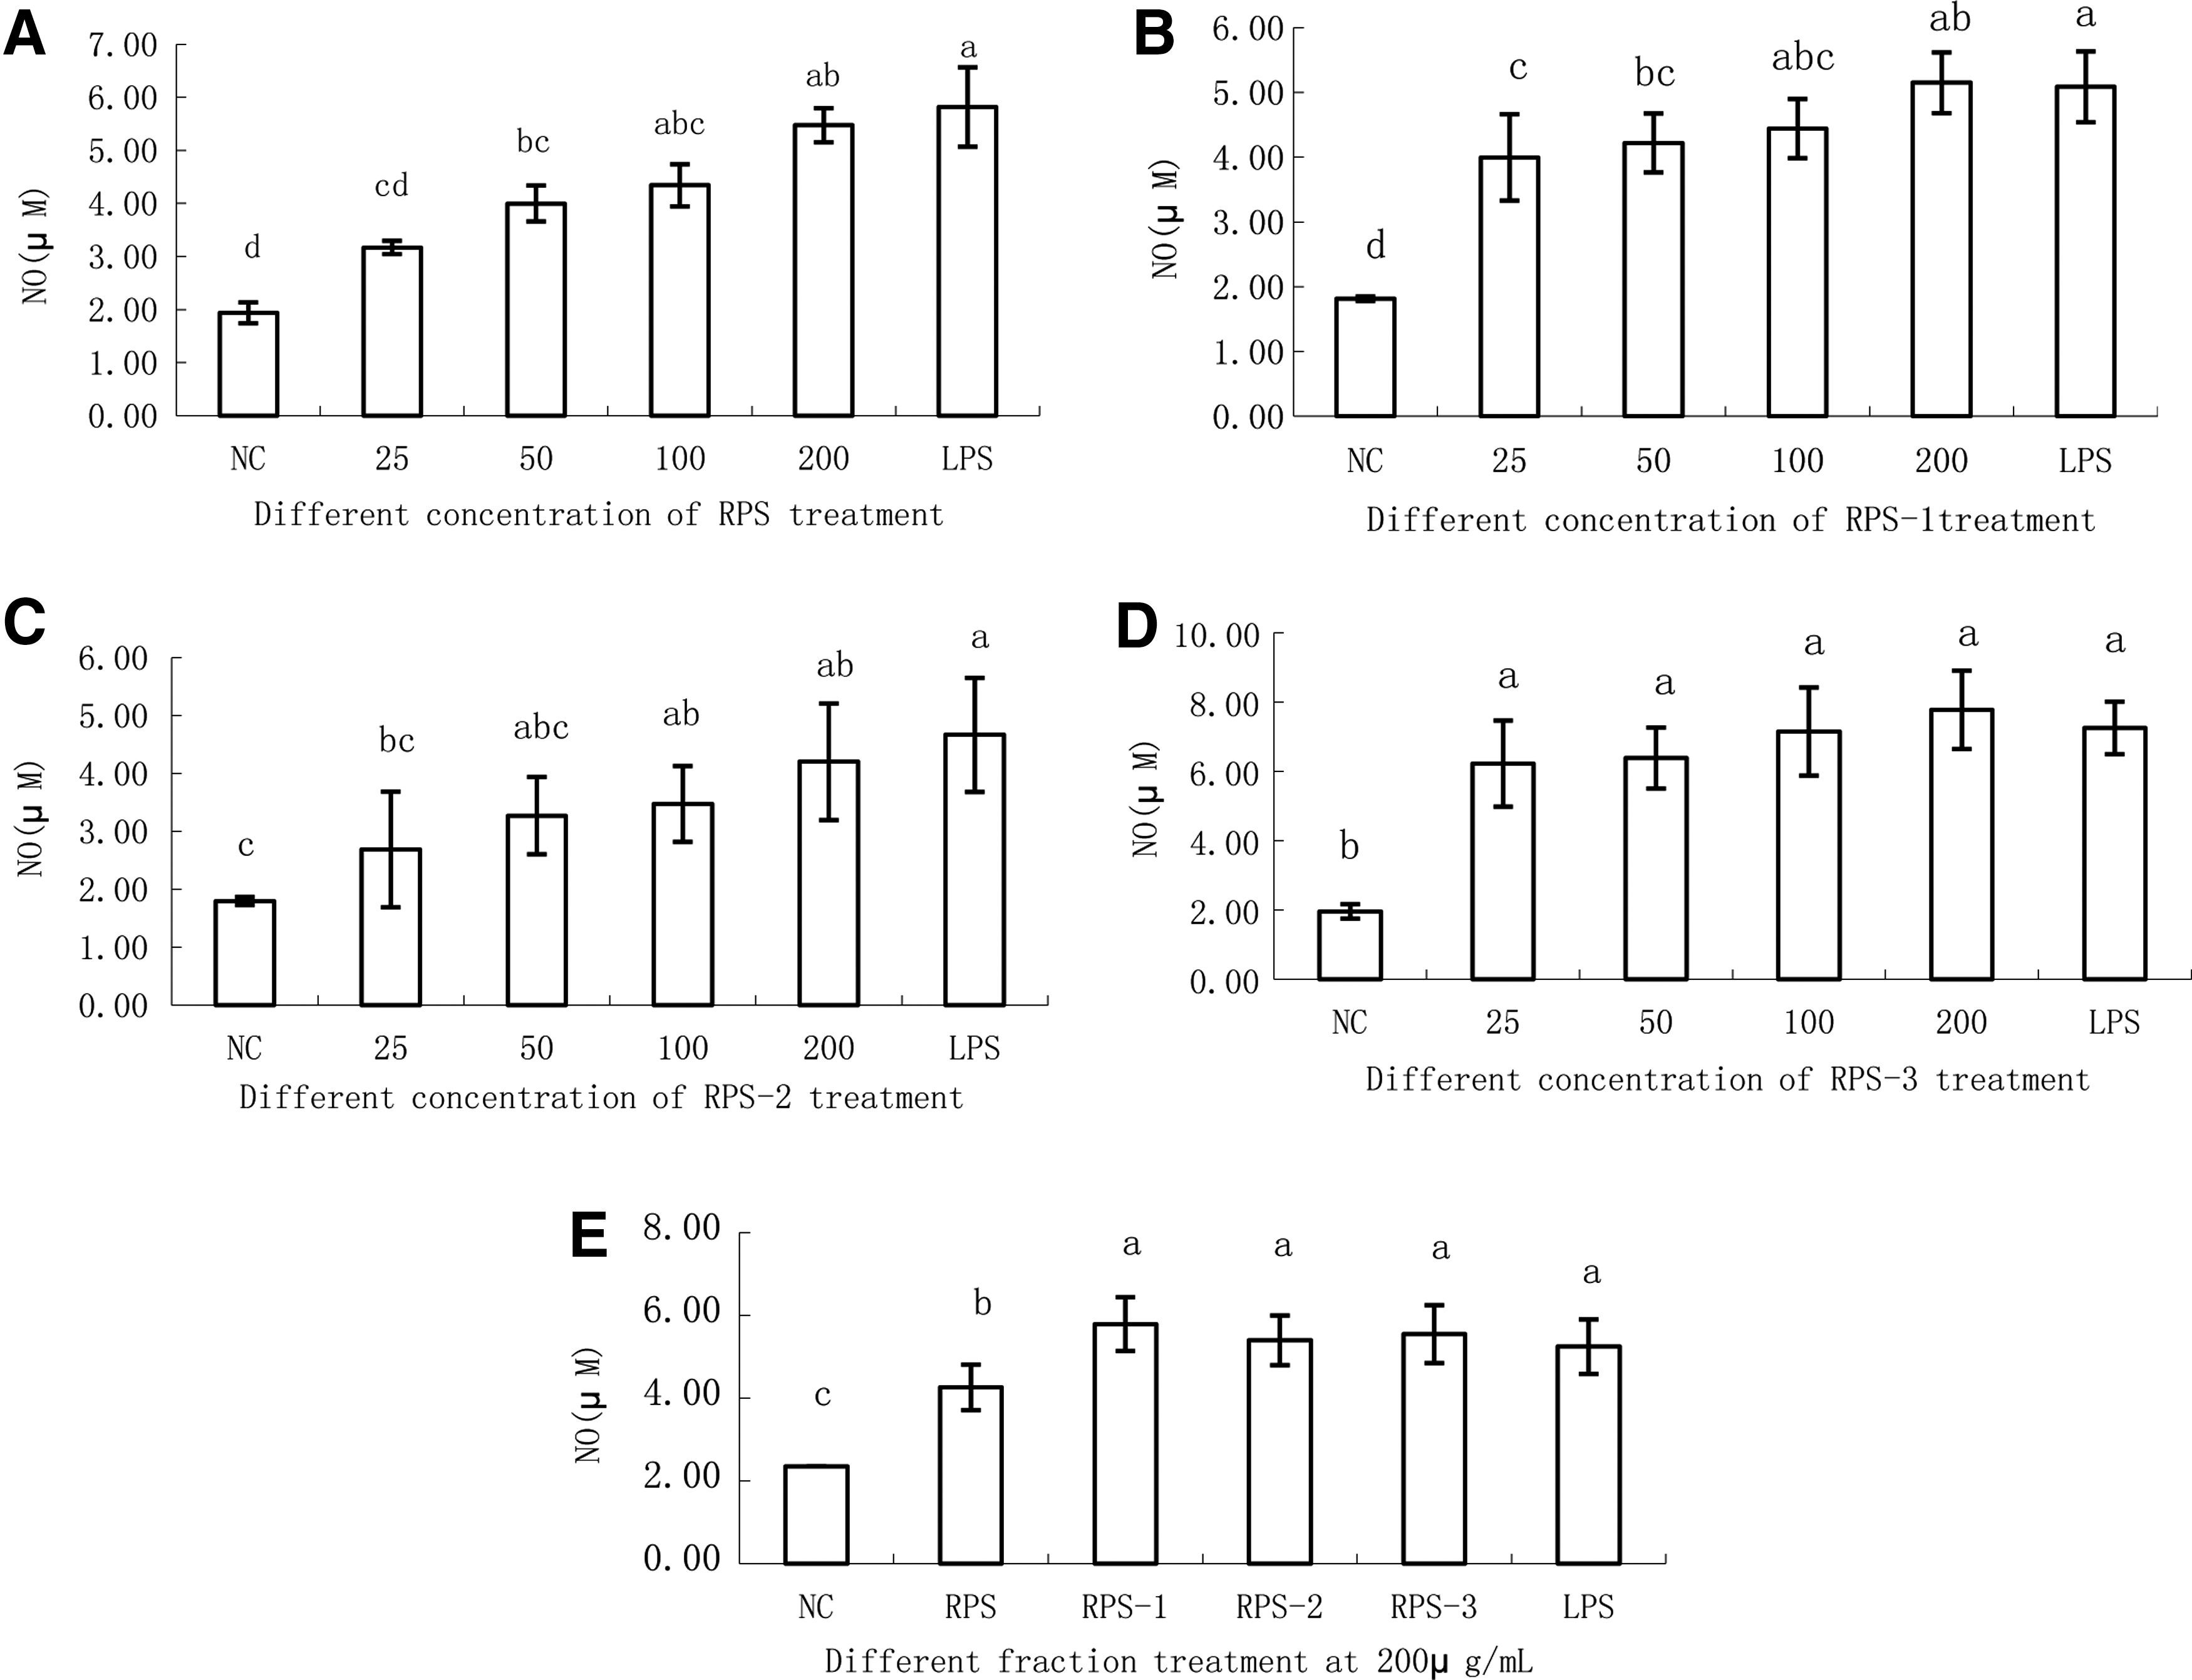
Effects of different polysaccharide fractions on NO production by RAW264.7 cells. Raw264.7 cells were stimulated by culture medium in the control (R) or by the polysaccharides RPS
Effect of okra polysaccharides on iNOS production by RAW264.7 macrophages
In macrophages, NO is usually synthesized through iNOS activation. To elucidate whether the promotion of NO was related to upregulation of iNOS activity, we detected iNOS protein expression by western blot (Fig. 5A–G). The result showed that iNOS protein expression was significantly increased in the RPS, RPS-1, and RPS-3 treatment groups compared with the NC at concentrations between 25 and 200 μg/mL polysaccharide in a dose-dependent manner. RPS-2 treatment at the lower concentrations of 25–50 μg/mL showed no significant effects; however, at concentrations of 100–200 μg/mL, iNOS protein expression was also significantly increased.
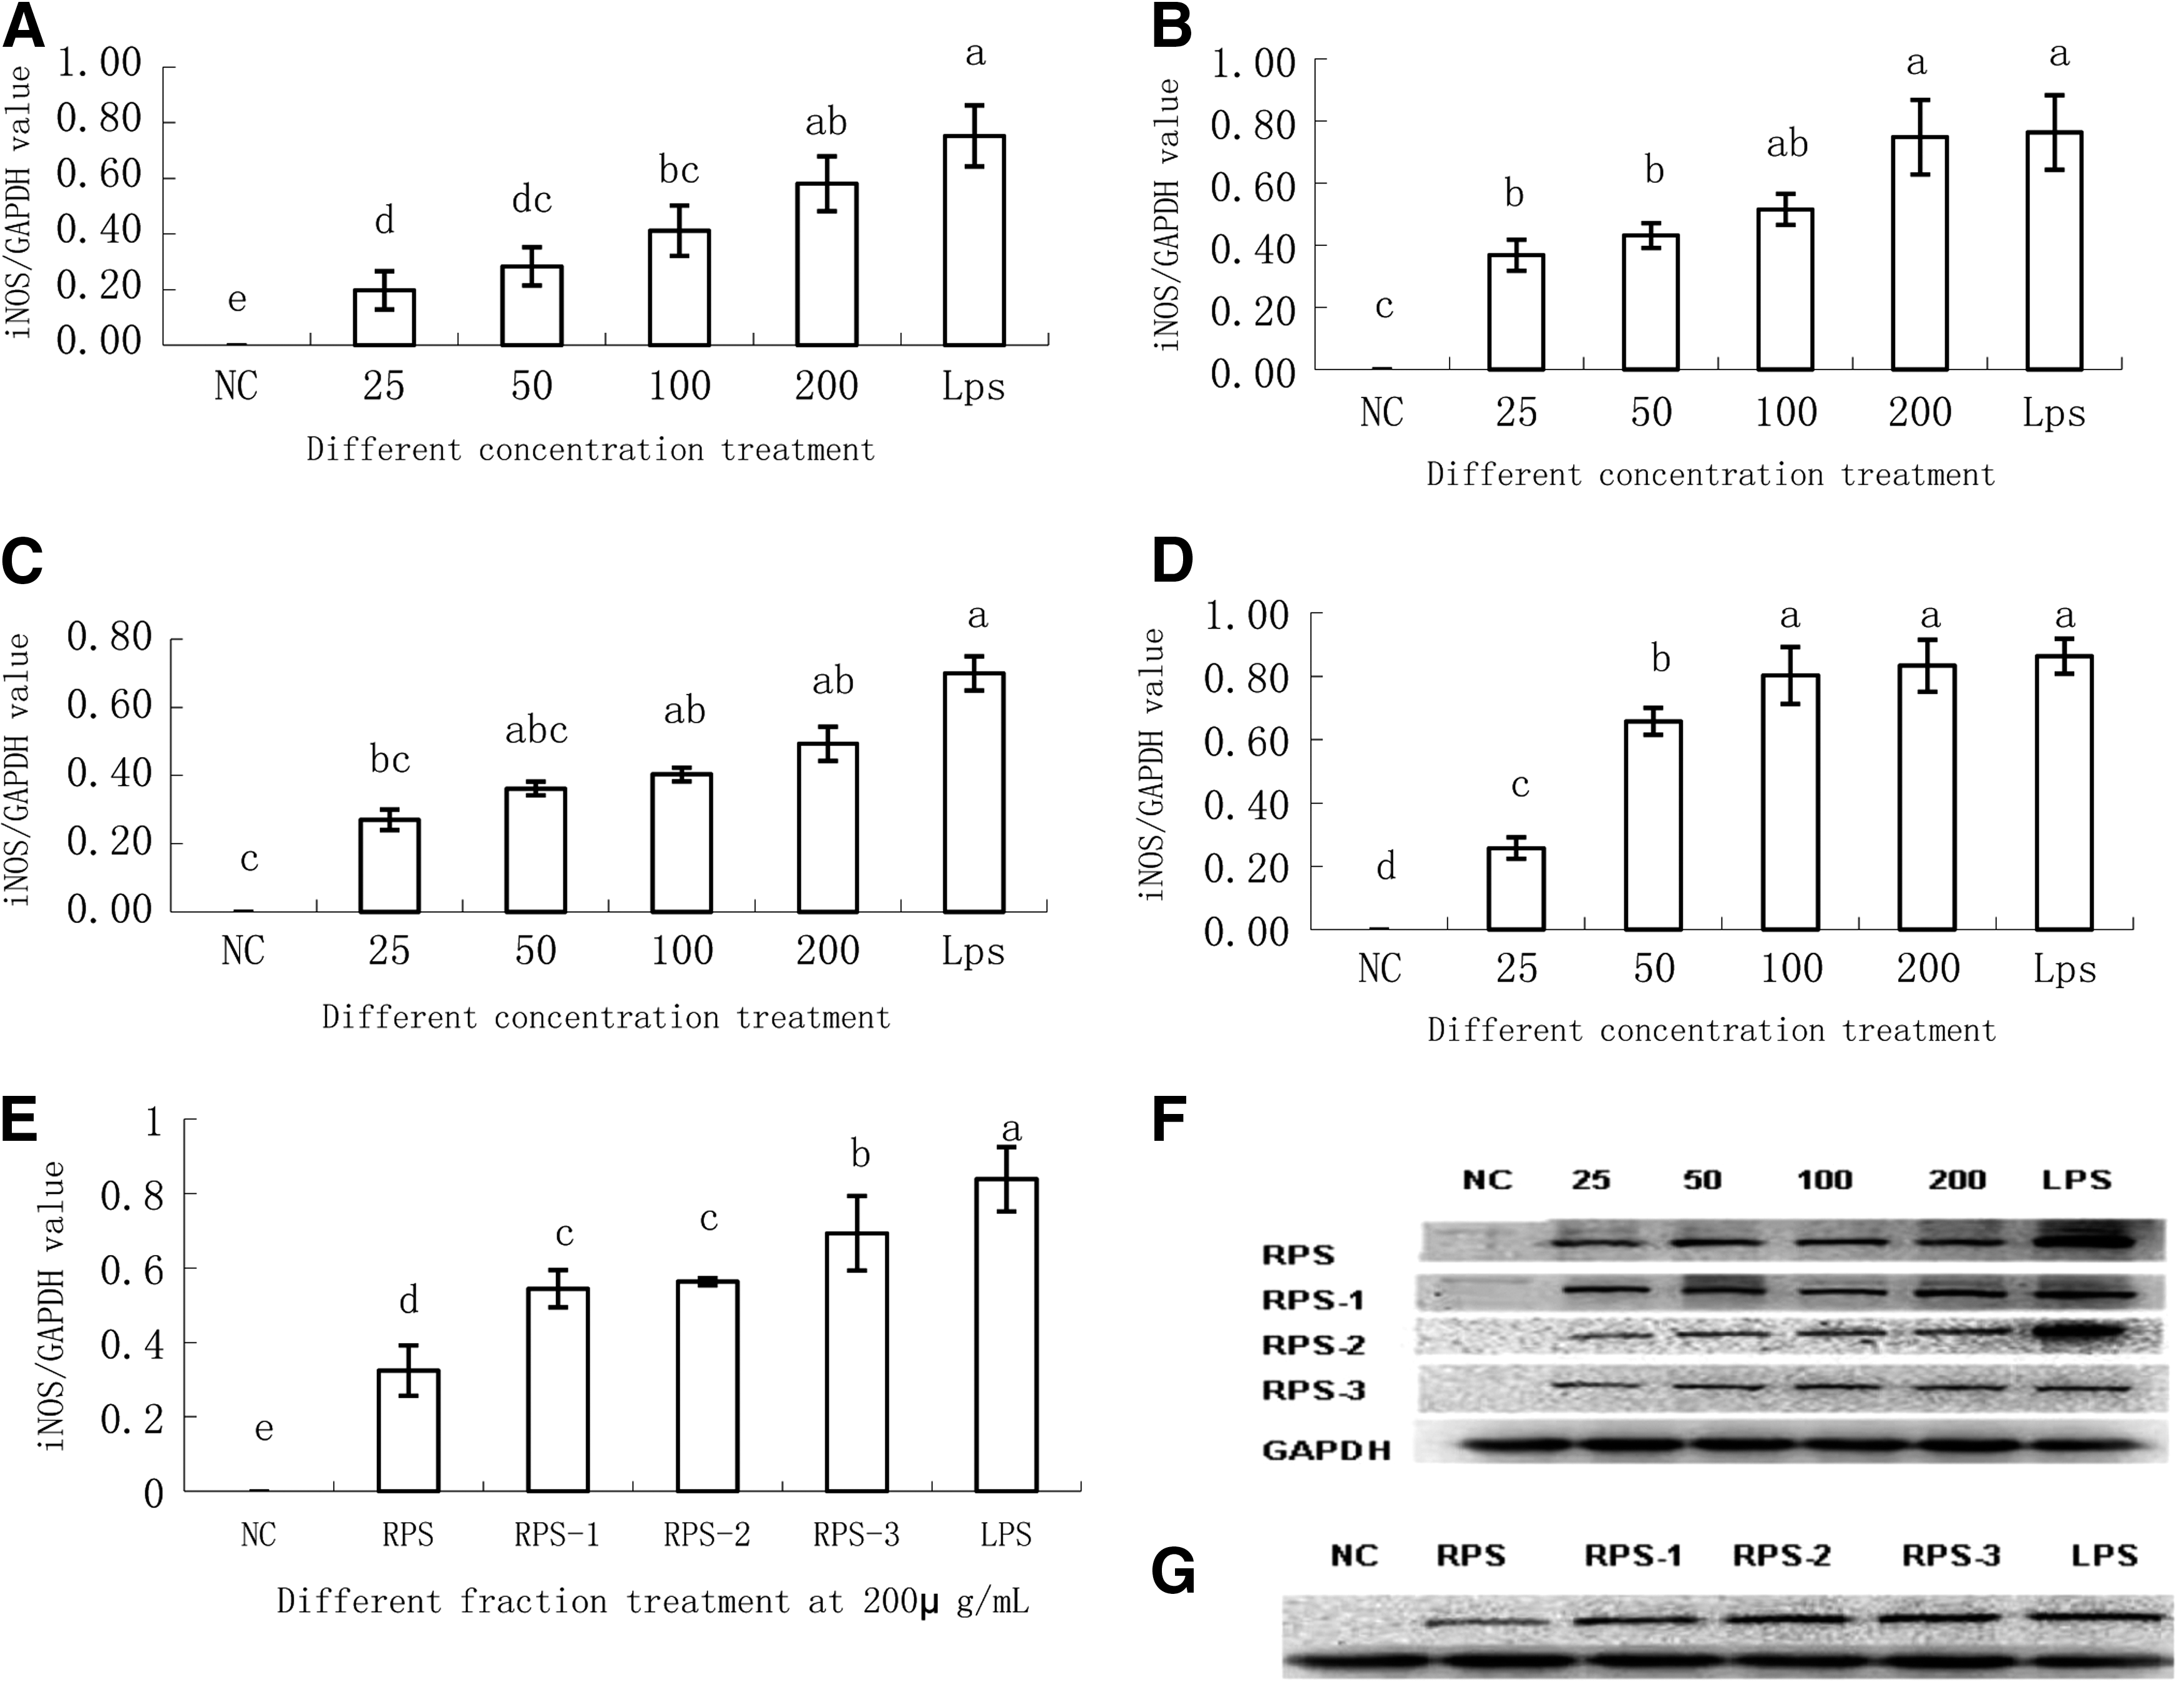
Quantification of iNOS protein expression in RAW264.7 cells stimulated with different polysaccharides RPS
To select the most effective fraction, 40 μg total protein from cells treated with RPS and the various fractions at 200 μg/mL were loaded on a 12% SDS-polyacrylamide gel and transferred to a nitrocellulose membrane. The results of quantification of iNOS protein expression with Bandscan showed that purified fractions are more effective than crude polysaccharide at a concentration of 200 μg/mL (Fig. 5).
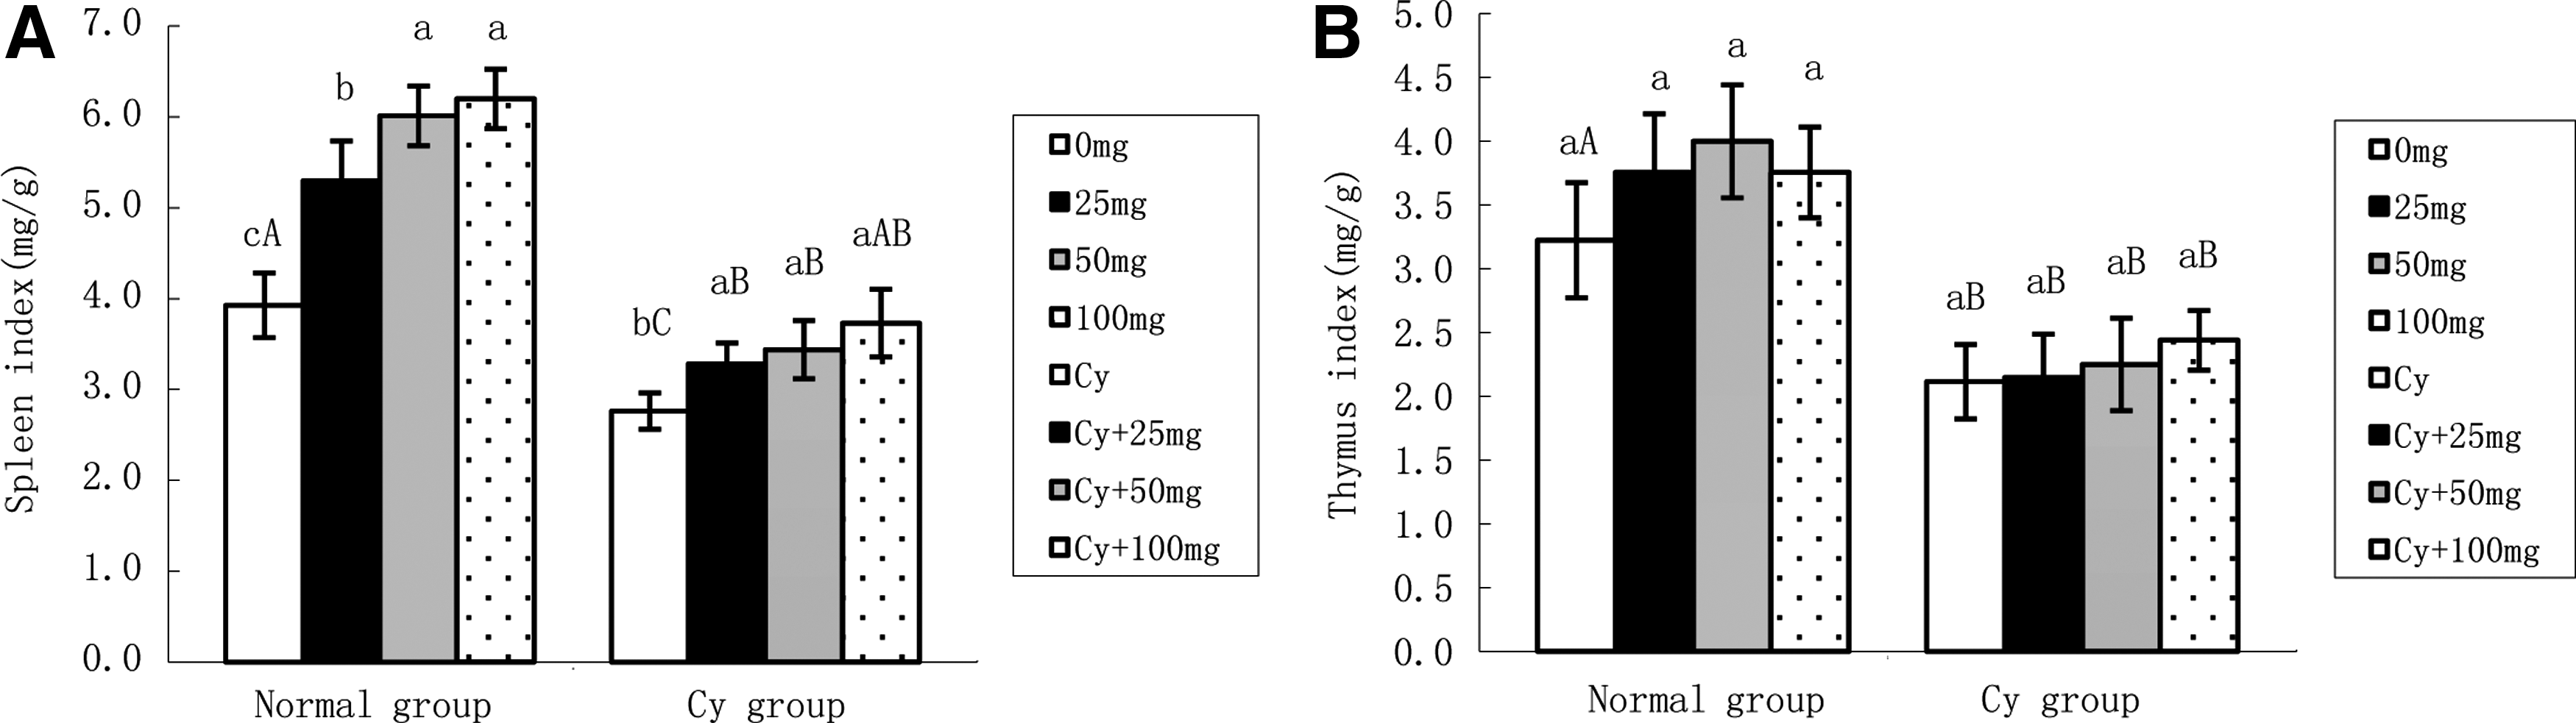
Effect of okra polysaccharide RPS-2 on thymus and spleen index in mice
Figure 6 shows that the spleen and thymus indices of the mice treated with Cy (at a dose of 100 mg/kg body weight) decreased significantly compared with the normal group, indicating that immunosuppression was successfully established. The spleen index of the mice treated with RPS-2 alone at a dose of 25, 50, or 100 mg/kg body weight was significantly increased in a dose-dependent manner compared with the normal control (P < .01). The spleen index of the mice treated with RPS-2 at 25, 50, and 100 mg/kg in combination with Cy at a dose of 100 mg/kg body weight also increased significantly compared with those mice treated with Cy alone (P < .01). The thymus index of the mice treated with RPS-2 alone at a dose of 25, 50, and 100 mg/kg body weight was also increased, but only the mice treated with 100 mg/kg showed significant differences compared with the normal control (data not shown). The thymus index of the mice treated with RPS-2 at a dose of 25, 50, and 100 mg/kg in combination with Cy at a dose of 100 mg/kg body weight did not show a significant difference compared with the group treated with Cy alone (100 mg/kg body weight).
Spleen
Effect of okra polysaccharide RPS-2 on splenocyte proliferation
Table 4 shows that splenocyte proliferation in the mice treated with RPS-2 alone at 25, 50, and 100 mg/kg body weight increased significantly in a dose-dependent manner compared with the normal control (P < .01). When combined with ConA (10 μg/mL), the splenocyte proliferation of the mice treated with 100 mg/kg body weight RPS-2 increased significantly compared with the group treated with ConA alone (P < .01). When combined with LPS (1 μg/mL), the splenocyte proliferation of the mice treated with RPS-2 at 25, 50, and 100 mg/kg increased significantly compared with the group treated with LPS alone (P < .01). In the immunosuppressed (Cy treated) group, the splenocyte proliferation was not significantly different when treated with RPS-2 at 25, 50, and 100 mg/kg body weight. When combined with ConA the splenocyte proliferation of the mice in the Cy group treated with RPS-2 at 50 and 100 mg/kg body weight increased significantly compared with the Cy group treated with ConA alone (P < .01). When combined with LPS (1 μg/mL), splenocyte proliferation in the mice in the Cy group treated with RPS-2 at 50 and 100 mg/kg body weight increased significantly compared with the Cy group treated with LPS alone (P < .01).
The splenocytes came from the normal and immunosuppressed groups (Cy treated) stimulated with different concentrations of RPS-2. Splenocytes were cultured in vitro with different concentrations of RPS-2, RPS-2 combined with ConA, and RPS-2 combined with LPS for 24 h, and then a CCK-8 assay performed as described in the text. Values are mean ± SD (n = 3). Different superscripts indicate a significant difference (P < .01). The original cell density was 5 × 10⁶ cells/mL medium.
Effect of okra polysaccharides on cytokine secretion
Effect of okra polysaccharides on cytokine secretion by RAW264.7 macrophages
Table 5 shows that TNF-α secretion by RAW264.7 macrophages was significantly increased by RPS-1 and RPS-3 treatment in a dose-dependent manner (P < .01). In the RPS-2 treatment groups, TNF-α secretion was significantly increased compared with the NC at concentrations greater than 25 μg/mL RPS-2. In contrast, only at a concentration of 200 μg/mL RPS did the TNF-α secretion levels in the RPS treatment groups significantly increase compared with the NC. IFN-γ secretion by RAW264.7 macrophages was significantly increased by RPS treatment at 100 and 200 μg/mL (P < .01) and by RPS-1 treatment at 50 and 200 μg/mL compared with the NC. There were no significant differences in other groups compared with the NC. IL-10 secretion by the RAW264.7 macrophages was significantly increased by RPS-1 treatment (P < .01), by RPS treatment at concentrations of 25, 100, and 200 μg/mL, by RPS-2 treatment at a concentration of 200 μg/mL, and by RPS-3 treatment at concentrations of 50, 100, and 200 μg/mL.
Values are mean ± SD (n = 3). Values within same row not sharing common capital letters are significantly different from one another as analyzed by one-way ANOVA, followed by Duncan's multiple comparisons test (P < .05). Values within the same column for each cytokine not sharing common lowercase letters are significantly different from one another (P < .01). The original cell density was 2 × 10⁵ cells/mL medium. The sensitivity of the ELISA kits used in this study was <7 pg/mL.
ANOVA, analysis of variance; IFN, interferon; IL, interleukin; LPS, lipopolysaccharide (positive control); TNF, tumor necrosis factor.
The ratio of TNF-α/IL-10 was significantly increased by RPS-2 treatment in a dose-dependent manner (P < .01), by RPS-1 at concentrations of 25, 50, and 200 μg/mL, and by RPS-3 at concentrations of 25 and 50 μg/mL. However, in contrast, the ratio of TNF-α/IL-10 was only increased significantly by 200 μg/mL RPS in the RPS treatment group compared with the NC (P < .01).
The ratio of IFN-γ/IL-10 was significantly decreased in the RPS-3 treatment group, by 25, 100, and 200 μg/mL RPS-1 in the RPS-1 treatment group and by 100 and 200 μg/mL RPS-2 in the RPS-2 treatment group compared with NC. The ratio of IFN-γ/IL-10 in the RPS treatment group was not significantly different compared with the NC.
Further comparisons between RPS, RPS-1, RPS-2, and RPS-3 showed that RPS-1 was more effective than the other polysaccharides in increasing TNF-α, IFN-γ, and IL-10 production, although the ratio of TNF-α/IL-10 in the RPS-2 treatment group was significantly increased compared with the other groups at concentrations of 100 and 200 μg/mL. The ratio of IFN-γ/IL-10 in the RPS-3 treatment group was significantly decreased compared with the other polysaccharide treatment groups at concentrations of 50, 100, and 200 μg/mL RPS-3. The IFN-γ/IL-10 ratio was also significantly decreased in the RPS-1 treatment group at a concentration of 100 μg/mL compared with the other polysaccharide treatment groups.
Effect of okra polysaccharide RPS-2 on cytokine concentration in murine serum
Table 6 shows that the TNF-α levels in the serum of the groups treated with 50 and 100 mg/kg body weight RPS-2 were significantly increased compared with the NC (P < .01). The serum IFN-γ levels in the group treated with 100 mg/kg body weight RPS-2 were significantly increased compared with the NC (P < .01). However, serum IL-10 levels in the groups treated with 50 mg/kg body weight RPS-2 were significantly decreased compared with the NC (P < .01). The ratio of IFN-γ/IL-10 was significantly increased at all concentrations of RPS-2 tested compared with the NC (P < .01). However, the ratio of TNF-α/IL-10 was only significantly increased by 50 mg/kg body weight RPS-2 compared with the NC (P < .01).
Values are mean ± SD (n = 3). Values within the same row not sharing common capital letters are significantly different (P < .01) from one another in normal groups or in immunosuppressed groups analyzed by one-way ANOVA, followed by Duncan's multiple range test.
BW, body weight.
Discussion
The immune system is a complex and important physiological system, which can cause various serious diseases when out of balance. Macrophages, together with other phagocytes, represent the first line of defense after the epithelial barrier. Macrophages are very important phagocytes in the host immune system and perform a variety of functions, including immune defense, immune surveillance, and immune regulation. 27 –29 Most plant-derived polysaccharides do not cause significant side effects and can be ideal candidates for therapeutics with immunomodulatory, antitumor, and wound-healing actions. 30 –32 Some studies have suggested that polysaccharides derived from higher plants activate macrophages, and the activated macrophages showed some valuable features: increased cytotoxic activity, phagocytic activity, NO production, and cytokine secretion. 33 The murine RAW264.7 cell line is a macrophage-like cell line that can participate in the host immune response, simulate antigen presenting dendritic cells (DCs) and express related antigen presenting molecules in vitro, 34 and are commonly used in the studies of immunomodulatory activity in vitro.
Okra pods have long been used both as a food source and as traditional medicine for many diseases. Particularly in Indian ethnomedicine, okra fruit mucilage could be used for treating dysentery and diarrhea in acute inflammation and irritation of the stomach, bowels, and kidneys catarrhal infections, ardor urinae, dysuria, and gonorrhea. The seeds are reported to be antispasmodic, cordial, and a stimulant. The immature fruit was considered to be a demulcent, diuretic, and an emollient. An infusion of the roots is used for the treatment of syphilis. Furthermore, in Nepal, the juice of the roots was used externally for treating cuts, wounds, and boils. 35 It was reported that okra pods contain many polysaccharides. 17,18 However, the study of their immunomodulatory activity has been limited. Our results indicated that in RAW264.7 cells, all the okra polysaccharides tested increased NO production, upregulated iNOS expression, and strongly increased the production of TNF-α and IL-10, however, have a weaker effect on IFN-γ.
NO is a secondary messenger molecule and can regulate cell functions, and is widely involved in various physiological and pathological processes in the body. 36 It was reported that antitumor, antiviral, anti-inflammatory, and immune responses are all associated with NO release. In our research, all the polysaccharides could increase NO production and upregulate iNOS expression in RAW264.7 cell. These results demonstrated that increased NO production was caused by the upregulation of iNOS expression. Also, these results were similar to that of many other botanical polysaccharides. 33,37,38 The RPS-1 and RPS-3 are especially effective, and the purified fractions were more effective than crude okra polysaccharides, which might be due to their different physicochemical properties, including homogeneity, molecular weight, and monosaccharide compositions. 39
Cytokines are small proteins produced by cells that regulate the immune response, inflammation, and hematopoiesis. Activated macrophages secrete multiple cytokines, including TNF-α, IFN-γ, IL-6, and IL-12, modulating the immune system. 40 Our result showed that all the okra polysaccharides strongly increased the production of both the Th1-related cytokine TNF-α and the Th2-related cytokine IL-10 compared with the NC in RAW264.7 cell, and they have a weaker effect on IFN-γ. The ratios of TNF-α/IL-10 were also increased compared with the NC, although RPS-2 was more effective than the other polysaccharides. The ratio of IFN-γ/IL-10 was not significantly different in the RPS treatment groups, but was decreased in the other three polysaccharide treatment groups compared with the NC, with RPS-3 being the most effective. Although notably, the decrease of IFN-γ/IL-10 ratio may be because the levels of IL-10 were increased, rather than IFN-γ levels decreased. The increased TNF-α/IL-10 ratios indicated that Th1 cells might be the main targets of Okra polysaccharides. Our results are similar to the results of the study by Sheu et al. on the immunomodulatory effect of okra polysaccharides on rat DCs in vitro. 16
Although these polysaccharides and LPS showed similar effects on RAW264.7 cells, some notable differences were also observed. First, the amount of okra polysaccharides (50–200 μg/mL) needed for macrophage activation was much higher compared with LPS (1 μg/mL); second, the in vivo studies with intraperitoneal injection of RPS-2 did not show any deleterious effects in mice. Besides, a study on the immunomodulating activity of okra flower polysaccharides (OFPS11) showed that RAW264.7 cells pretreated with OFPS11 significantly inhibited the proliferation of HepG-2 cells; OFPS11 enhanced the phagocytic ability and induced the elevation of NO production, TNF-α, and IL-1β secretion of RAW264.7 cells. OFPS11 also upregulated the protein expression of iNOS and the mRNA accumulation of iNOS and TNF-α. OFPS11 can strongly increase NF-kB levels in the nucleus. These data suggested that OFPS11 exerts its antitumor activity by probably stimulating macrophage activities through the nuclear NF-kB pathway. 41 Another study showed that a polysaccharide from Astragalus radix (APS) stimulates the secretion of TNF-α, granulocyte-macrophage colony-stimulating factor, the production of NO, and the protein expression level of NF-kB in RAW264.7. 42
Based on the results of the in vitro study, we investigated the in vivo immunomodulatory effects of RPS-2 in mice. The results showed that RPS-2 increased spleen index, stimulated splenocyte proliferation in both normal and immunosuppressed mice, and also induced the serum cytokine secretion in normal mice. Lymphocyte proliferation plays a crucial role in the cellular immune responses. Furthermore, the splenocyte proliferation response is related to improved T- or B-lymphocyte immunity, 43 which could be an indicator of immune activation. 44 Lymphocyte proliferation induced by ConA or LPS may be used as a method to evaluate the T- or B-lymphocyte activity. 45 T and B lymphocytes are two important classes of immunologically active cells. T lymphocytes are mainly responsible for cellular immunity, and B lymphocyte is the only cell capable of producing antibodies. 46 For normal mice, RPS-2 treatment significantly increased splenocyte proliferation. RPS-2 combined with ConA significantly increased T-lymphocyte proliferation, and RPS-2 combined with LPS significantly increased B-lymphocyte proliferation. These data indicate that RPS-2 treatment alone or combined with ConA or LPS could enhance cellular and humoral immunity in normal mice. However, in immunosuppressed mice, RPS-2 could only enhance the immunity by promoting the ConA- and LPS-stimulated splenocyte proliferation. Our results were similar to those reported for many plant pectic polysaccharides. 33,47,48
The analysis results of cytokine concentration in serum of normal mice treated with RPS-2 polysaccharide showed that TNF-α and IFN-γ production were significantly increased when treated with 50–100 and 50 mg/kg body weight of RPS-2, the IL-10 level was significantly decreased. The ratio of IFN-γ/IL-10 and TNF-α/IL-10 was also significantly increased. These results were basically consistent with the results of the in vitro study in RAW264.7 macrophages and indicated that Th1 cells might be the main target cells of the okra polysaccharide RPS-2. The differences (induced in vitro and suppressed in vivo) of IL-10 might be due to other molecular mechanisms, which effect the IL-10 secretion in vivo.
Conclusion
Based on the results presented above, we could conclude that all the okra polysaccharides tested have a significant macrophage stimulatory activity in vitro. The polysaccharide RPS-2 showed a significant immunomodulatory activity, including increasing spleen and thymus index and promoting splenocyte proliferation and cytokine production in vivo. RPS-1, RPS-2, and RPS-3 may potentially serve as novel immunomodulators. The study of their applications remains to be carried out in future studies.
Footnotes
Acknowledgments
This study was financially supported by the National High Technology Research and Development Program of China (No. 2011AA100302) and the National Natural Science Foundation of China (No.31460670). Authors are grateful to Dr. Zhang Yingxia for laboratory technical support and Associate Professor Bai Dianqing for helping with animal experiments.
Author Disclosure Statement
No competing financial interests exist.