
Abstract
We investigated the effect of a canola oil-supplemented diet on the metabolic state and diabetic renal function of a type I diabetes experimental model. Male Sprague-Dawley rats were randomly divided into four groups: (1) normoglycemic+chow diet, (2) normoglycemic+a canola oil-supplemented chow diet, (3) diabetic+chow diet, and (4) diabetic+a canola oil-supplemented chow diet. For 15 weeks, animals were fed a diet of Purina rat chow alone or supplemented with 30% canola oil. Energetic intake, water intake, body weight, and adipose tissue fat pad were measured; renal function, electrolyte balance, glomerular filtration rate, and the plasmatic concentration of free fatty acids, cholesterol, triglycerides, and glucose were evaluated. The mesenteric, retroperitoneal, and epididymal fat pads were dissected and weighed. The kidneys were used for lipid peroxidation (LP) and reactive oxygen species (ROS) quantifications. Diabetic rats fed with a canola oil-supplemented diet had higher body weights, were less hyperphagic, and their mesenteric, retroperitoneal, and epididymal fat pads weighed more than diabetic rats on an unsupplemented diet. The canola oil-supplemented diet decreased plasmatic concentrations of free fatty acids, triglycerides, and cholesterol; showed improved osmolarity, water clearances, and creatinine depuration; and had decreased LP and ROS. A canola oil-supplemented diet decreases hyperphagia and prevents lipotoxicity and renal dysfunction in a type I diabetes mellitus model.
Introduction
T
Materials and Methods
Animals and housing
Twenty-male Sprague-Dawley rats from our animal care facilities were singly housed (in 20 × 30 × 18 cm metallic cages with food and water ad libitum) in cages arranged in racks (to maintain auditory and olfactory contact) in a room with controlled lighting (8:00–20:00 lights on), temperature (21°C ± 1°C), and relative humidity (40–60%). Rats were allowed to acclimatize to the colony room conditions for at least 1 week before the experimental period. All experimental procedures described in this study are in accordance with the guidelines of the laws and codes approved in the Seventh Title of the General Law of Health regarding Health Research of the Mexican government (NOM-062-ZOO-1999), which details the technical specifications for production, care, and use of laboratory animals. The internal Bioethics Committee approved this protocol.
Experimental design
The rats were randomly divided into two groups: control (n = 10) and diabetic (n = 10). Diabetes was induced by streptozotocin (STZ) administration (one dose of 50 mg/kg in a citrate buffer of pH 4.6). To confirm diabetes, glucose concentrations were measured 3 days after STZ administration, and fasting values >300 mg/dL were considered as diabetic. One week later, each group was subdivided into two subgroups (n = 5): (1) control fed a Purina rat chow diet and (2) fed a canola oil-supplemented chow diet (diet composition is shown in Table 1). Diets were administered for 15 weeks, during which time, energy intake, body weight, and water intake were measured. At the end of the experiment, the renal function was evaluated and the animals were decapitated to obtain serum, adipose tissue, and kidney samples. In serum, levels of glucose, free fatty acids, cholesterol, and triglycerides were measured using RANDOX kits. The mesenteric, epididymal, and retroperitoneal adipose tissue were weighed to obtain a relative weight. One kidney was kept at −70°C until lipid peroxidation (LP) and reactive oxygen species (ROS) was quantified as oxidative stress markers, and the other kidney was kept in 10% buffered formalin until histological analysis.
The energy of the diet Purina chow was 4 kcal/g and supplemented canola oil diet was 5.5 kcal/g.
Canola oil fatty acid composition
Fatty acids were converted to methyl esters by H2S-catalyzed transmethylation and analyzed by gas chromatography as previously described. 11 The gas chromatograph (HP model 6890) was equipped with a carbowax capillary column and a flame ionization detector. Injection and detector temperatures were maintained at 250°C. Nitrogen was used as the carrier gas, and the column temperature was programmed to rise from 100°C to 210°C at a rate of 2°C/min. Fatty acid methyl esters were identified by comparison with fatty acid standards (Sigma).
Functional renal test
A test of renal function was performed as previously described. 12 Briefly, after 15 weeks of diet treatment, the animals were placed in metabolic cages. Animal bladders were emptied by gentle compression of the abdomen, and the animals were kept in metabolic cages for 6 h without food or fluids. Urine samples were then collected by abdominal compression until the animal's bladder was completely empty.
Osmolality of serum and urine was measured in a vapor pressure osmometer (Wescor, Logan, UT, USA) in triplicate. Urine volume was measured, and the osmolality and free water clearances were calculated. The equations to obtain osmolal and water clearance are:
Electrolyte balance was obtained by measuring the concentrations of sodium and potassium in urine and serum samples (Flame Photometer Coleman 51; Perkin-Elmer, Norwalk, CT, USA); sodium and potassium clearances were calculated.
Glomerular filtration rate was calculated from the clearance of endogenous creatinine. Serum and urinary creatinine were determined using the Jaffe alkaline picrate method; the creatinine clearance was calculated.
Oxidative stress markers
LP and ROS quantification were used as oxidative stress markers; they were determined as previously described. 12 Each kidney was homogenized in 5 mL of 10-mM phosphate buffer at pH 7.4. LP was evaluated by the formation of lipid-soluble fluorescence. A 1000 μL aliquot was added to 5 mL of chloroform–methanol solution (2:1, v/v). After stirring for 15 sec, the mixture was cooled on ice for 30 min to allow for phase separation. The chloroform phase was measured in a RF5000U Shimadzu Spectrophotometer at wavelengths of 370 nm (excitation) and 430 nm (emission). The sensitivity of the spectrophotometer was adjusted to 140 fluorescence units with 1 μg/mL quinine sulfate in 0.05-M H2SO4. The results are expressed as relative fluorescence units per milligram of protein. Meanwhile, ROS was measured by the formation of 2′,7′-dichlorofluorescein (DCF). A volume of 10 μL of the homogenates was added to 1940 μL of Tris:HEPES (18:1) and incubated in the presence of 50 μL of 2′,7′-dichlorofluorescein diacetate (DCFH-DA) for 1 h at 37°C. Freezing stopped the reaction. Fluorescence was measured in an RF5000U Shimadzu spectrophotometer at wavelengths of 488 nm (excitation) and 525 nm (emission). The results are expressed as 2′,7′-DCF (ng) formed per milligram of protein per hour.
Histological analysis
The kidneys were excised and fixed in 10% buffered formalin. Fixed tissues were embedded in paraffin and then sectioned. The sections were stained with hematoxylin–eosin and examined using an optical microscope by an expert pathologist blinded to the group and treatment.
Statistical analysis
All results are presented as mean ± standard error. Body weight, energy intake, and water intake were statistically analyzed by a three-way analysis of variance (ANOVA) and the Student-Newman-Keuls post hoc test. The three-way ANOVA considered time, diet, and diabetic state. Urinary flow and osmolality, water, K+, Na+, and creatinine clearances, as well as free fatty acids, cholesterol, triglycerides, glucose, LP, ROS quantification, and adipose tissue were statistically analyzed by a two-way ANOVA. The Student-Newman-Keuls post hoc test was applied. The two-way ANOVA considered diet and endocrine state. The area under curve of body weight, energy intake, and water intake was analyzed with a nonparametric one-way ANOVA. A value of P < .05 was considered statistically significant.
Results
Table 2 shows that MUFAs (62.6%) are more abundant than PUFAs (mainly oleic acid [18:1 n-9]) in the canola oil used in this study. Also, the n-6/n-3 ratio is 2:2, and the unsaturated/saturated fatty acid ratio is 13:4.
FA, fatty acid.
Body weight, energy intake, and water intake were measured during the treatment period. Diabetic rats fed a canola oil-supplemented diet had a higher body weight gain compared to rats fed a diabetic chow diet that lose weight (Fig. 1A, B), but a lower energy intake (Fig. 1C, D) than those fed chow alone. Water intake did not differ significantly between diabetic groups (Fig. 1E, F). To investigate the role of lipotoxicity, adipose tissue pads and lipid metabolism markers were evaluated. The effect of diet on mesenteric, retroperitoneal, and epididymal fat pad weight was evaluated (Fig. 2A–C, respectively). The diabetic group with a canola oil-supplemented diet had higher fat pad weights than those on an unsupplemented diet; these results are in concordance with body weight gain. Investigation into the energetic metabolism markers found that diabetic rats fed with the canola oil-supplemented diet had lower levels of free fatty acids, cholesterol, triglycerides, and glucose (Table 3) than diabetic rats fed chow alone, thus suggesting improvement in the metabolic state. Evaluation of the effects of canola oil on renal function and kidney damage revealed that supplemented diabetic rats had better urinary flow, osmolality, and creatinine clearances than the unsupplemented diabetic group. No differences in water, Na+, or K+ clearances were evident between groups (Table 4). And finally, ROS and LP levels were significantly lower in diabetic rats fed a canola oil-supplemented diet, indicating that this diet prevents diabetes-caused renal oxidative stress (Fig. 3). Histological analysis showed no change in kidney cytoarchitectures of rats fed a diabetic canola oil-supplemented diet (Fig. 4).

Canola oil-supplemented diet effects on body weight
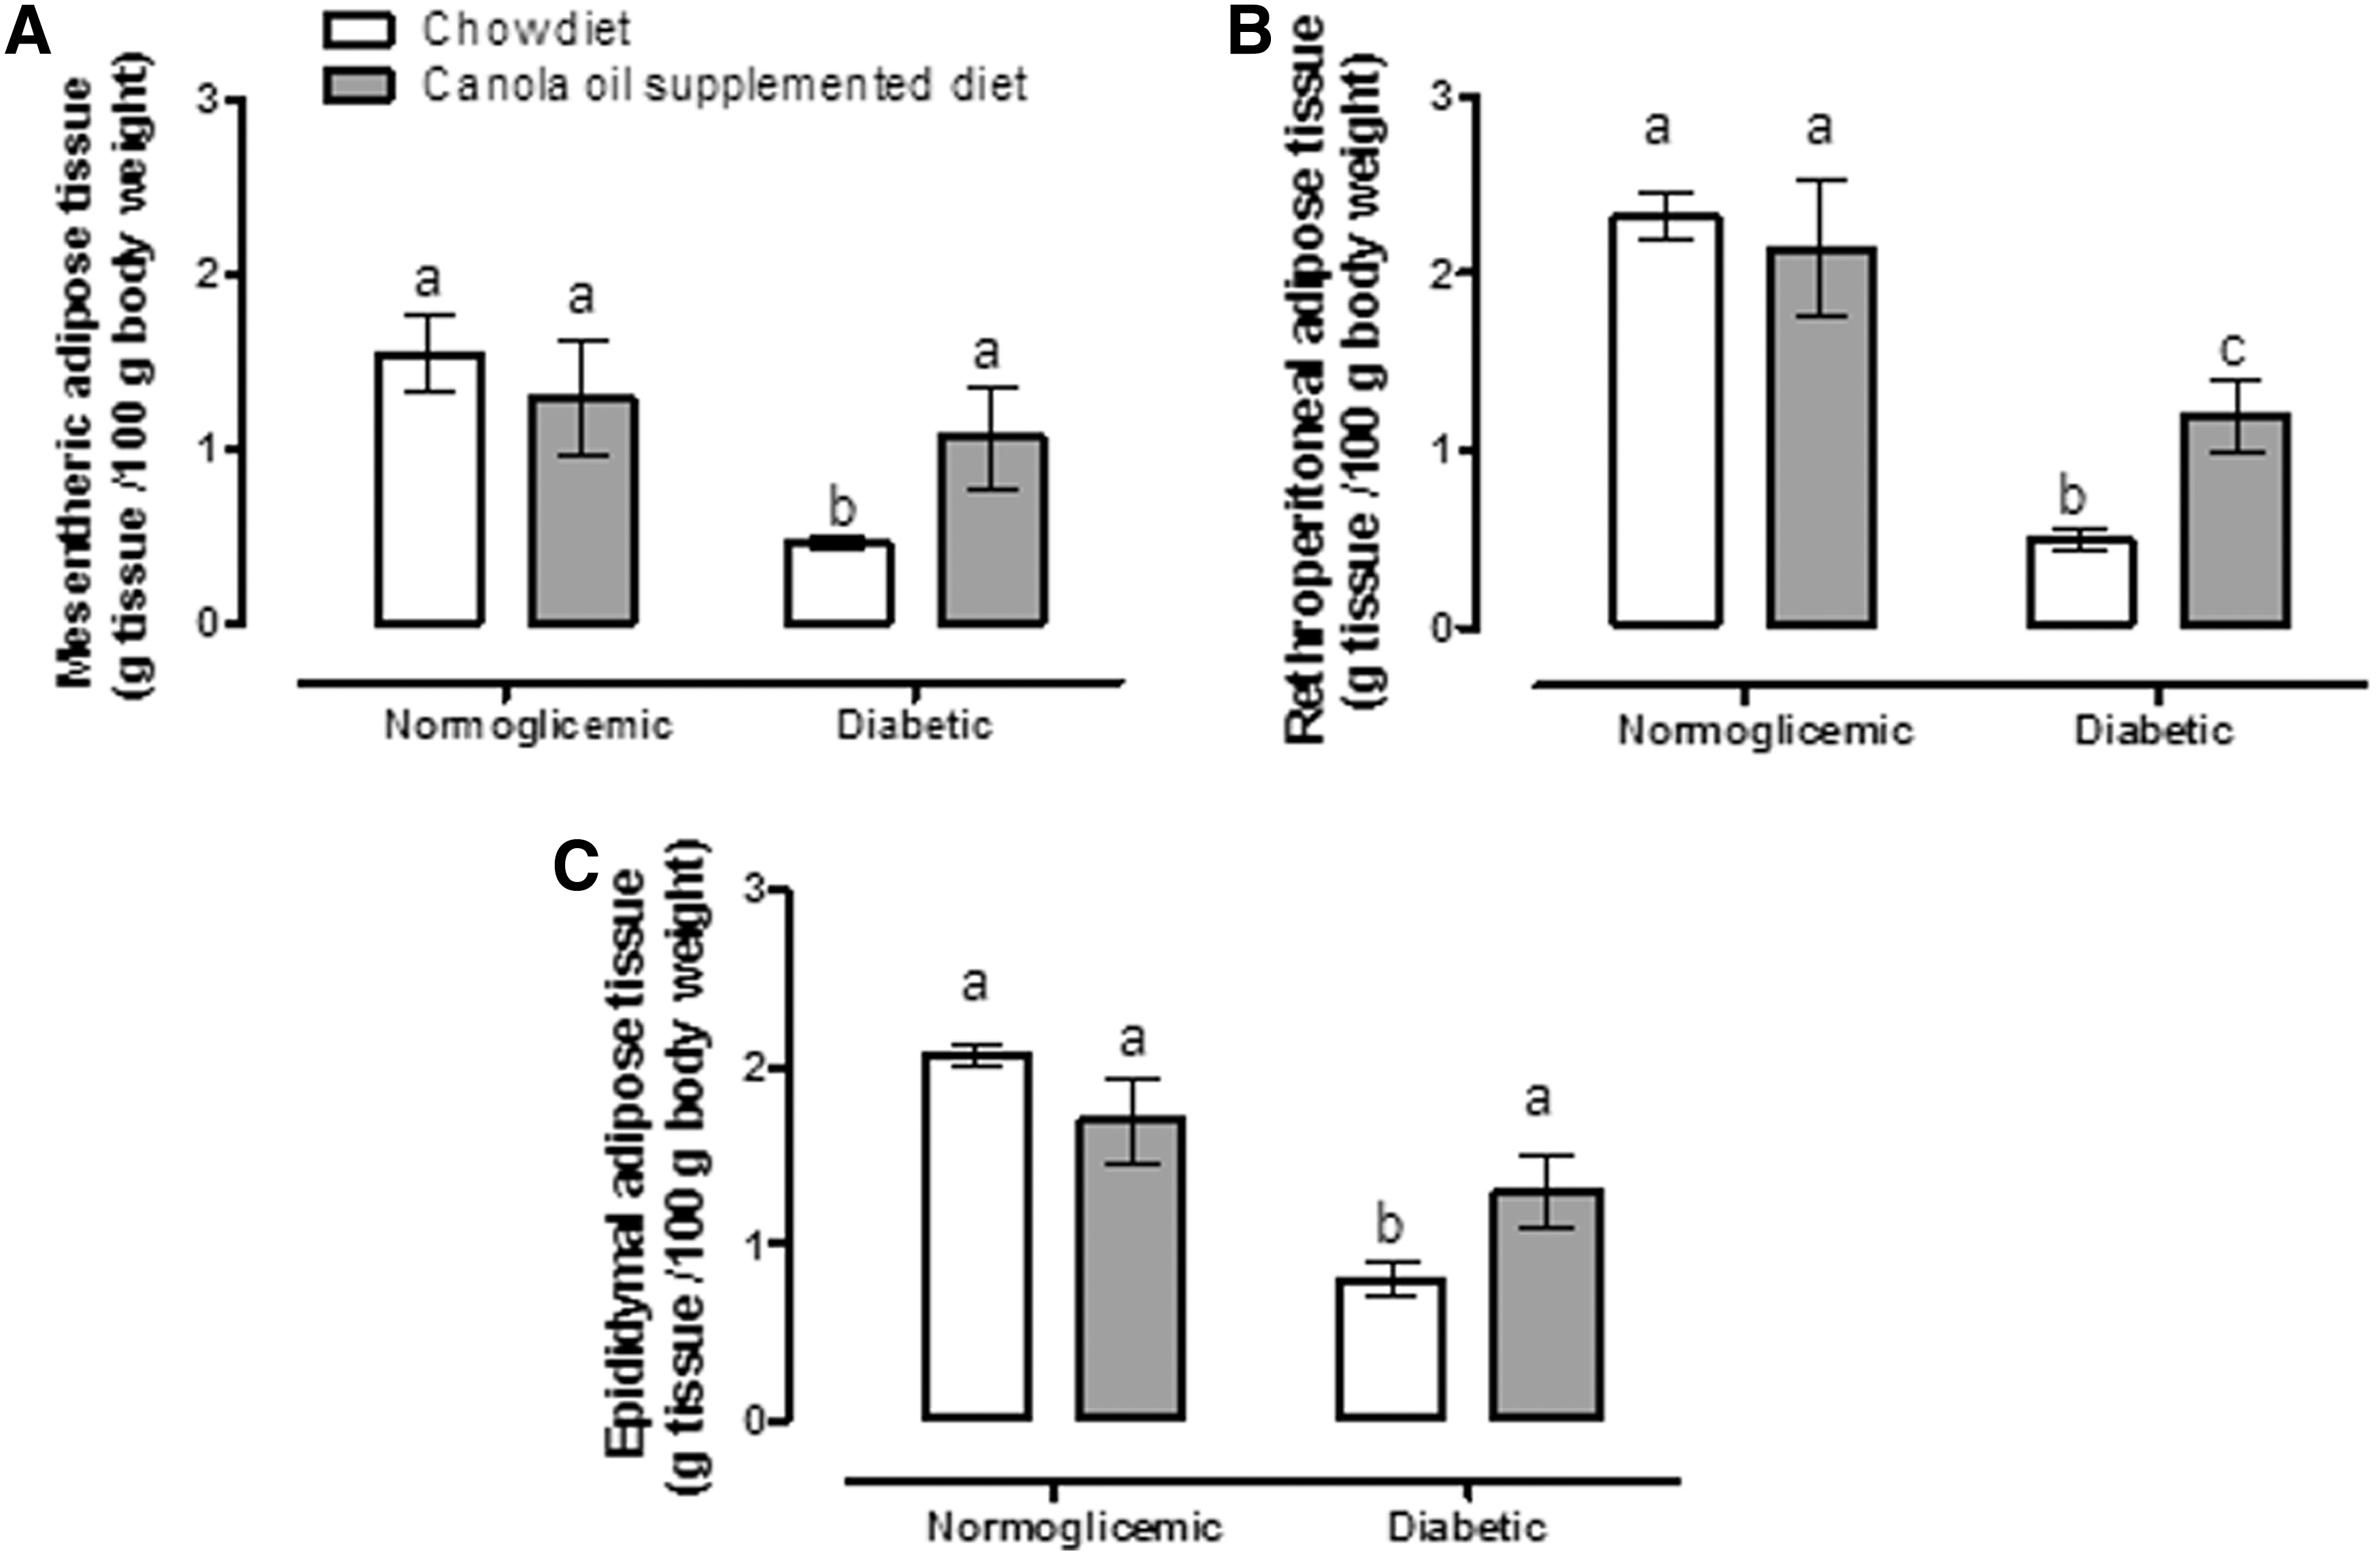
Canola oil-supplemented diet effects on mesenteric

Canola oil-supplemented diet effects on lipid peroxidation
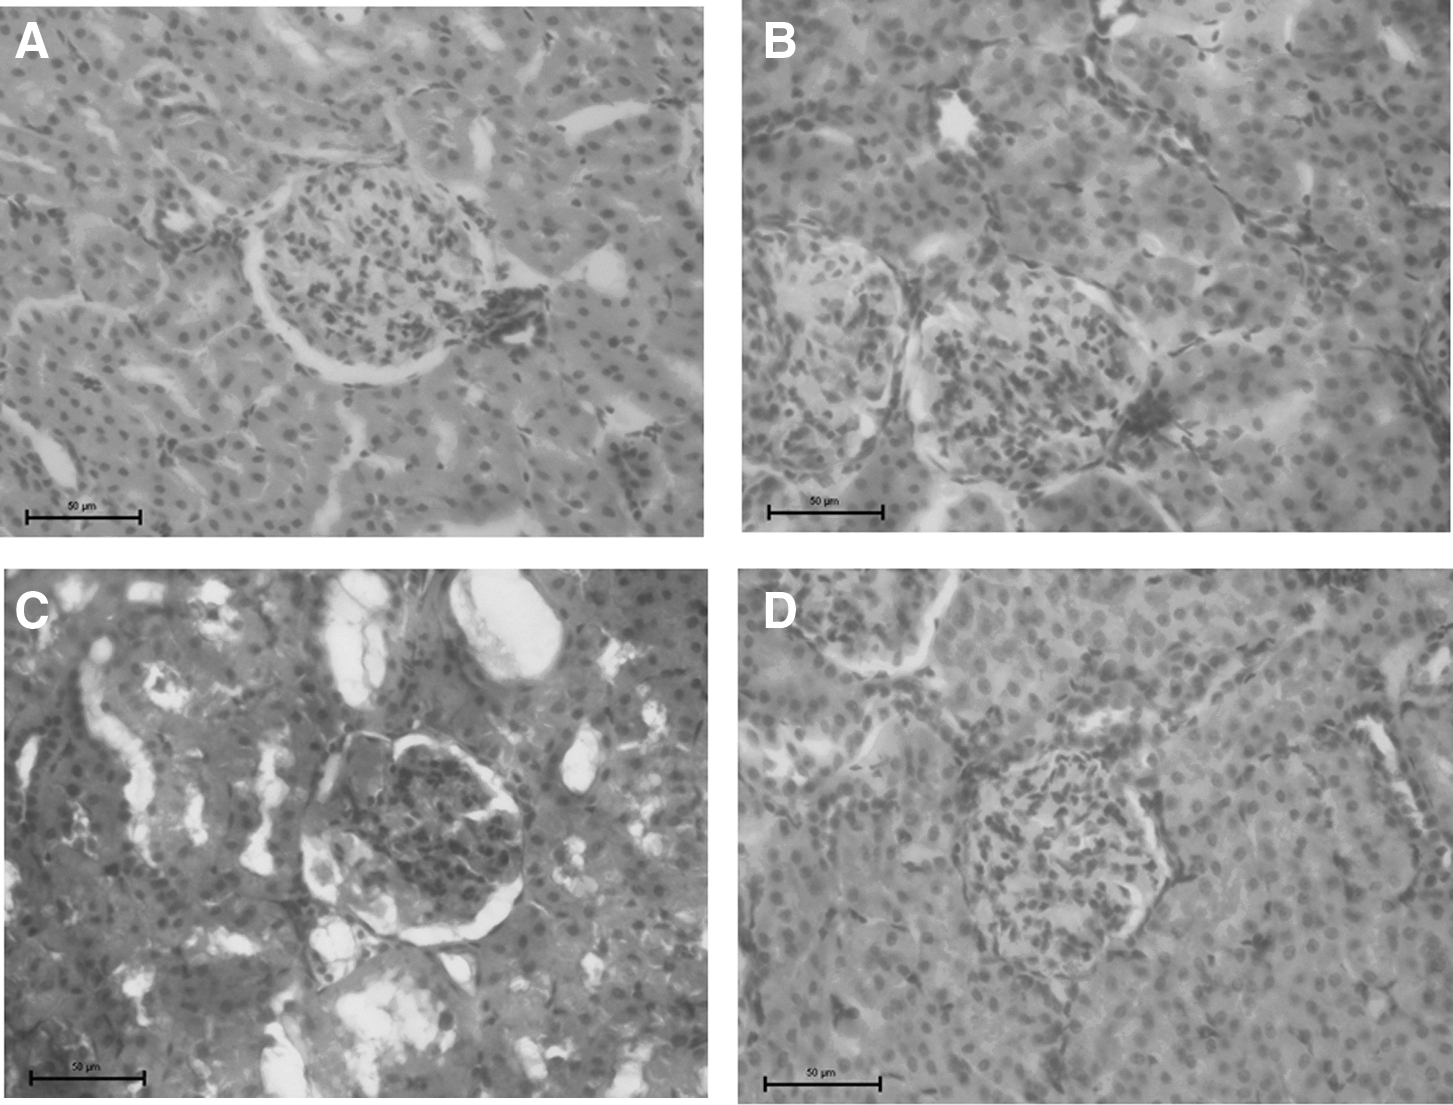
Canola oil-supplemented diet effects on histological analysis of the kidney normoglycemic groups: chow diet
Data are mean ± SE. Different letters mean significant difference, a ≠ b ≠ c, P < .05. Two-way ANOVA and Student-Newman-Keuls post hoc test.
ANOVA, analysis of variance; SE, standard error.
The values are expressed as mean ± SE. Different letters mean significant difference, a ≠ b ≠ c, P < .05. One-way ANOVA and Student-Newmann-Keuls post hoc test.
Discussion
Because diabetes mellitus is an endocrine disease and some lipids, such as α-linoleic acid, have been shown to offer beneficial effects to nephropathic conditions, 13 we investigated if dietary lipids covey a similar affect in type I diabetic rats. Results showed that type I diabetic rats fed a canola oil-supplemented diet lost less body weight and were less hyperphagic than diabetic rats fed an unsupplemented diet. This metabolic event may be a result of a change in the metabolism of insulin-dependent cells and neuroimmune-endocrinological processes in response to a canola oil-supplemented diet.
It appears that the fatty acids in canola oil could serve as energetic fuel to skeletal muscle and adipocytes. It has been demonstrated that a high-fat diet increases fat oxidation because it enhances the expression of genes involved in the transport of fatty acids into the cell. Fatty acids translocate protein (FAT/CD36) and the fatty acid binding protein (FABPpm), and they transport intramitochondrially due to carnitine palmitoyltransferase (CPT1; EC 2.3.1.21) and the β-oxidation enzyme β-hydroxyacyl-CoA dehydrogenase (β-HAD; EC 1.1.1.211). 14,15 These processes reduce proteolysis in the muscle, contributing to reduced sarcopenia and consequently maintained body weight. Simultaneously, lipolysis was reduced in adipocytes of diabetic rats fed with the canola oil-supplemented diet, which maintained tissue pad weight and reduced free fatty acid release and triglycerides in the plasma. This hypoglycemic and hypolypemic effect of canola oil have been demonstrated previously in type I diabetic rats 16 and type II diabetic humans. 17 It has been shown that the high-polyunsaturated/saturated index offered by canola oil prevents increased adiposity in obese mice because the diet causes a reduction in lipoprotein lipase (LPL; EC 3.1.1.34) and an increase in hormone-sensible lipase (HSL; EC 3.1.1.79) activities. 18 –20 In this study, we show that a canola oil-supplemented diet improved the metabolic state of diabetic rats, however, decreased plasmatic concentration of free fatty acids, triacilglycerides, and cholesterol. Other researchers have found similar results using other fats, for example, oleic acid is effective in reversing the inhibitory effect that inflammatory cytokine TNF-α 21 has on insulin production.
The neuroimmuno-endocrinological mechanism is based on the role of adipocytes because a MUFA-rich diet, such as one supplemented with canola oil, has an anti-inflammatory effect on adipocytes. 22 For example, a MUFA-rich diet caused a reduction in M1 macrophage and CD8+ lymphocyte infiltration into adipose tissue. 22 These events could be related to low levels of resistin 23 and IL-6. 24 Previous works report that a canola oil diet enhances the formation of hepatic eicosapentaenoic acid (20:5n-3) 25 and increases the hepatic levels of long-chain n-3 PUFA, which likely prevents diabetes-caused adipose tissue inflammation. 19 It has also been reported that energy intake increases in diabetic rats because satiety signals are depressed in the brain since insulin-dependent cells are in functional fasting. Thus, arcuate neurons reduce the expression of α-MSH, causing hyperphagia 26 ; however, this response can be counteracted by feeding rats a high-fat diet. 27 Thus, it is possible that a canola oil-supplemented diet promotes a reduction in energy intake in diabetic rats.
Evidence has been presented for an accumulation of lipids and lipotoxicity in human kidneys, 8 which appears to be correlated with deregulated lipid metabolism, inflammation, podocyte dysfunction, fibrosis, and glomerular filtration rate. 28 It should be noted that an accumulation of free fatty acids also promotes cell dysfunction and death when endoplasmic reticulum stress and excessive production of ROS 29 contribute to apoptosis. 13 Previous studies have also reported that α-linolenic acid protects renal cells against lipotoxicity by inhibition of endoplasmic reticulum-reduced phosphorylation of p-elF2α and levels of CHOP. 13 Our results suggest that a diet supplemented with canola oil reduced lipotoxicity in diabetic rats because of a reduction in free fatty acids, triglycerides, and kidney oxidative stress markers, which is associated with improved renal function. In addition, canola oil has been suggested to prevent proteinuria, glomeruloesclerosis, tubular fibrosis, inflammation, and renal dysfunction in type I diabetic rats. 16
In this study, we add to the abundance of evidence for MUFFAs and PUFFAs as beneficial for lipid metabolism by showing that they also have a positive effect on diabetic renal function: positive effects were observed for urinary flow, osmolality, water, K+, Na+, and creatinine clearance.
Histological analyses showed no change in kidney cytoarchitectures of diabetic rats fed canola oil = supplemented diet.
In conclusion, our results suggest that canola oil can improve energy metabolism and decrease renal damage in a type I diabetic model.
Footnotes
Acknowledgments
This study was partially supported by SIP 2015920, 20161103. E.C.-E., R.O.-B., M.F.-C., and E.M.C. are fellows of EDI, -COFAA, and SNI. We thank Carolyn Unck for making corrections to our English article.
Author Disclosure Statement
No competing financial interests exist.