




Abstract
The aim of this study was to analyze the effects on blood sugar concentrations through the calculation of the glycemic score (GS) of 10 different high-protein low-carbohydrates (CHOs) proprietary foods that are commonly used as meals during very low-CHO ketogenic diets or during low-CHO diets. Fourteen healthy females were tested for their glycemic response curve elicited by 1000 kJ of glucose three times within a 3-week period (one test each week) compared with one of 10 test foods once on separate days twice a week. After determining the GS of each food in each individual, the mean GS of each test food was calculated. All test foods, compared with glucose, produced a significantly lower glycemic response. The GS of all test food resulted in being lower than 25 and the difference between the mean glycemia after the intake of glucose (mean 122 ± 15 mg/dL) and after the intake of the sweet test foods (mean 89 ± 7 mg/dL) was 33 mg/dL (P < .001), whereas the difference between the mean glycemia after the intake of glucose and after the intake of savory test foods (mean 91 ± 8 mg/dL) was of 31 mg/dL (P < .001). Conclusions: The reformulation of ultraprocessed ready-to-consume foods in a low-CHO, high-protein version can produce a significantly lower glycemic response whilst maintaining the valued ready-to-use format and high palatability demanded by consumers. The low impact on postprandial glycemia and the nutritional characteristics of these proprietary foods makes them useful in both weight control management strategies and in the care management of diabetes.
Introduction
D
Among multiple reasons involved in the onset of overweight and obesity, nutrition appears to be the most important one. 3 However, research has yet to produce a generally accepted nutritional approach. 4 Populations experiencing an increase in obesity and CV diseases show common eating and drinking habits, notably a general decrease in intake of minimally processed foods and in an increase in the consumption of ultraprocessed ready-to-consume products. These foods, based on the accepted definition acknowledged by the Pan American Health Organization, 5 are “industrial formulations manufactured from substances derived from foods or synthesized from other organic sources. (…) Most of these products contain little or no whole food. They are ready-to-consume or ready-to heat, and thus require little or no culinary preparation.” Examples of ultraprocessed foods are savory and sweet snacks, ice cream, frozen and chilled ready meals, and soft drinks, 5 and they seem to be the cause of the extra daily diet calorie intake of both the young and the older populations. 6 Ultraprocessed ready-to-consume products present particular characteristics, which make them extremely profitable for producers and retailers and highly attractive for consumers. For example, consumers purchase them because they commonly require a minimal culinary action, they are flavorsome, and are relatively inexpensive. However, when analyzing ultraprocessed products, less protein, potassium, and dietary fiber and more free sugar, total saturated and transunsaturated fats, and sodium are generally evident when compared with traditional foods. 7,8
All these characteristics appear to be linked to the burden of obesity and metabolic syndrome (MetS). 6 A potential solution to this scenario could be to review ultraprocessed, ready-to-consume products by reduction of their sugar and fat contents. A particular kind of these new ultraprocessed ready-to-consume products are proprietary foods that are high in proteins and fibers and low in sugar and saturated fats. These are specifically designed for particular diets such as the ketogenic regimen, but are also successfully used in more easy low-carbohydrate (CHO) diets as snacks or meal replacements. 9 During ketosis, CHO intake must be under 30 g/day, 10,11 and in previous studies, 4,9 we demonstrated that these special foods, which mimic the taste and aspect of high-content CHO foods but are low in sugar and high in protein content, were able to increase the compliance of subjects to the ketogenic diet. Moreover, after the termination of a very low-CHO ketogenic diet (VLCKD) intervention, patients tended to maintain the consumption of those proprietary foods during the day (usually at breakfast or during breaks). This can be considered a positive change of behavior, because it is known that meal replacement during the maintenance phase is useful to prevent weight gain. 12 During consumption of a VLCKD, it is mandatory to maintain a low level of glycemia (about 80–90 mg/dL) to avoid insulin spikes. 13 This condition allows subjects to improve their fat oxidation as demonstrated by Paoli et al. 14 and by Tagliabue et al. 15
Another important aspect of a VLCKD is the influence of such dietary regimen on the perception of hunger. 16 It has been suggested that ketone bodies reduce hunger through different and complex mechanisms 17 ; in contrast it is known that postprandial glucose and insulin spikes, typically produced after the intake of traditional ultraprocessed products that usually show a high glycemic index (GI), 5 elicit food craving and overeating, with a preference for high-GI CHOs, 18 a phenomenon defined as the CHO-craving effect. 19 Conversely, the consumption of nonprocessed foods low in simple sugars may ameliorate overeating and facilitate the maintenance of a healthy weight. 18
The mentioned positive changes necessitate the need to analyze the effect of different high-protein low-CHO proprietary foods that are commonly used in diets, i.e. during VLCKD and low-CHO diets (LCD), on glycemia compared with glucose.
Materials and Methods
Subjects were recruited through advertisement placed in two pharmacies located in the province of Vicenza (Veneto, Italy). Exclusion criteria for this study were the presence of diabetes or prediabetes, being on a food diet, and females who were either pregnant or breast feeding. After a preselection process of 32 participants, 14 females were eligible to participate in this study (mean age: 42 ± 13, mean weight: 72 ± 21 kg, mean BMI: 26 ± 7). Participants were required to report any change of daily habits, such as engaging in a new exercise program, new pharmaceutical interventions, or engaging in other than the present diets during the experimental phase, which would have resulted in the exclusion from the study. The study was approved by the Ethical Board of the University of Padova, Department of Biomedical Sciences, and conformed to standards for the use of human subjects in research as outlined in the Declaration of Helsinki. Investigators explained the purpose of the study, the protocol to be followed, and the experimental procedures to be used before the start of the study. Subjects were required to sign a participation consent form and they did not receive any monetary compensation.
Subjects were tested for individual glycemic response curves elicited by the ingestion of 1000 kJ of glucose three times within a 3-week period (one test per week) and that of each of 10 high-protein low-CHO proprietary test foods once on separate days twice a week (Fig. 1). Tests were performed in the morning after 10–12 h overnight fast. Subjects were asked to have a regular meal, not to consume any alcohol, and to avoid any unaccustomed exercise the night before tests. During the study period, participants maintained a constant foods supply, without changing their usual eating habits.
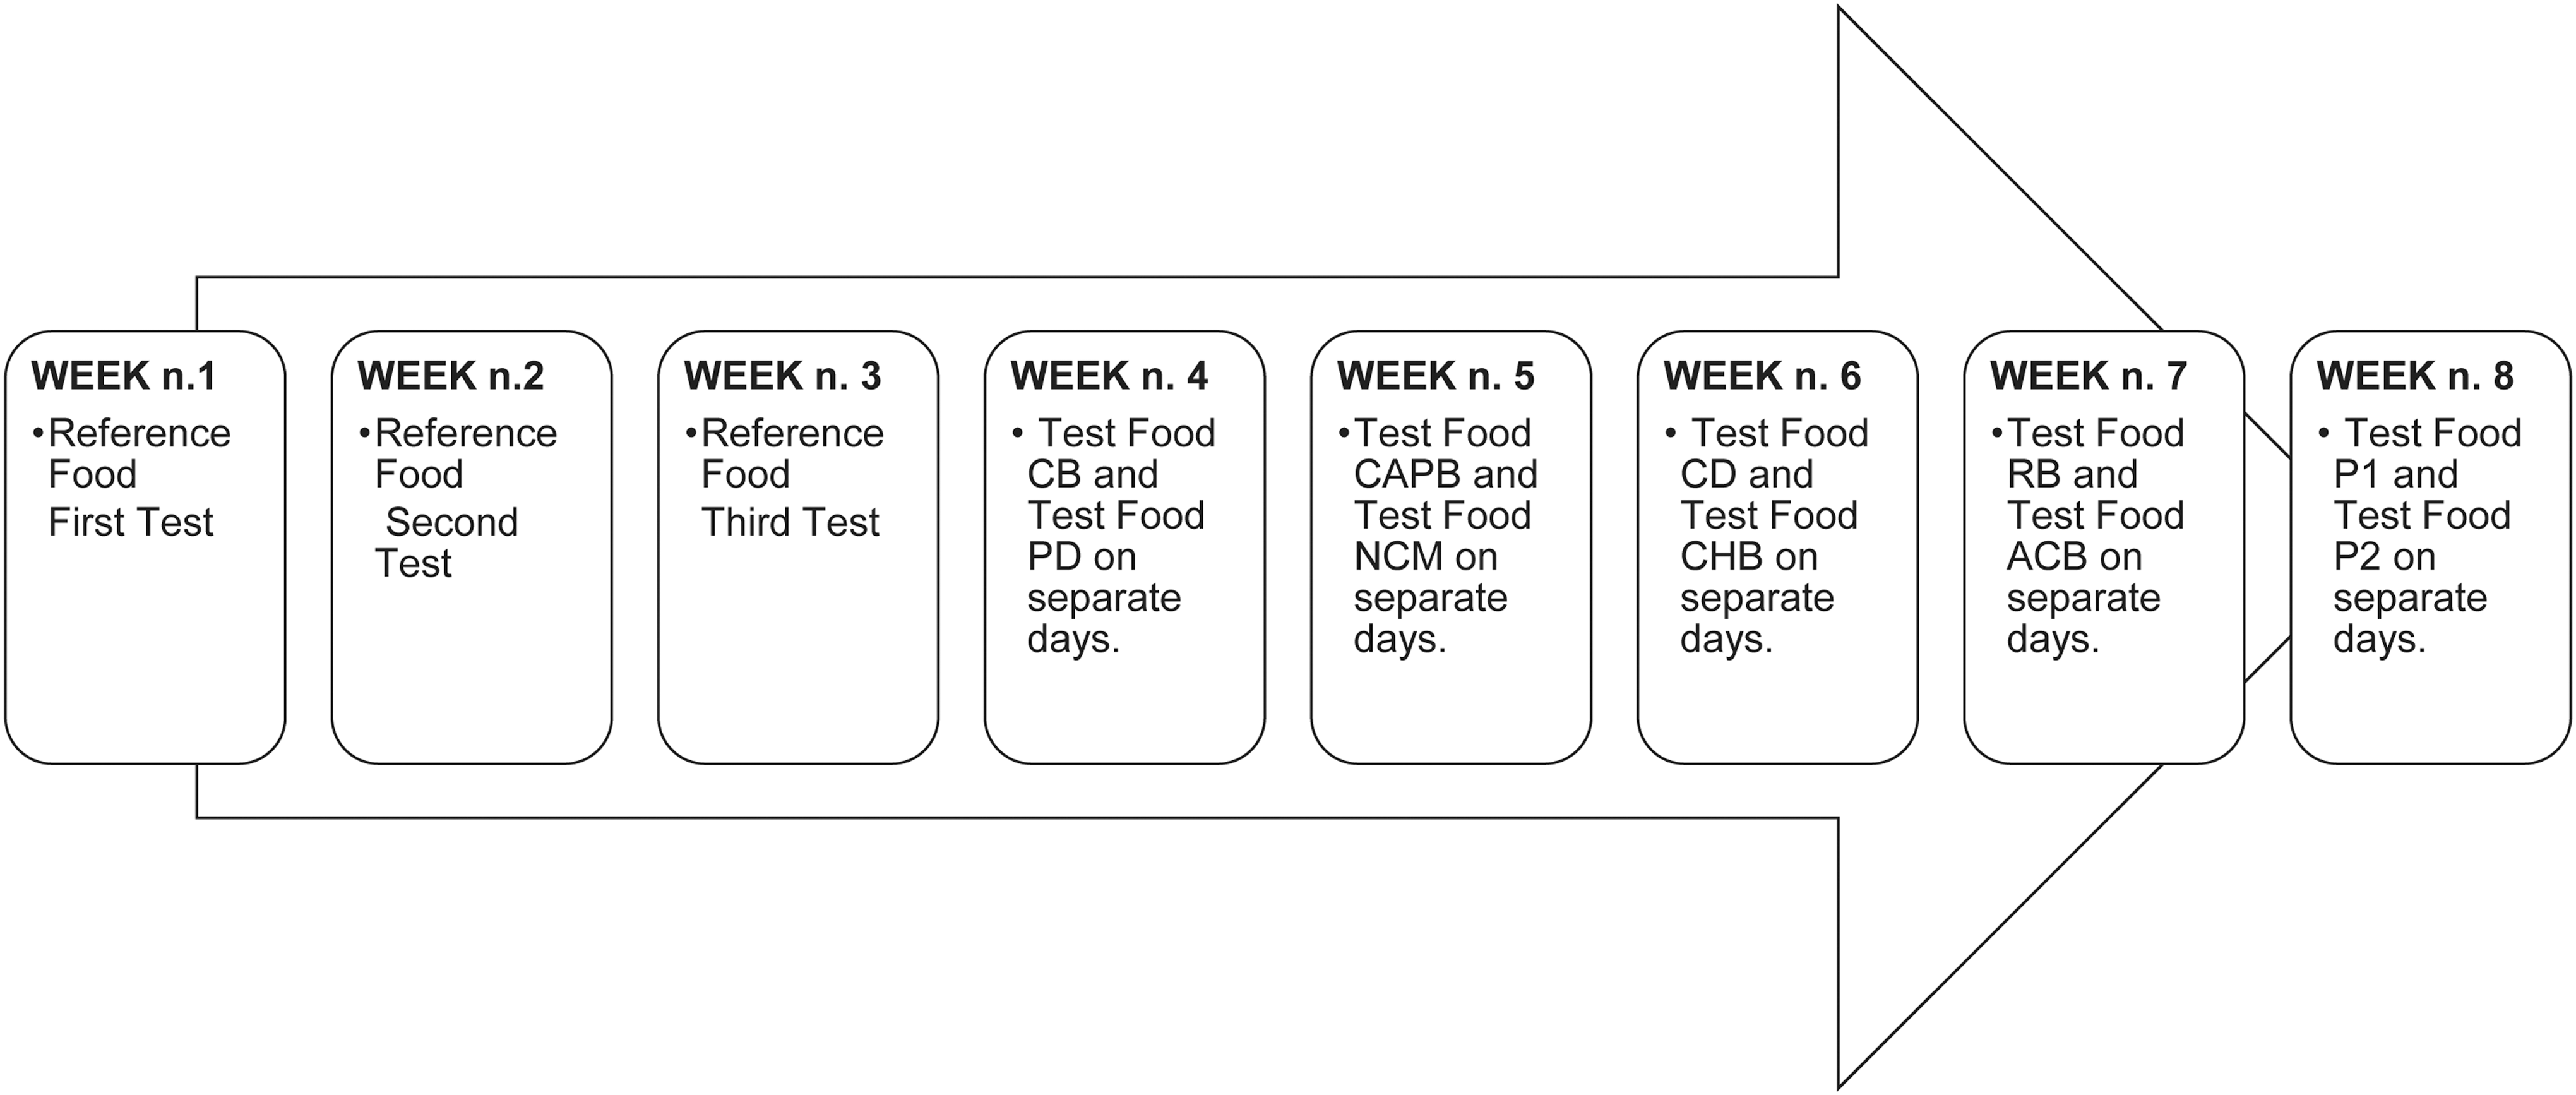
Experimental design.
Fingertip capillary blood samples were collected in the fasted state and after 15, 30, 45, 60, 90, and 120 min after starting to eat, changing the finger each time to avoid traumatization of the skin. The puncture was performed with the lancet Accu-Check Safe-T-Pro Plus (Roche Diagnostics, Basel, Switzerland) and blood was collected directly and immediately analyzed using test strip Reflotron ® Glucose. 20 –22 Postprandial effect of sugar content on glycemia is commonly defined through three methods: the GI, the glycemic load (GL), and the glycemic score (GS).
The GI method was developed to rank foods according to the extent to which they increase blood sugar concentrations 23 and it is a number that ranges from 0 to 100, where 100 represents the GI of the reference food glucose. To calculate the GI of a particular food, the area under the curve (AUC) of the rise in blood sugar for a 2 h postprandial period is calculated. This value is consequently expressed as a percentage of the incremental AUC after the consumption of a reference food (commonly white bread or glucose) consumed by the same person on a different day. 24
The test food and the reference food must contain the same amount of available CHO (25 or 50 g) and the individual has to perform the test under standardized conditions.
The GL method takes into account not only the magnitude of the glucose blood spike but also the content (grams) of CHO in the portion of food consumed, and it is calculated as the mathematical product of the GI for the available CHO content of the food.
25
The GS method tests the glycemic response after the ingestion of low-CHO foods and differs from the GI as it does not compare a standard amount of available CHO.
However, it compares the effect on glycemia of a 1000 kJ portion of both test food and reference food.
25
Due to the very low-CHO content of the tested foods and because of the quantity of food required to reach the 25 g of available CHO for the calculation of GI being too large, this study utilized the GS method. 25
Each tested food was served as a 1000 kJ portion with 220 mL warm (no sugar) tea for a better compliance of subjects in cold winter mornings after an overnight fast (tea does not alter the incremental area under the glycemic response curve 26 ) and consumed within a period of 10 min. This study tested 10 proprietary foods selected from the product range of Tisanoreica® snacks and meals (Gianluca Mech S.p.A., Asigliano Veneto, Vicenza, Italy). These are ready-to-consume foods high in protein and fiber content and low in CHO content designed to be consumed during a VLCKD or an LCD regimen. 4,9,27
Among the products selected, six of them were sweet (chocolate biscuits [CB; Cioco-Mech], chocolate and hazelnut balls [CHB; Bon Mech], apple–cinnamon biscuits [ACB; T-Biscuit], chocolate–almonds–pistachio bar [CAPB; T-Smart], nuts and chocolate muffin [NCM; T-Muffin], and chocolate drink [CD; Cocoa Drink]). The other four products tested were savory (two different types of pasta P1 [Original Tisanopast] and P2 [Tisanopast Style], the rosemary breadsticks [RB; T-Smech], and the pizza dough [PD; Pizza Dough]) (Table 1). Glucose was used as reference food. This was dissolved in 220 mL of water and served as 1000 kJ portions (15.68 kJ/g) 28 and had to be consumed within a 10 min period.
ACB, apple and cinnamon biscuits; CAPB, chocolate–almonds–pistachio bar; CB, chocolate biscuits; CD, chocolate drink; CHB, chocolate and hazelnut balls; CHO, carbohydrate; NCM, nuts and chocolate muffin; P1, pasta type 1; P2, pasta type 2; PD, pizza dough; RB, rosemary breadsticks.
All statistical analyses were performed using package GraphPad Prism version 6.00 for Mac, GraphPad Software (San Diego, CA, USA). The AUC values above the fasting glucose concentration for each test food and for the reference food were used to calculate the GS of each test food and assessed using an XY data table by selecting the AUC analysis. The effect of each test food on glycemia compared with that of the reference food over time was assessed using a mixed model ANOVA (time × treatment). A post hoc Sidak's multiple comparison test was performed.
To select those test foods with a significant difference of blood sugar values compared with the other test foods, a two-way repeated measure ANOVA (time vs. nominal variables test foods vs. measures) was performed. Each row represented a different time point, so matched values were stocked into a subcolumn. Tukey's multiple comparison test was chosen to compare columns within each row.
A bivariate analysis was used to test, through a linear regression analysis, the significance of the associations between GS and sugars, and protein and fiber in the 10 foods tested. An alpha level of P < .05 was used to denote a significant effect.
Results
Mean GS, mean glycemia, and mean glycemia in the different time points of the 10 test foods and the reference food among the subjects tested are listed in Table 2.
GS, glycemic score.
Mean glycemia after taking the reference food glucose resulted in 122 ± 15 mg/dL, that after taking the sweet test foods was 89 ± 7 mg/dL, and that after ingestion of the savory test foods was 91 ± 8 mg/dL.
Figure 2 shows the comparison of mean blood sugar concentrations at the different time points between glucose and sweet test foods, whereas Figure 3 shows that between glucose and savory test foods. After the ingestion of all sweet and savory test foods, the blood sugar showed always a significantly lower trend compared with that after the intake of the reference food glucose after 15, 30, 45, 60, and 90 min, although several test foods (CHB, CAPB, NCM, ACB, PD, and RB) were able to maintain this significance even after 120 min.
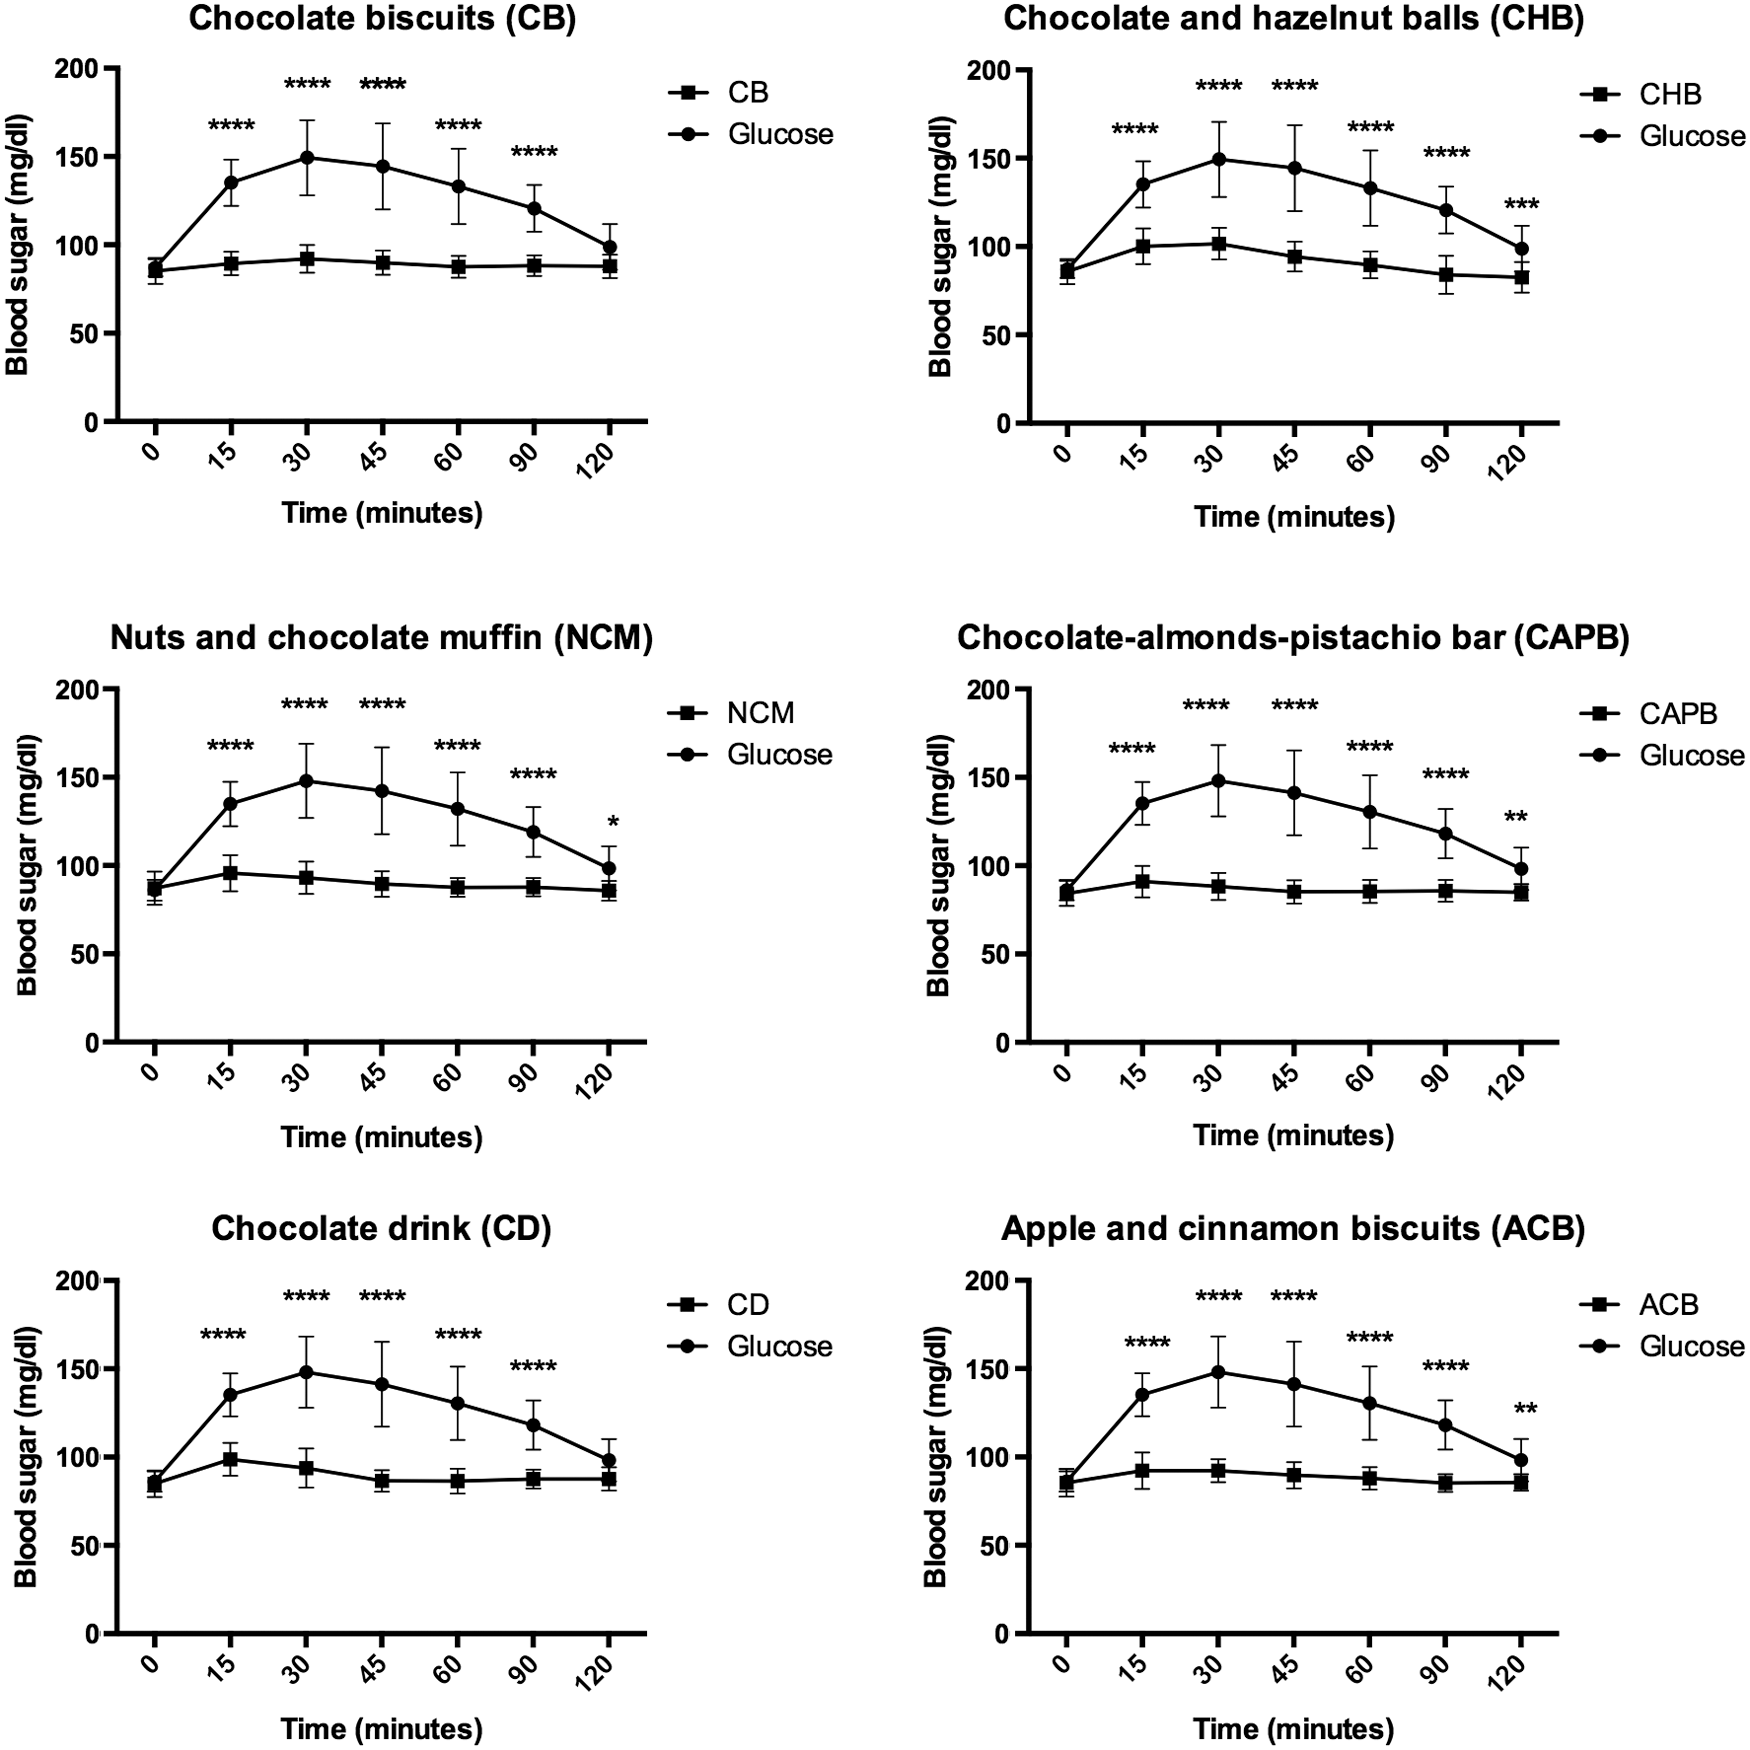
Comparison of mean blood sugar concentrations between glucose and sweet test foods (*P < .05; **P < .01; ***P < .001; ****P < .0001). Foods were tested among 14 healthy subjects. All tested foods and the reference food glucose were served as a 1000 kJ portion and consumed within 10 min.
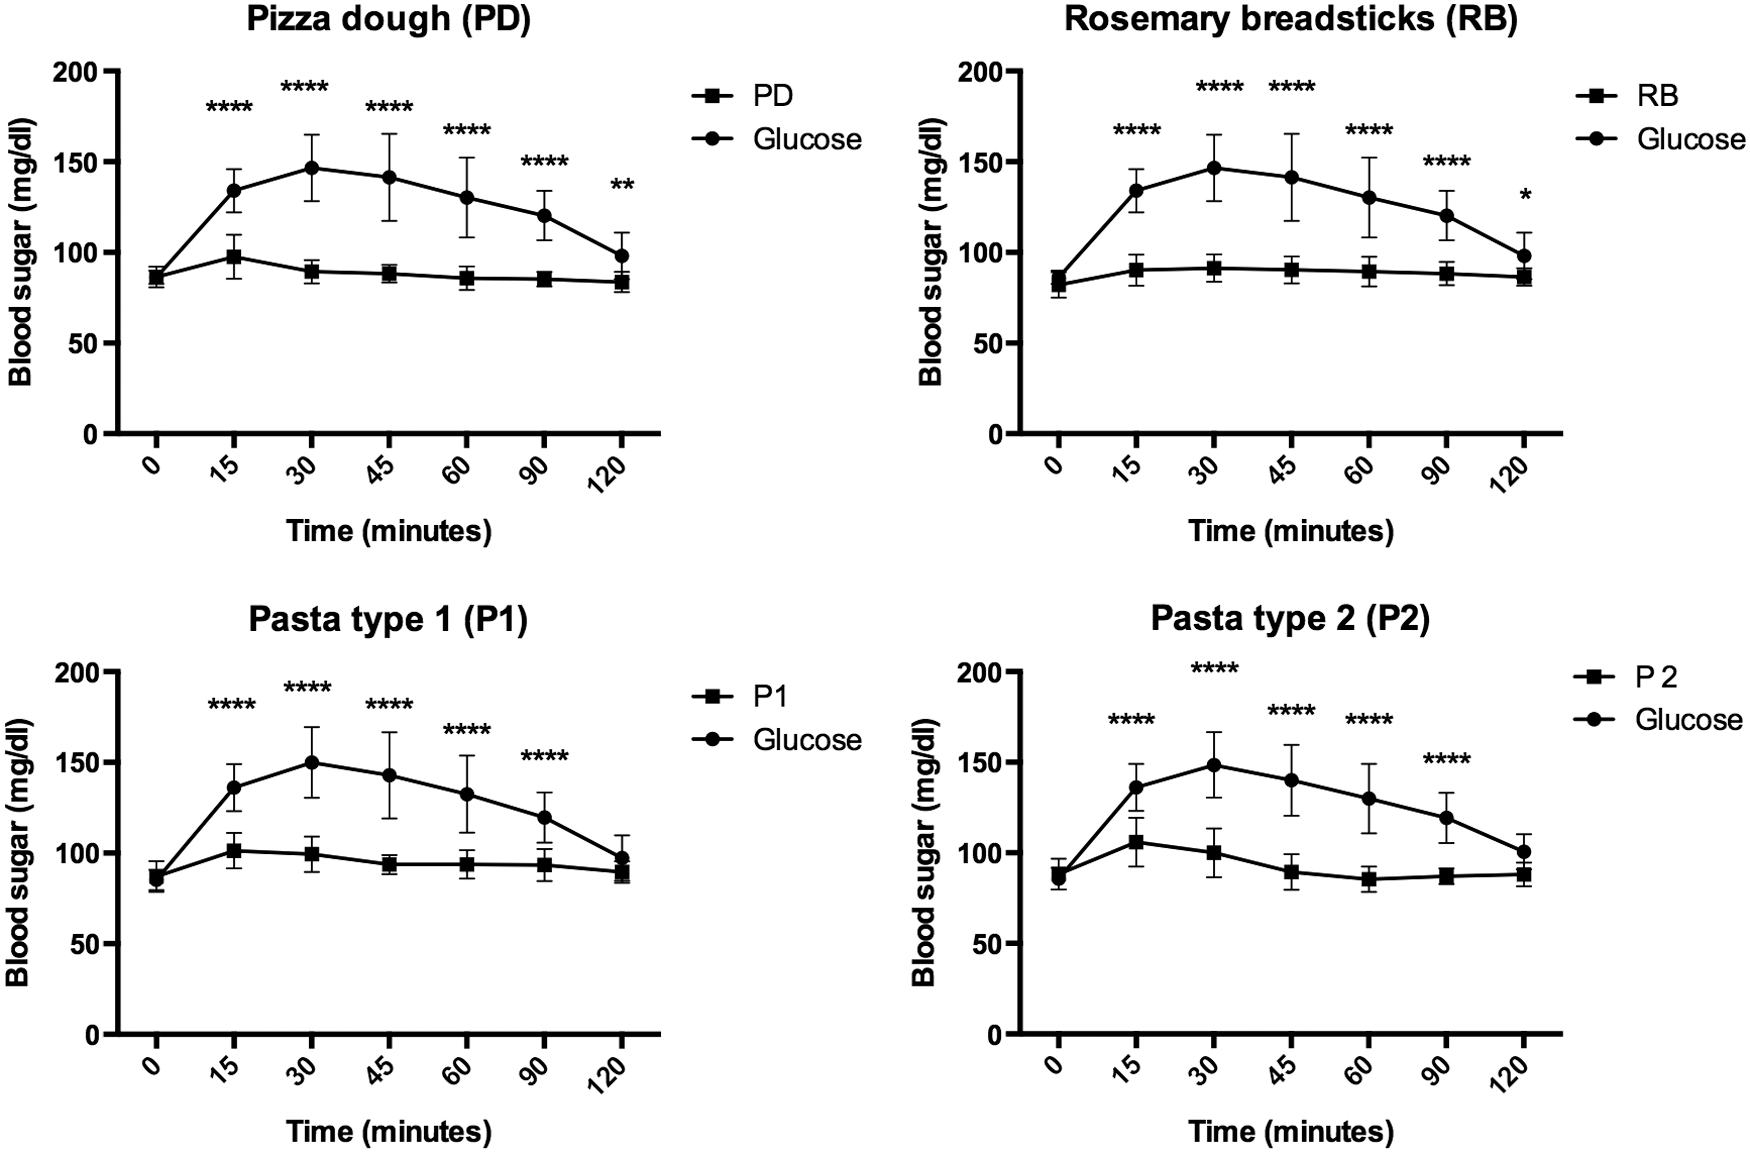
Comparison of blood sugar concentrations between glucose and savory test foods (*P < .05; **P < .01; ****P < .0001). Foods were tested among 14 healthy subjects. All tested foods and the reference food glucose were served as a 1000 kJ portion and consumed within 10 min.
Figure 4 shows the comparison of blood sugar concentrations between sweet test foods and savory test foods. Comparison of mean blood sugar concentrations at the seven different time points highlighted a significant higher increase of glycemia, particularly 15 and 30 min after taking the CHB and the two kinds of pasta P1 and P2 compared with the other test foods (Fig. 4).
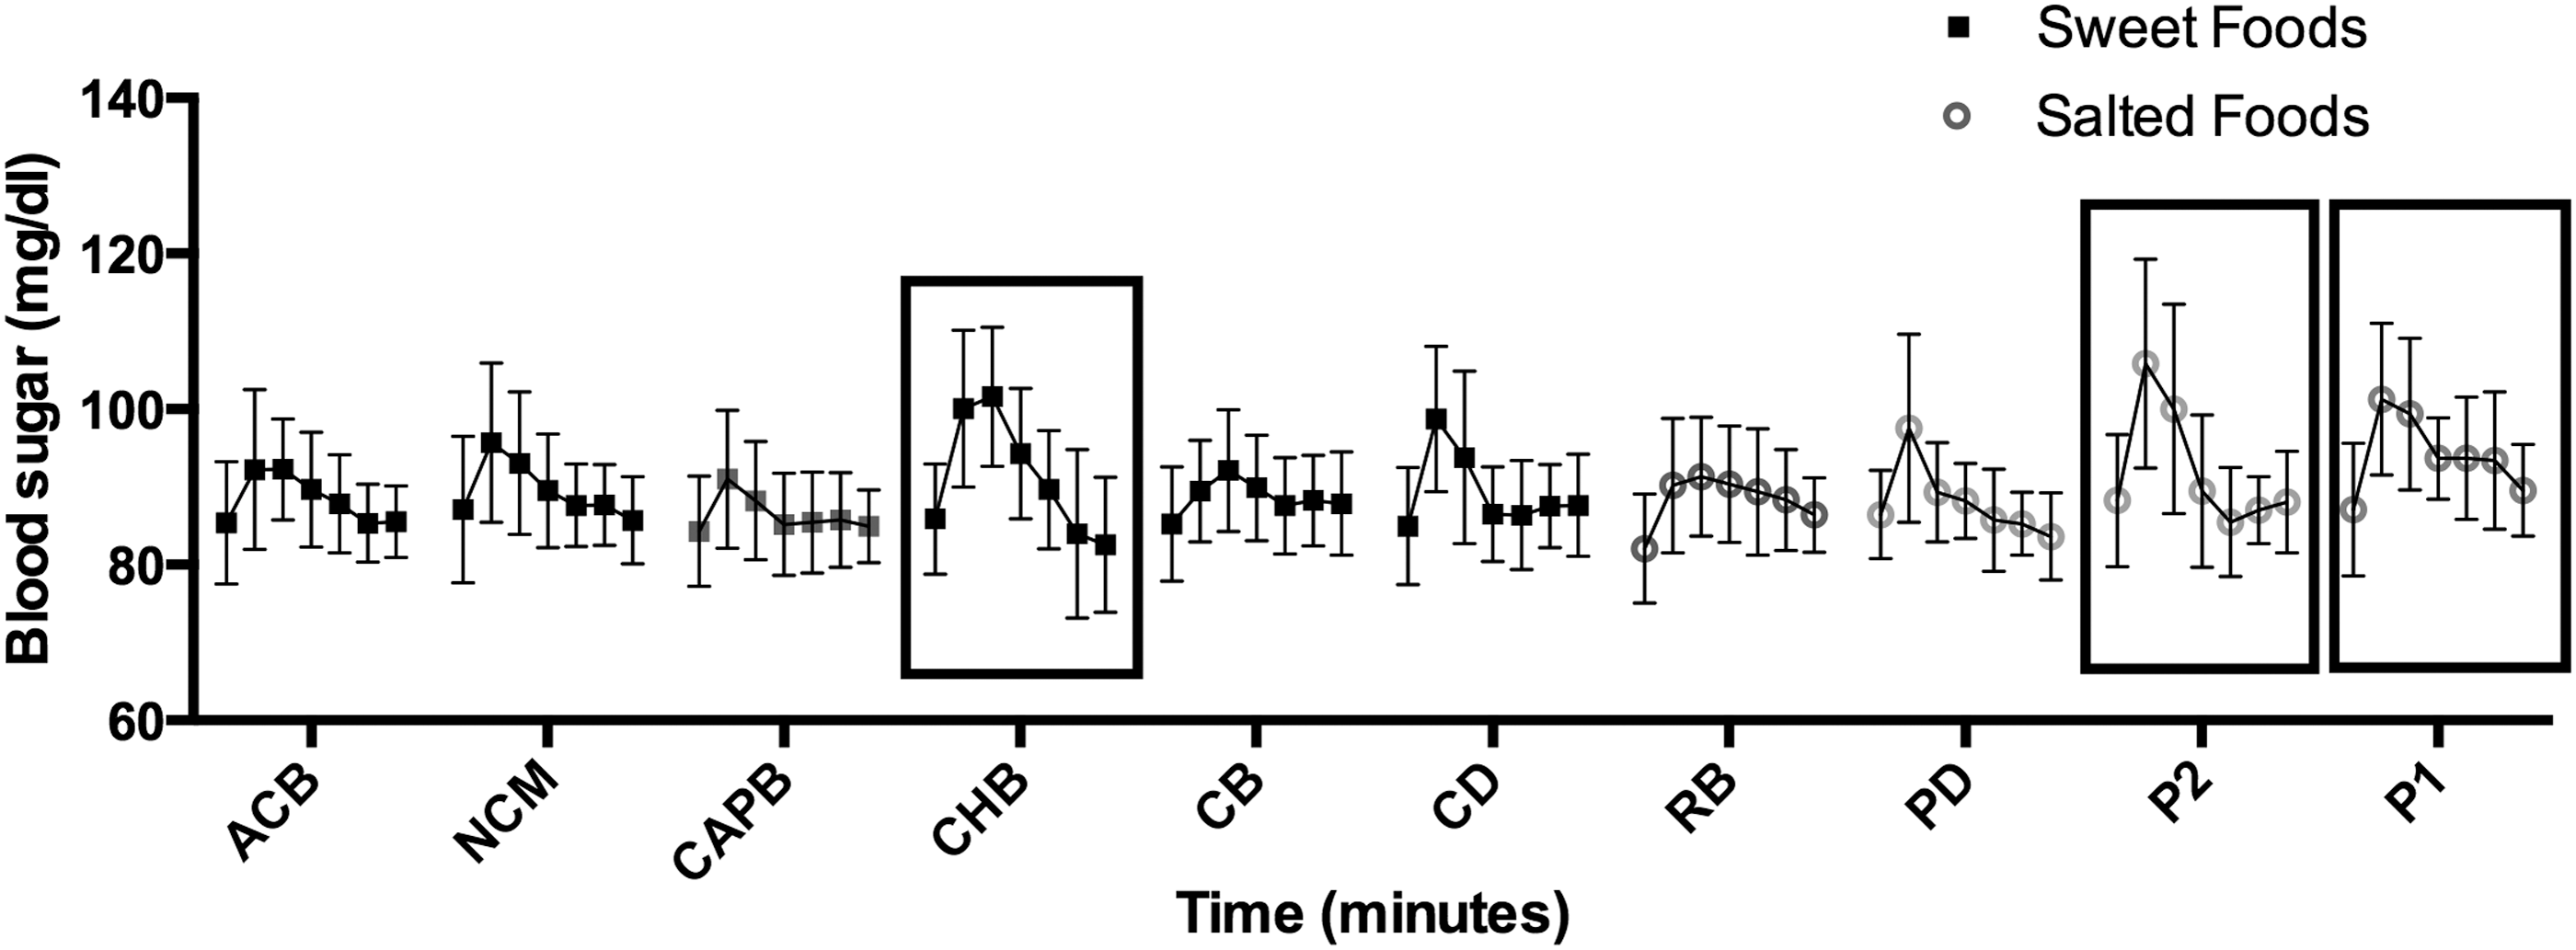
Comparison of blood sugar concentrations between sweet test foods and savory test foods. Among sweet test foods, the CHB show a higher increase in blood sugar than other test foods (significant differences are shown in Fig. 5). Among savory test foods, both pasta type 2 (P2) and pasta type 1 (P1) show a higher blood sugar trend (significant differences are shown in Figs. 6 and 7). CHB, chocolate and hazelnut balls.
In particular, the mean glycemia increased significantly 15 and 30 min after the intake of CHB compared with the mean glycemia after the ingestion of the CB, the CAPB, the RB, and the PD (Fig. 5).
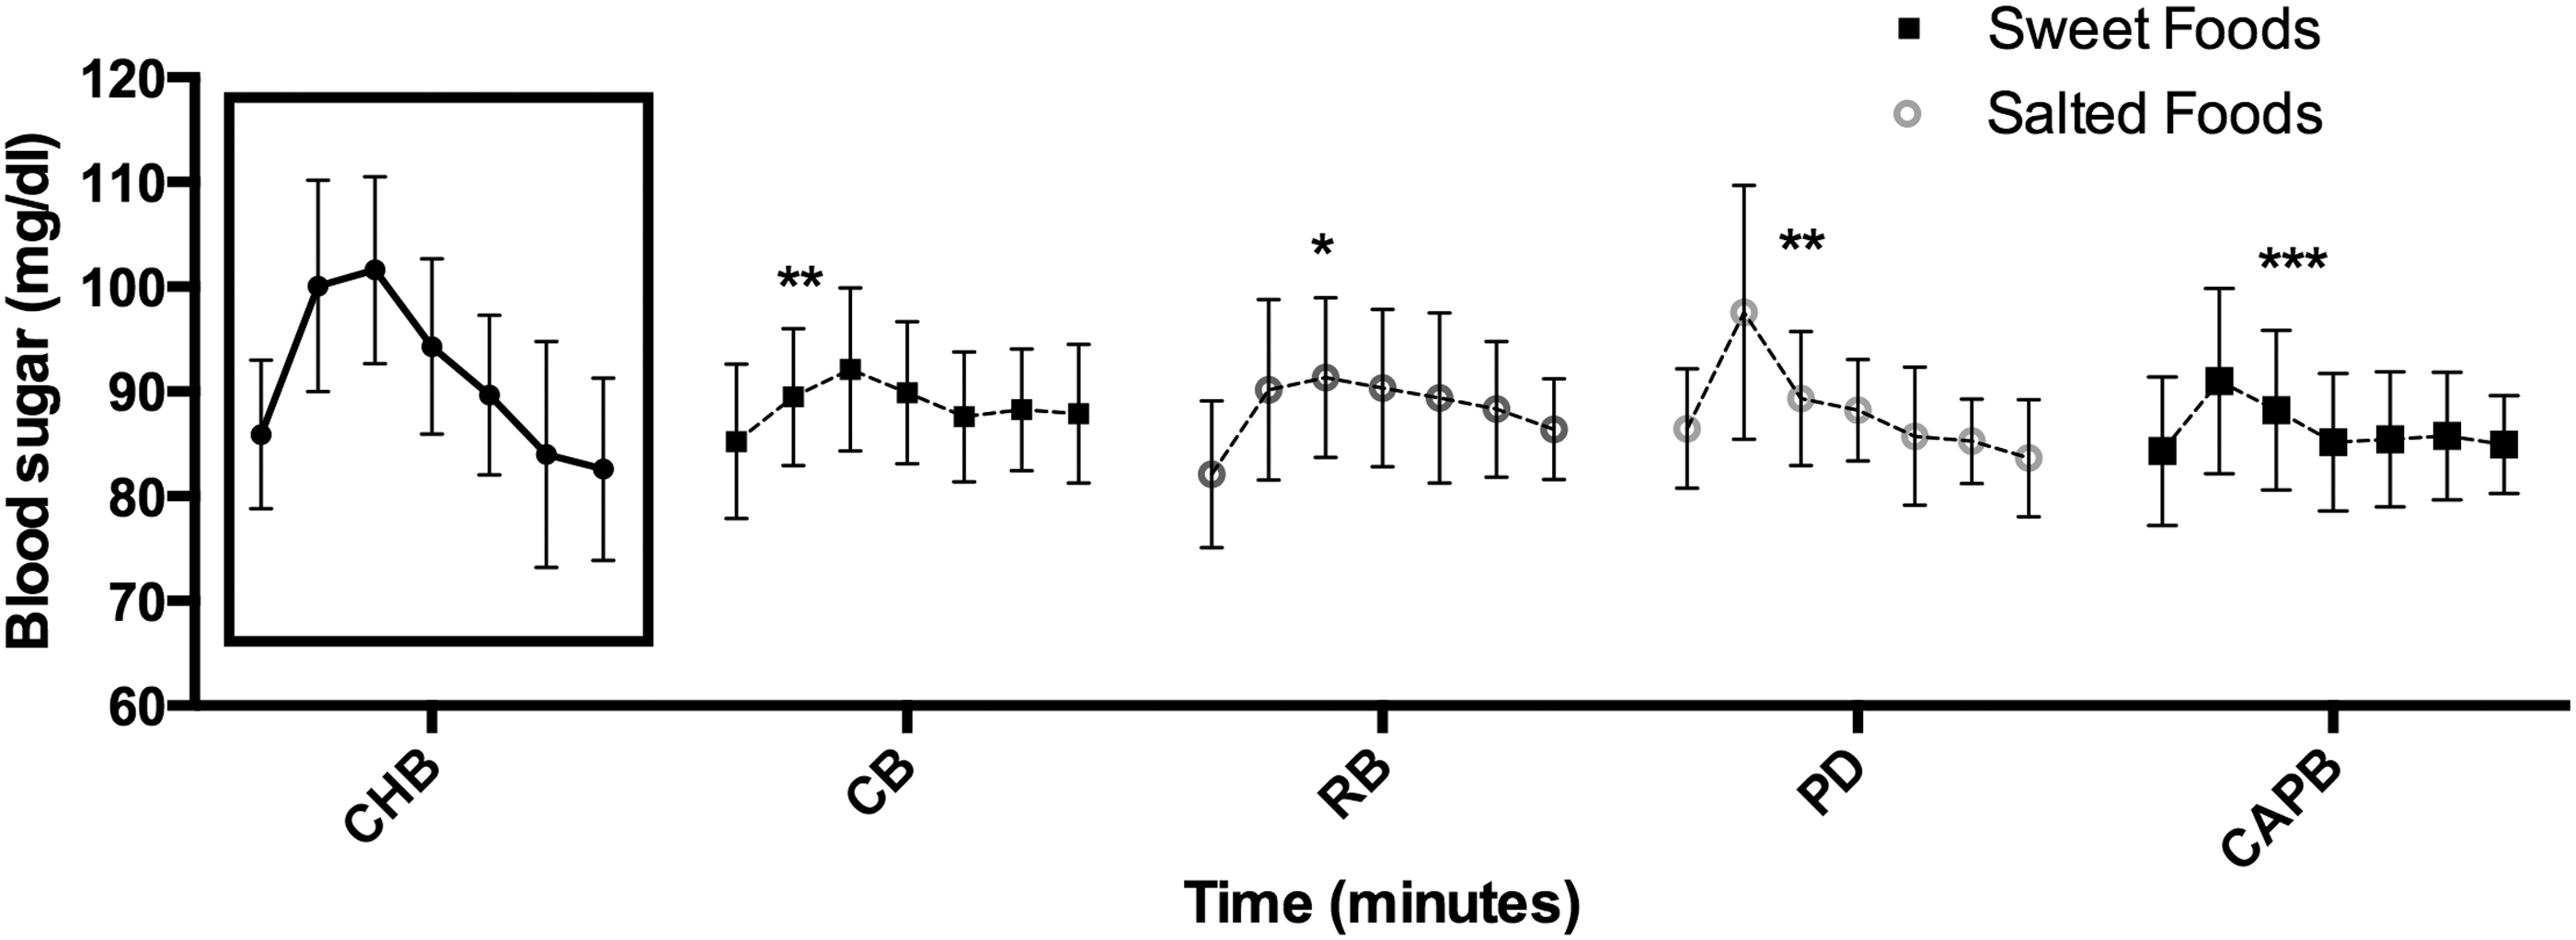
Comparison of mean blood sugar concentrations between the CHB and the other test foods. Results show significant differences after 15 or 30 min between CHB and CB, RB, PD, and CAPB. *P < .05; **P < .01; ***P < .001. CAPB, chocolate–almonds–pistachio bar; CB, chocolate biscuits; PD, pizza dough; RB, rosemary breadsticks.
After the intake of P2, the mean glycemia increased significantly after 15 and 30 min. compared with the sweet test foods CB, CAPB, and NCM and with the savory test foods PD and SB (Fig. 6).
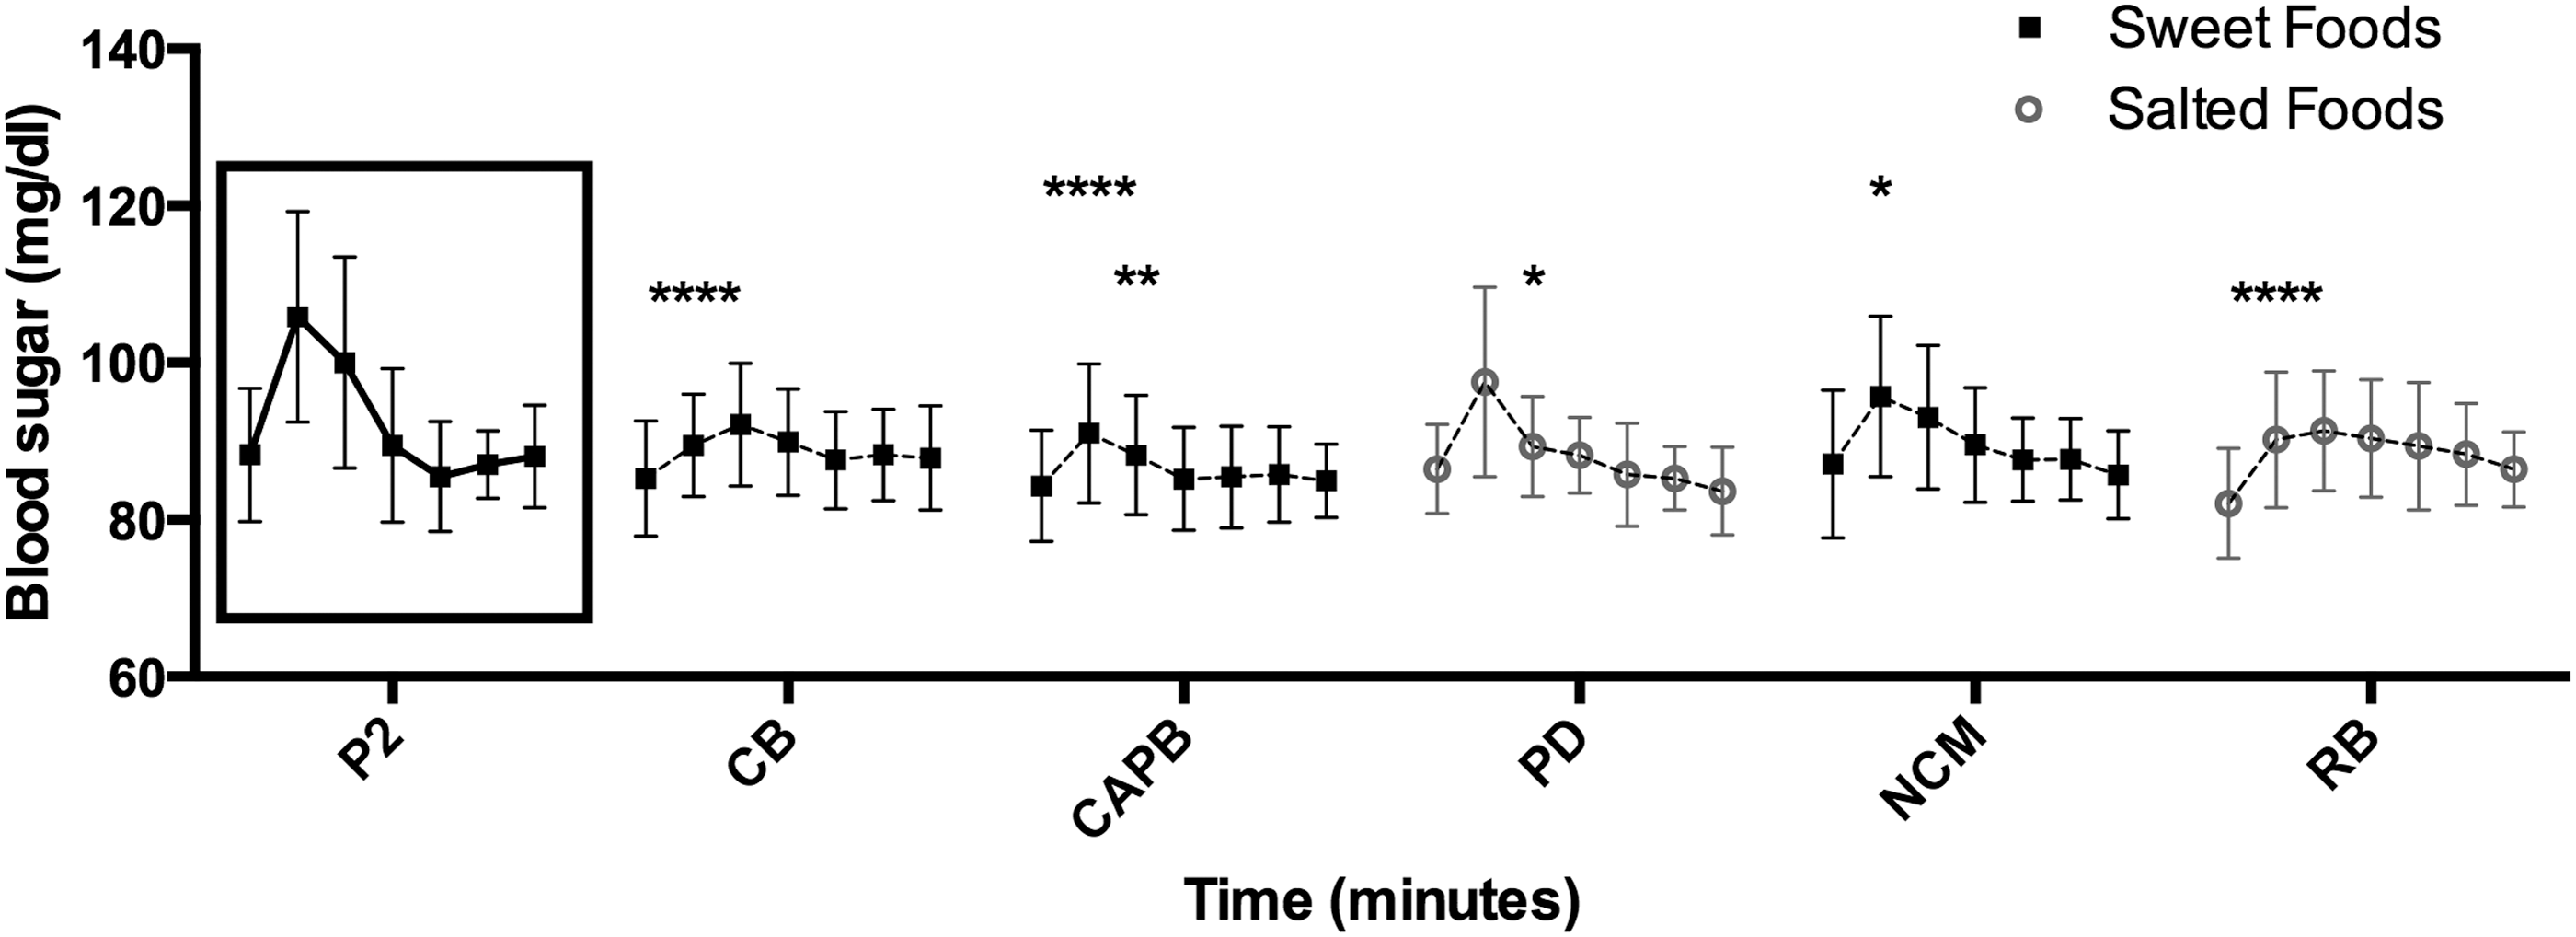
Comparison of mean blood sugar concentrations between pasta type 2 (P2) and the other test foods. Results show significant differences after 15 or 30 min between P2 and CB, CAPB, PD, NCM, and RB. *P < .05; **P < .01; ****P < .0001. NCM, nuts and chocolate muffin.
After the intake of P1, the mean glycemia increased significantly after 15 and 30 min. compared with the sweet test foods CB and CAPB and with the savory test foods PD and RB (Fig. 7).
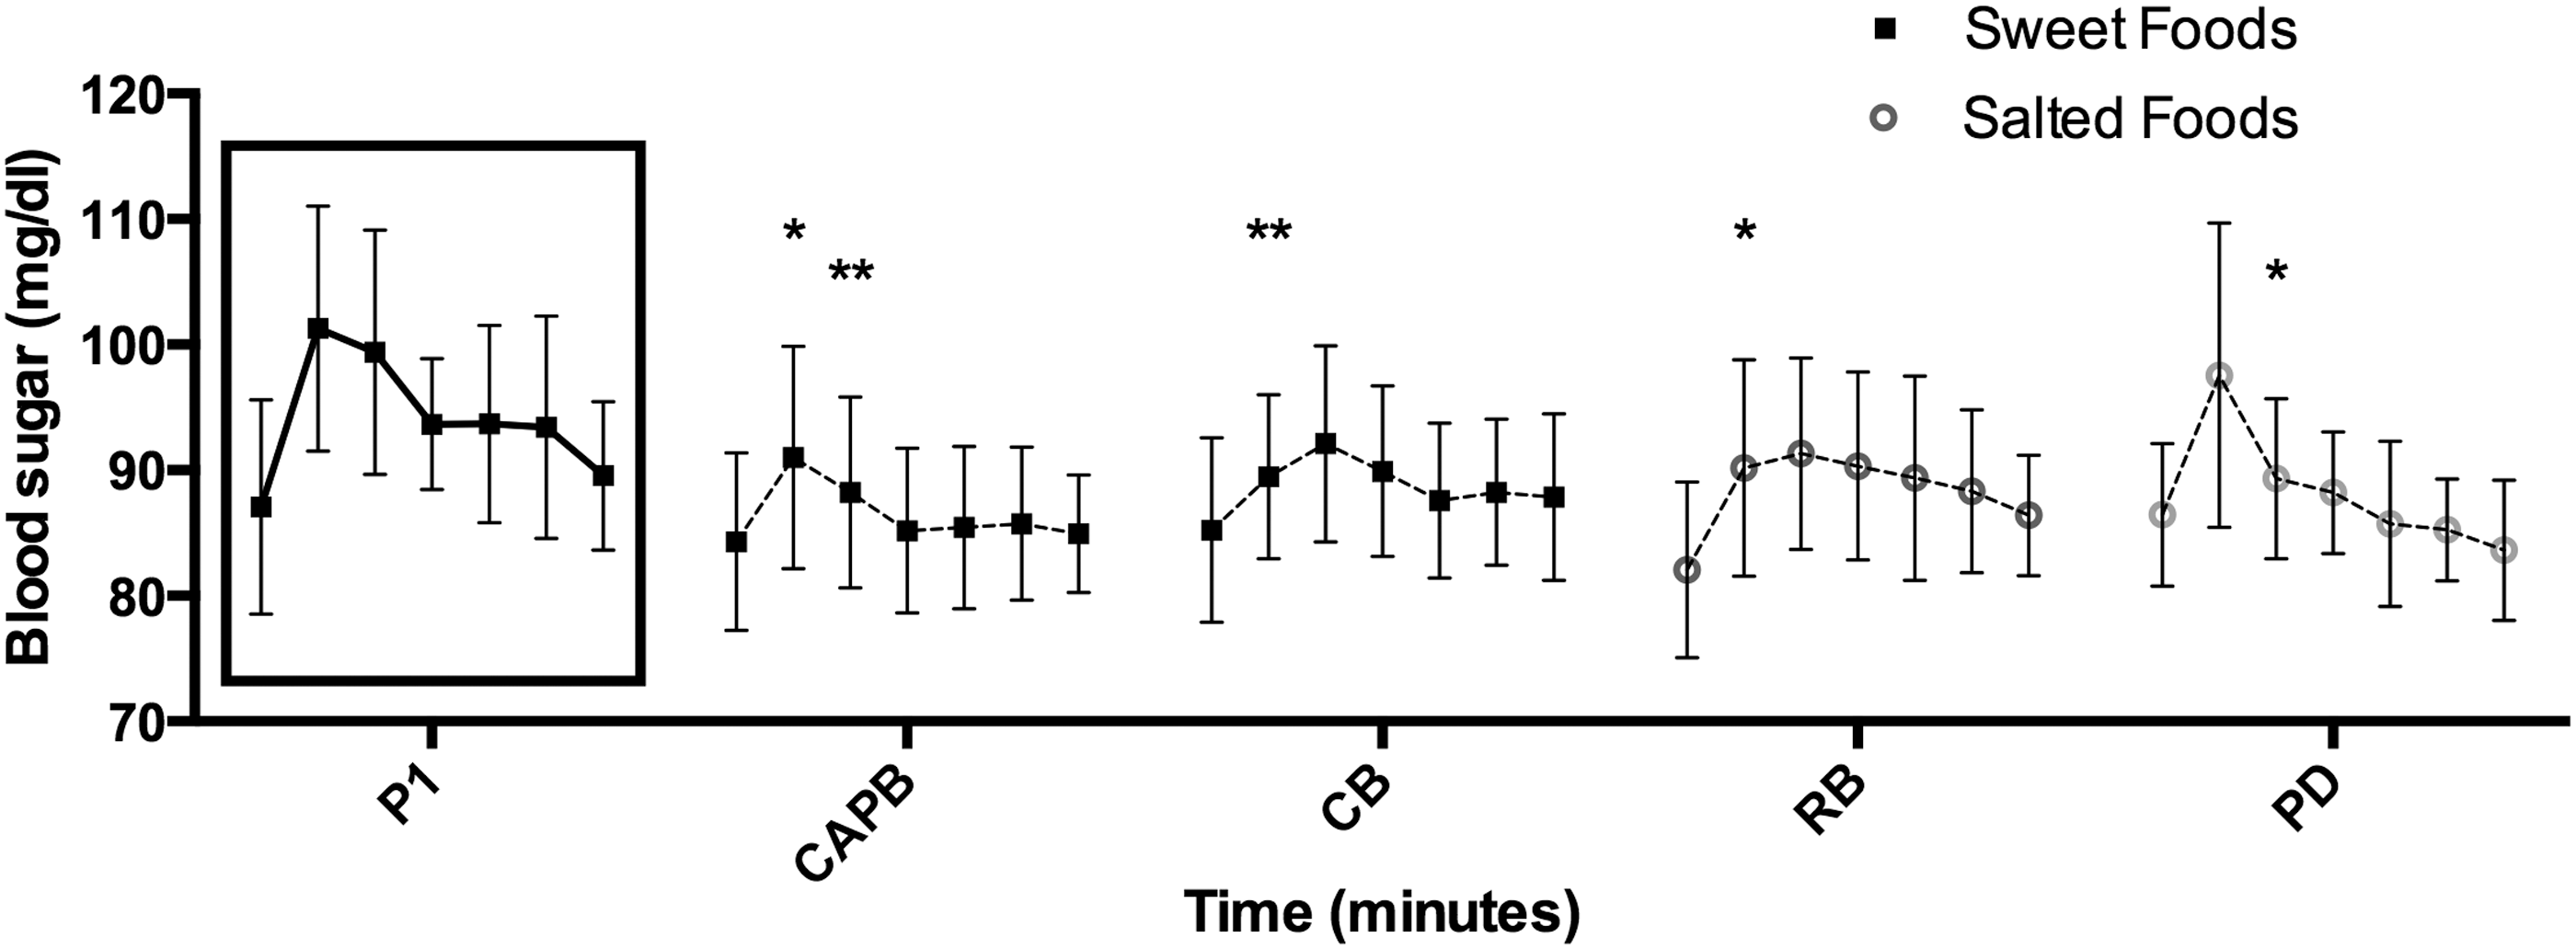
Comparison of mean blood sugar concentrations between the pasta type 1 (P1) and the other test foods. Results show significant differences after 15 or 30 min between P1 and CB, CAPB, PD, and RB. *P < .05; **P < .01; ***P < .001; ****P < .0001.
The statistical two-way ANOVA of the trend of blood sugar from before starting to eat up to 2 h after the intake of the reference food or of the test foods shows that, on average, the 40% of the total variation observed is because of the difference between the foods eaten (glucose or test foods). This result shows that, among all the “Sources of Variation” analyzed (time, food, and subjects), the variable “food” appears to be the one that explains most of the variation observed between the blood sugar trends after the intake of test foods and the blood sugar trend after the intake of the reference food.
The results did not show any correlation between GS and fiber content (r = −0.08; P = .37), neither between GS and sugar content (r = 0.17; P = .09), nor between GS and protein content (Fig. 8).

Bivariate correlations between observed glucose responses (GS) (relative to 1000 kJ glucose = 100), the available sugars, protein, and fiber contents of the 10 single test foods. Linear regression analysis was used to test the significance of the associations. Each point on the graph represents the mean result for each test meal (14 subjects).
The average GS of each test food, calculated as the mean of GS values of each test food resulted from every subject, was always less than 25 compared with the GS reference value of glucose, which is 100 (Table 2). The test food with the highest GS is the sweet test food Bon Mech with a GS of 23. The test food with the lowest GS is the sweet test food Cioco Mech and T-Smart, with a GS of 14.
Discussion
In this study, the GS of 10 proprietary foods high in proteins and fibers and low in sugars and saturated fats was tested. These proprietary foods claim to replicate the taste and aspect of high-CHO foods and are commonly used as meals during VLCKD regimens. In our study, the products tested showed a significant lower blood sugar response and lower GS than an isoenergetic amount of glucose. Among the six sweet and four savory test foods, the CHB showed the highest GS (GS = 23). This result is consistent with the higher quantity of available sugars of CHB compared with the other test foods. The CB and the CAPB had the lowest GS of 14. This GS value is, according to the data available, 25 similar to the GS value of a low-fat processed cheese.
The macronutrient composition is important for glucose response, with CHO as the food component that acts directly on glycemia, rising it and stimulating insulin secretion. However, even if CHO counting is still the basis for insulin dose adjustment in diabetes care management, 29 data show 25 that sugar content could be a stronger predictor of the observed glucose response than CHO. Other studies show that the structure of CHOs should also be kept under consideration: a disrupted structure, typical of processed whole grains, has a different effect on glycemia compared with intact grains. 30
Even if there is a strong evidence supporting fibers' beneficial effect in reducing disease risk, 25 only soluble fibers with gel-forming properties show a distinguishable effect for glycemic control. 31,32
This study does not show any significant relationship between GS and fiber content, but, differently from them, it does not show any correlations between GS and sugar content (Fig. 8). This conflicting result might be because of the very low quantity of available sugars in the test foods. Finally, protein content, despite being considered predictive for the GS, 25 did not show such correlation in this study.
The low postprandial glycemia produced by the proprietary foods tested is an important factor, because ultraprocessed ready-to-consume products are commonly high in simple sugars that negatively affect a number of health parameters. Postprandial hyperglycemia and compensatory hypoglycemia are factors linked to the development of diabetes and CV diseases. 33 Furthermore, the consumption of high-sugar snacks seems to be the main cause for the increase in intrahepatic triglyceride content. 34 Finally, the usual rapid and high glycemic peak caused by ultraprocessed products, together with their lack in fiber, proteins, and water, triggers an excessive consumption. 19,35
Sugar is rapidly absorbed and produces a consequent high blood sugar spike that acts centrally, increasing the production and utilization of dopamine, which imitates the typical neuromodulation of addictive substances. 36
The abuse of high sugary ultraprocessed foods leads to the synthesis and the accumulation of fat and results in weight gain, 8 which increases the risk of obesity and MetS. According to the definition by the World Health Organization, MetS is the simultaneous presence of insulin resistance along with two other risk factors from high blood pressure, raised triglycerides, low HDL, and increased BMI (or increased waist:hip ratio) and microalbuminuria. 37 The prevalence of this disease, once suggested to be exclusive of adulthood, is becoming a major worldwide concern among both children and adolescents, 38,39 and the consumption of ultraprocessed foods is considered an important risk factor for its development. 40 Bielemann et al. 41 recently demonstrated that ultraprocessed foods were responsible for 50% of the daily caloric intake among a cohort of 23-year-old participants in Brazil. Interestingly, the household availability of ultraprocessed ready-to-eat foods was associated with a low percentage of proteins and fibers intake.
Appetite control is related not only to glucose content and postprandial glycemia but also to other factors 42 among which the reward system in the brain, aside from the homeostatic control by the hypothalamus, has been the focus of recent interest, since food reward is a goal that drives both appetite and eating. 43,44
The larger the portion size, the more food is eaten, 44 but eating is only indirectly related to energy balancing because it seems that we eat essentially for pleasure. 44 These new low-calorie proprietary foods could help to reduce energy intake, useful for a better weight maintenance or a more successful weight loss. Moreover, since high-energy-dense foods have the lowest satiating capacity even if they usually have a high palatability, 44 the high level of proteins and fibers and the high palatability, despite the low sugar content, of these new ultraprocessed foods, are important features that contribute to both food reward and satiety. 45
The tendency to prefer sugary fatty foods over savory foods is considered innate and universal and finds its roots in very important adaptive processes: a bitter taste is considered predictive of toxicity and then avoided (alkaloids, glycosides, and other toxins have a bitter taste), whereas sweet taste is associated with energy and nourishment. 46 Although it is recognized that the VLCKDs lead to greater weight losses than a low-calorie balanced diet at least in the short term, 47 subjects with a sweet food preference may not adhere to this diet because of the lack of their preferred taste. 48,49 A VLCKD that includes these proprietary foods that imitate taste and aspects of high-CHO food but have a low glucose content can consequently produce a higher level of adherence and a reduced drop-out rate. 4,50
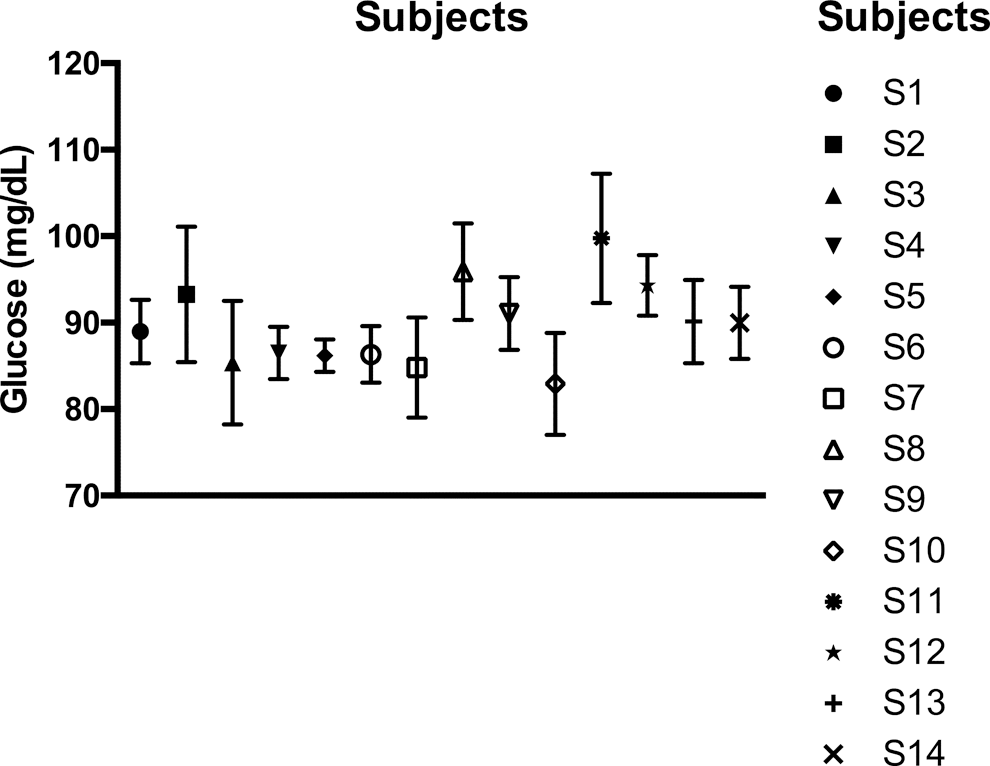
Subjects' glycemic variability in response to the tested proprietary foods (mean of all foods and SD are reported in the figure).
Sweet foods are usually rich in refined CHO, have a high GI, and are related to an increased risk of overweight, obesity, 51 and type 2 diabetes mellitus (T2DM). 52 T2DM is increasing among young people 53 and a dietary management is the most important factor to be considered to prevent the progression of impaired glucose tolerance to clinical DM. A dietary management is also important to minimize the glycemic variability, which is the measure of blood sugar concentration changes over time. 54 An uncontrolled blood sugar concentration is the major risk factor in the development of T2DM complications such as retinopathy, neuropathy, nephropathy, and CV diseases. 55 –58 It is important to make healthier nutritional choices to prevent these complications, which are associated with high economic, social, and personal costs. Low-CHO high-protein diets help to normalize glycemic fluctuations in T2DM management. 59 As suggested by the European Association for the Study of Diabetes (EASD), dietary fibers can further positively influence blood sugar variability. The EASD consequently recommends the consumption of high-fiber, low-GI foods as CHO source. 54
Dietary amino acids contribute to the de novo synthesis of glucose through gluconeogenesis and participate in the recycling of glucose carbon through the glucose–alanine cycle. 60 However, dietary proteins have a minimal impact on glycemia and insulin secretion compared with CHOs, 61 and a high-quality protein supplementation has been suggested during weight loss programs to preserve muscle mass, to improve glycemic regulation, and to maintain euglycemia. 62,63 The 10 proprietary foods tested in this study are formulated with whey proteins. These, because of their high content of leucine, which promotes muscle mass synthesis and because of their fast digestion and delivery of amino acids in the circulation, are consequently considered the best type of proteins. 62
Moreover, whey protein decreases appetite better than other types of proteins 64 and increases satiety through an increase of the release of CCK and GLP-1 and a reduction of ghrelin levels. 65
The sweet proprietary foods tested in this study also contained low-calorie sweeteners. These are compounds able to stimulate, in the same way as sugar does, the sweet taste receptors. 66
Unlike sugar, low-calorie sweeteners do not release energy and hence they are used in weight loss programs even though perceived as controversial by the scientific community. This is due to low-calorie sweeteners producing possible adverse metabolic effects, such as increase of appetite, weight gain, and metabolic disorders. 67 –69 However, more studies are required to confirm these negative suggestions, since a recent review shows that there is no evidence for a limitation of their use to reduce energy intake. 70 The same author states that our congenitally liking for sweetness implies that the reward value from sugar and low-calorie sweeteners is the same, but low-calorie sweeteners should be preferred, because they avoid the high-calorie intake side effect of sugar. 44 These compounds could be useful in the prevention of overweightness and obesity in populations that are less sensitive to sweetness, predisposing them to consume more sugar to have the same “taste sensation” as people more sensitive to sweetness. 71 Nowadays low-calorie sweeteners are important tools in DM management, in which dietary adherence is among the most difficult cornerstones, 72 especially for children and adolescents with T2DM who suffer from the perceived lack of normality in their diet and consequently desire nonrecommended sweet foods. 73
Ready-to-consume proprietary foods, high in quality proteins and fibers, could improve both the diet of young people and the diet of T2DM patients. In the former population, this could prevent them from eating high-sugary fatty foods, predisposing them to the development of T2DM, and in the latter to minimize blood sugar variability that often complicates the pathology. The 10 proprietary foods tested showed a significant lower glycemia than the standard food glucose and their GS resulted in always lower than 25. This low glycemic response, together with their valuable ready-to-use format, makes these proprietary foods a valid tool during both weight management and weight loss programs, facilitating the adherence to an LCD of individuals who tend to have a high preference for sweet foods.
Footnotes
Acknowledgment
We express our gratitude to all study participants.
AUTHORS' CONTRIBUTIONS
A.P. has received grant support for this study from Gianluca Mech S.p.A. The company had no role in the study design, data collection, data analysis, data interpretation, or writing of the article. All authors contributed to data analysis and interpretation, and writing and/or editing of the article. All authors gave their final approval of the version to be published.
Author Disclosure Statement
No competing financial interests exist.