




Abstract
This study was performed to investigate the effect of Agave tequilana Weber inulin on postprandial ghrelin levels in obese patients. A randomized, double-blind, cross-over design was performed. A total of 14 patients were allocated into two groups: one group received a drink that contained 500 mL lemon water, 24 g of A. tequilana Weber inulin, and 75 g glucose and the other group received a placebo drink with 500 mL lemon drink and 75 g of glucose. After a 7-day washout period, the groups were crossed. The primary outcome measure was postprandial ghrelin levels between minute 240 and minute 270. A. tequilana Weber inulin did not change postprandial ghrelin concentration in obese patients.
P
A randomized, double blind, cross-over clinical trial was performed. 6 Participants were obese, body mass index (BMI) between 30 and 34.9 kg/m2, aged 20–40 years, total cholesterol ≤11.1 mmol/L, triglycerides ≤8.3 mmol/L, glucose ≤5.5 mmol/L, and blood pressure ≤120/80 mmHg. Subjects were not eligible if they included a workout of more than 30 min per day, if they had followed any dietary pattern during the past 3 months, consumed more than 30 g of fiber per day, or had been previously treated with nonsteroidal anti-inflammatory or any proton pump inhibitors during the past month. Exercise and diet were not modified to ensure these variables remained stable between periods. The participants provided an informed written consent before enrollment and random assignment into each group.
Study subjects received inulin or placebo test drinks in two different periods separated by a 7-day washout period. One group received during the first period inulin test drink and during the second period the placebo test drink. The other group received the test drinks in a different sequence, that is, placebo test drink during the first period and inulin test drink during the second period.
Both test drinks, inulin and placebo, were masked in taste, color, smell, viscosity, volume, and artificial flavor. The inulin lemon drink consisted of 500 mL of water, 75 g of glucose, and 24 g of A. tequilana Weber inulin, supplied as a white lyophilized powder, maltodextrins, citric acid, sucralose (2.3 g/100 g and acesulfame potassium 0.6 g/100 g), and xanthan gum, and the placebo lemon drink included 500 mL of water, 75 g of glucose, maltodextrins, citric acid, sucralose (2.3 g/100 g and acesulfame potassium 0.6 g/100 g), xanthan gum, and 1 g of sucralose as sweetener.
The test was performed at 8:00 am on two different sessions. After a 12-hour fast, baseline blood samples were drawn and subjects were allowed no more than 5 min to consume the test drink. Further blood samples were drawn at 60, 120, and 240 min intervals after drinking the test drink. Immediately after the 240 min blood sample, a standard lunch was provided. The standard lunch provided 520 kcal distributed as 60% carbohydrate, 20% protein, and 20% fat. The lunch consisted of a sandwich: two slices of whole wheat bread, two slices of jam, 60 g of cheese, and 15 g of sour cream, and 375 mL of orange fresh juice. 1 Subjects ate lunch within 10 min, and further blood samples were drawn at 270, 300, and 360 min. All participants were studied in the same quiet room, awake, with sunlight, and without any distress, and no discussion or food cues during the study were allowed.
The primary outcome was the reduction of postprandial ghrelin concentration. The postprandial measure was defined between 240 and 270 min intervals, after lunch. Ghrelin concentration was measured by enzyme-linked immunosorbent assay (ELISA), using the Total Ghrelin ELISA kit from Merck Millipore with an intraassay variation between 0.9% and 1.3% and interassay variation between 6.2 and 7.8%. The secondary outcome was tolerability; adverse effects were explored systematically during each visit throughout the study sessions.
Glucose was analyzed by an enzymatic reaction using glucose oxidase (GM9D Glucose Analyzer; Analox Instruments) with intra- and interassay coefficients of variation (<1%) and serum lipid levels; total cholesterol and triglycerides were measured enzymatically. Determinations were performed with commercially available equipment (Ortho-Clinical Diagnostics) with intra- and interassay coefficients of variation (<3%). Blood samples were collected in serum blood collection tubes (BD Vacutainer) and after centrifugation, serum was stored at −70°C.
The procedures followed were in accordance with the ethical standards of the responsible committee in human experimentation and with the Helsinki Declaration of 1975, as revised in 2013.
To evaluate the carry-over effect, we performed a Wilcoxon test in both groups. Area under the curve (AUC) was calculated using the polygonal formula and calculated for the following time intervals: 0–120, 0–240, 240–270, and 300–360 min. Wilcoxon's signed ranks and Mann–Whitney U test tested intra- and intergroup differences. An intention-to-treat analysis was used for all patients who were randomly assigned to the groups. A sample size of 14 participants, 7 in each group, was required to detect an effect of 80 pg/mL with a one-sided significance level of P ≤ .05, power at 80% and 20% dropout. Analyses were performed using SPSS version 16.
Considering the baseline characteristics of study participants, there were no significant differences between both groups: age (30 ± 6.2 and 33 ± 7 years, P = .341), BMI (32.3 ± 1.5 and 33.1 ± 1.8 kg/m2, P = .175), systolic blood pressure (115 ± 12 and 108 ± 12 mmHg, P = .128), diastolic blood pressure (75 ± 6 and 74 ± 7 mmHg, P = .233), ghrelin (298.3 ± 8 and 269.4 ± 7 pg/mL, P = .614), glucose (4.25 ± 0.58 and 4.57 ± 0.58 mmol/L, P = .371), total cholesterol (10.11 ± 1.59 and 10.29 ± 2.01 mmol/L, P = .256), and triglycerides (7.38 ± 1.9 and 6.95 ± 2.62 mmol/L, P = .255) concentrations. No carry-over effect was observed during the study.
Figure 1 shows ghrelin response. Ghrelin did not differ among test drinks (AUC: 8.13 and 7.85 mmol/L, P = .801). No adverse effects were reported during the study.
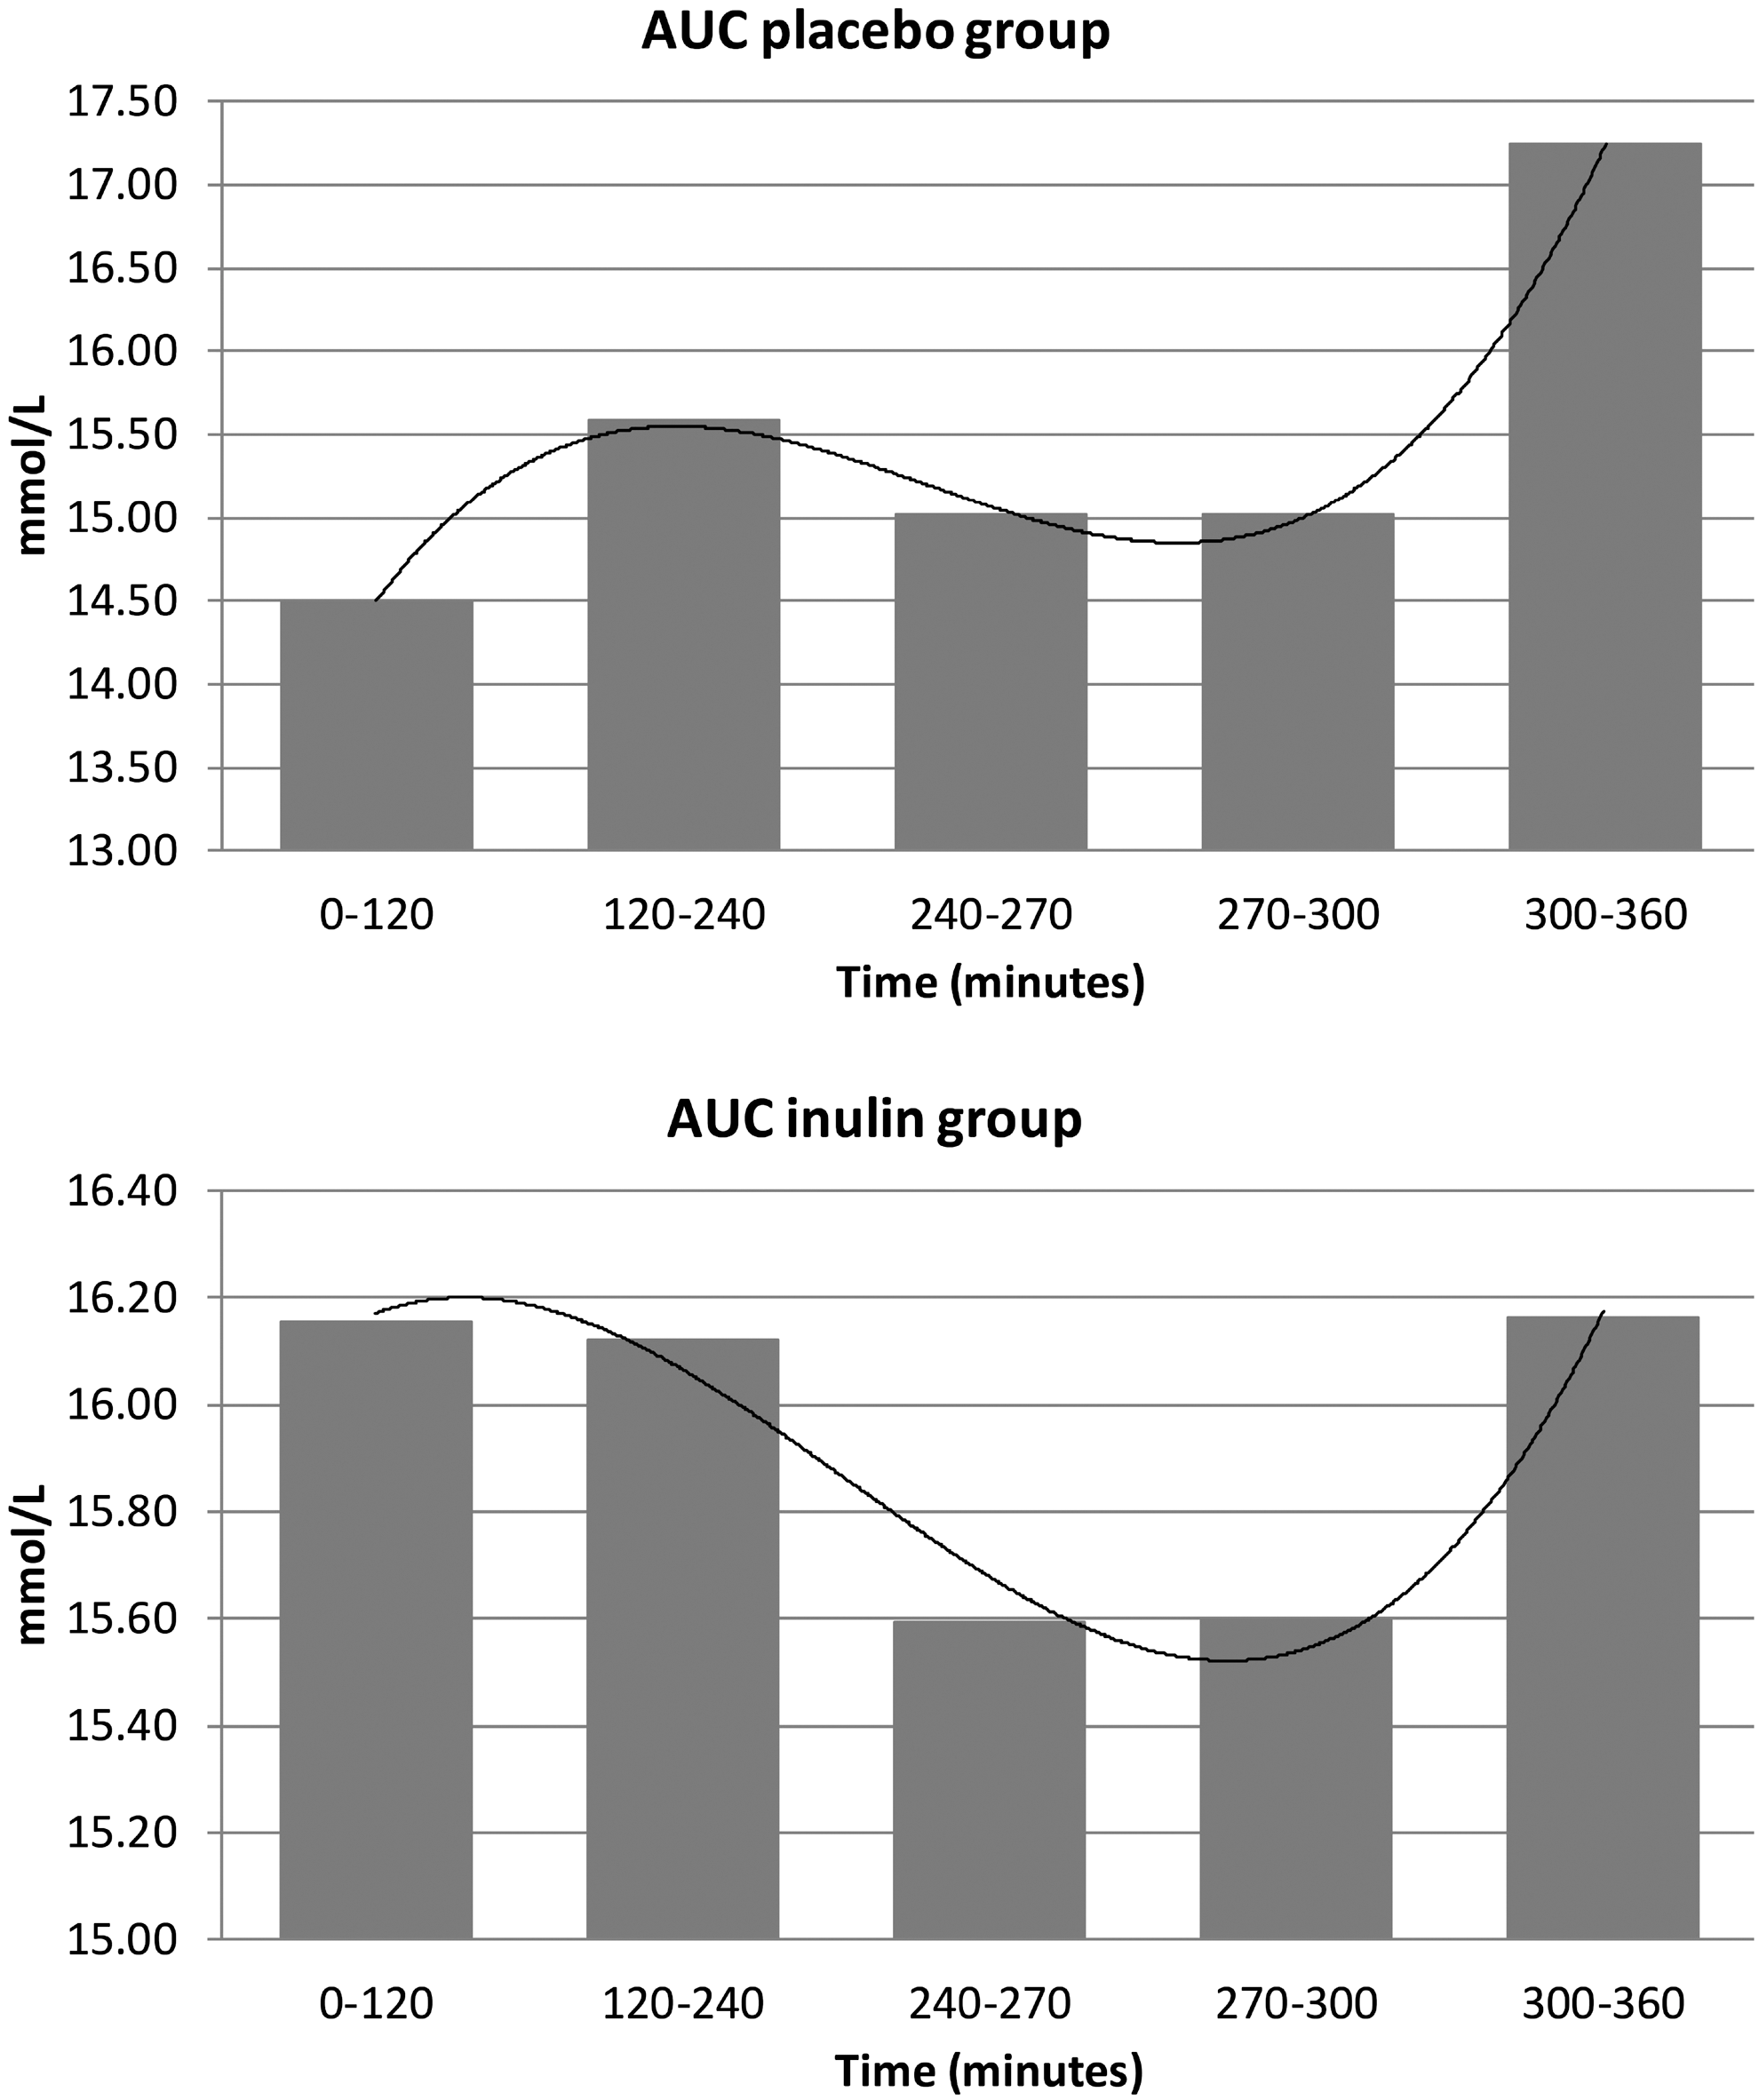
Ghrelin response and area under the curve (AUC) after administration of placebo or inulin test drinks. AUC inulin group: 8.13 mmol/L, and AUC placebo group: 7.85 mmol/L, P = .801.
Inulin has shown controversial results in experimental models and in humans on ghrelin concentration. 1,4,5 Several studies have suggested that ghrelin could play an important role in endocrine abnormalities present in obesity. 7 –9 Moreover, in healthy and lean individuals, ghrelin suppression has shown a dose dependent response to caloric content and macronutrient composition of a test meal. 1 Our results were inconsistent with these findings. These differences may be explained because a range between 220 and 1000 kcal decreases ghrelin concentration by 2.4% for every 100 kcal increase of energy intake. 1
In consequence, the fermentation of 24 g of inulin has a postprandial ghrelin suppressive effect around 500–600 kcal of nutrients absorbed in the small intestine. 1 Regarding the macronutrient composition of a meal, carbohydrates appear to be the most effective macronutrient for ghrelin suppression, protein induces prolonged ghrelin suppression, and fat shows an insufficient ghrelin suppressing capacity. 10 In our study, we used a macronutrient distribution, like that used in lean and healthy subjects. 1 This suggests that obese patients need more than 24 g of inulin, or the inulin dose needs to be calculated according to their weight, or the macronutrient distribution should be higher in protein and less in fat to show a ghrelin suppressive effect.
Furthermore, colonic fermentation of indigestible carbohydrates reduces ghrelin by colonic production of short chain fatty acids (SCFAs). 11 It has been suggested that SCFAs (mainly acetate and propionate) activate the GPR43 receptor expressed by L cells, which stimulates Peptide YY (PYY) release. 5,12 Obese patients have different microbiota, they show a decreased relative proportion of Bacteroidetes and an increase in the relative proportion of Firmicutes 13 in comparison with lean individuals, 14 this may lead to a decreased fermentation of indigestible carbohydrates. Also, obese patients show impairments in the ability of a mixed meal to suppress ghrelin 15 and stimulate PYY release. 16 This may help explain some of these controversial results.
Also, ghrelin plays an important role in the short- and long-term energy balance regulation. In the short term, ghrelin increases appetite, and in the long term, it plays an important role in body weight homeostasis. 17 However, further studies are needed to determine the long-term effects of inulin on postprandial ghrelin in obese patients.
There are some limitations in our study that must be considered. This is a physiological study, the primary outcome was ghrelin behavior concentration after inulin ingestion. Total ghrelin was measured; however, acylated ghrelin with the orexigenic effect was not. Ghrelin concentration is a surrogate variable. In this case, PYY, GLP-1, and SCFAs were not measured, and even though SCFA fermentation increases hydrogen production, 18 in our study we did not measure the production of fasting breath hydrogen. Another limitation is that we did not measure satiety by any visual analogue scale.
Despite these limitations, our study presents several advantages. There are some discrepancies that exist regarding the validity of different methods used to evaluate total ghrelin levels. Ghrelin concentration has been previously evaluated with commercial radioimmunoassay kits. Our results are supported by the use of validated techniques for measuring total ghrelin concentration with ELISA. Patients were divided into two different groups to have a higher statistical and methodological power. For the first time, we evaluated the effect of fructans from A. tequilana Weber inulin on ghrelin concentration. In addition, this acute study is an assessment of the effect of a single intake of A. tequilana Weber inulin on postprandial ghrelin concentration in obese patients.
In summary, our results show that a single dose of A. tequilana Weber inulin in obese patients did not suppress postprandial ghrelin concentration. These findings do not refute the possibility that ghrelin contributes to appetite control, but suggest a different ghrelin behavior in comparison with lean individuals. However, it is possible that the responses may vary with long-term inulin ingestion.
Footnotes
Acknowledgments
We thank Sandra Hernandez Gonzalez and Tonatiuh Gonzalez Heredia for their support in the activities of the study.
Author Disclosure Statement
No competing financial interests exist.