
Abstract
The comparative effects of glucose and fructose on appetite and specifically on hormones regulating appetite remain controversial, and the role of different types of sugars has not been investigated broadly. The aim of this study was to estimate the effect of raisins, a dried fruit rich in fructose, fibers, and phenolics, on hormones involved in the postprandial response. Ten healthy normal-weight subjects received in a crossover design 74 g raisins or 50 g glucose as reference food. Glucose, insulin, and appetite hormones were measured at time 0 and 60, 120, and 180 min after consumption. Glucose and insulin peaked significantly at 60 min in both trials with no difference in two trials. Gastric inhibitory peptide peaked significantly at 60 min in both trials and was found lower in raisin compared to glucose at 60 and 120 min postprandially. Ghrelin was lower in raisin compared to glucose at 120 and at 180 min postingestion. Ghrelin/obestatin ratio was lower at 120 min in raisin compared to glucose. No differences were reported for glucagon-like peptide-1, apelin, and obestatin in either trial. Raisin consumption could be favorable in terms of regulating appetite compared to refined sugars or glucose-based products in normal-weight healthy subjects.
Introduction
G
Ghrelin and obestatin are two gastrointestinal hormones obtained by posttranslational processing of a common precursor, preproghrelin. 8 Ghrelin is a 28-amino acid peptide identified in 1999 as a natural ligand of the growth hormone secretagogue receptor, 9 but has since been recognized as an appetite-stimulating hormone and a key component of the regulation of energy homeostasis. 10 –13 Ghrelin is modified with an eight-carbon fatty acid by the enzyme ghrelin-O-acyl-transferase to activate the growth hormone secretagogue receptor and to exhibit its orexigenic activity. 10,13 Despite the fact that ghrelin has been investigated after consumption of meals of different compositions, little is known about the influence of different kinds of sugars on ghrelin levels. 14
Obestatin is a 23-amino acid peptide, which is known as anorexigenic, although its effects on food intake are still controversial. Although in the original work of Zhang et al. 15 obestatin has been shown to suppress food intake and decrease gastric emptying after exogenous injection, subsequent studies in rodents and in humans have yielded controversial results. 16 –18 Yet, no data on the obestatin response to meals of different carbohydrates at a postprandial level exist.
Apelin is a recently described adipokine that exists in several forms, all originating from a common 77-amino-acid precursor, 19 but apelin-12 is the most active of these forms. 20 Data on mice have shown that its synthesis by adipocytes is stimulated by insulin 21 and many studies suggest a potential role in the regulation of food intake. 22 –24
The comparative effects of glucose and fructose on appetite and specifically on hormones regulating appetite remain controversial. To our knowledge, the role of different types of sugars has not been investigated broadly. Thus, the aim of the present study was to estimate the effect of a dried fruit versus glucose on GLP-1, GIP, ghrelin, obestatin, and apelin in healthy subjects of normal weight. Because raisins administered herein contain fibers and phenolics, the potential of these compounds to regulate hormones has been estimated.
Materials and Methods
Participants
The study protocol was approved by the Bioethics Committee of Harokopio University. All subjects provided written informed consent for the study and completed appropriate privacy authorization. Ten apparently healthy subjects were recruited to the present study. Inclusion criteria were no history of any chronic disease or recent use of antibiotics and other medication. During the screening visit, height was measured using a stadiometer (Seca Mode 220, Germany), whereas weight was determined in the fasting state early in the morning in light clothing using a balance scale (Tanita WB-110MA, Japan), such that body mass index (BMI) could be calculated.
Study design
Using the randomized crossover design, raisins and the reference food were fed in random order on separate occasions with a minimum of 3 days between each visit. Subjects were also asked to refrain from vigorous exercise the previous day of each visit. Before visit, subjects had fasted overnight for 10–12 h. On arrival at the clinical investigation unit, an intravenous cannula was inserted into a forearm vein and a baseline blood sample was taken. The subjects then consumed either 50 g of glucose diluted in a glass of water or a 74 g portion of raisins that was calculated to provide 50 g of available sugars. Subjects were instructed to chew raisins very well before swallowing. A glass of water was also provided to volunteers after raisin consumption to achieve alike volumes in both meals. The nutrient and dietary fiber content of raisins was based on the food label (Table 1).
Blood measurements
Vein blood samples were collected at baseline (immediately before ingestion of raisins or glucose solution) and at 60, 120, and 180 min postprandially. Timing started at the first bite of the raisins/sip of the glucose solution. Approximately 5 mL of whole blood was obtained each time, and serum and plasma were separated by centrifugation at 1800 g for 10 min at 4°C. Serum glucose was measured using a colorimetric method, according to the kit manufacturer's (BIOSIS) instructions. Human enzyme-linked immunosorbent assay (ELISA) kits were used to measure serum insulin (Accubind, Los Angeles, CA, USA), serum GLP-1, serum GIP (Millipore, Missouri, USA), serum apelin (Cloud-Clone Corp., USA), and plasma ghrelin (BioVendor, Germany). Serum obestatin was measured using an enzyme immunoassay (EIA) kit (RayBiotech, GA). The ghrelin/obestatin ratio was also calculated.
Statistical analysis
The Statistical Package for the Social Sciences (SPSS 21.0 for Windows, Chicago, Illinois) was used for all analyses. For all measures, descriptive statistics were calculated. Results are expressed as mean ± standard error of the mean. All variables were tested for normal distribution of data applying the Kolmogorov–Smirnov test. Differences between trials were tested applying analysis of variance (ANOVA) and differences in different time points in each trial with repeated-measures ANOVA. Level of significance was set at P < .05.
Results
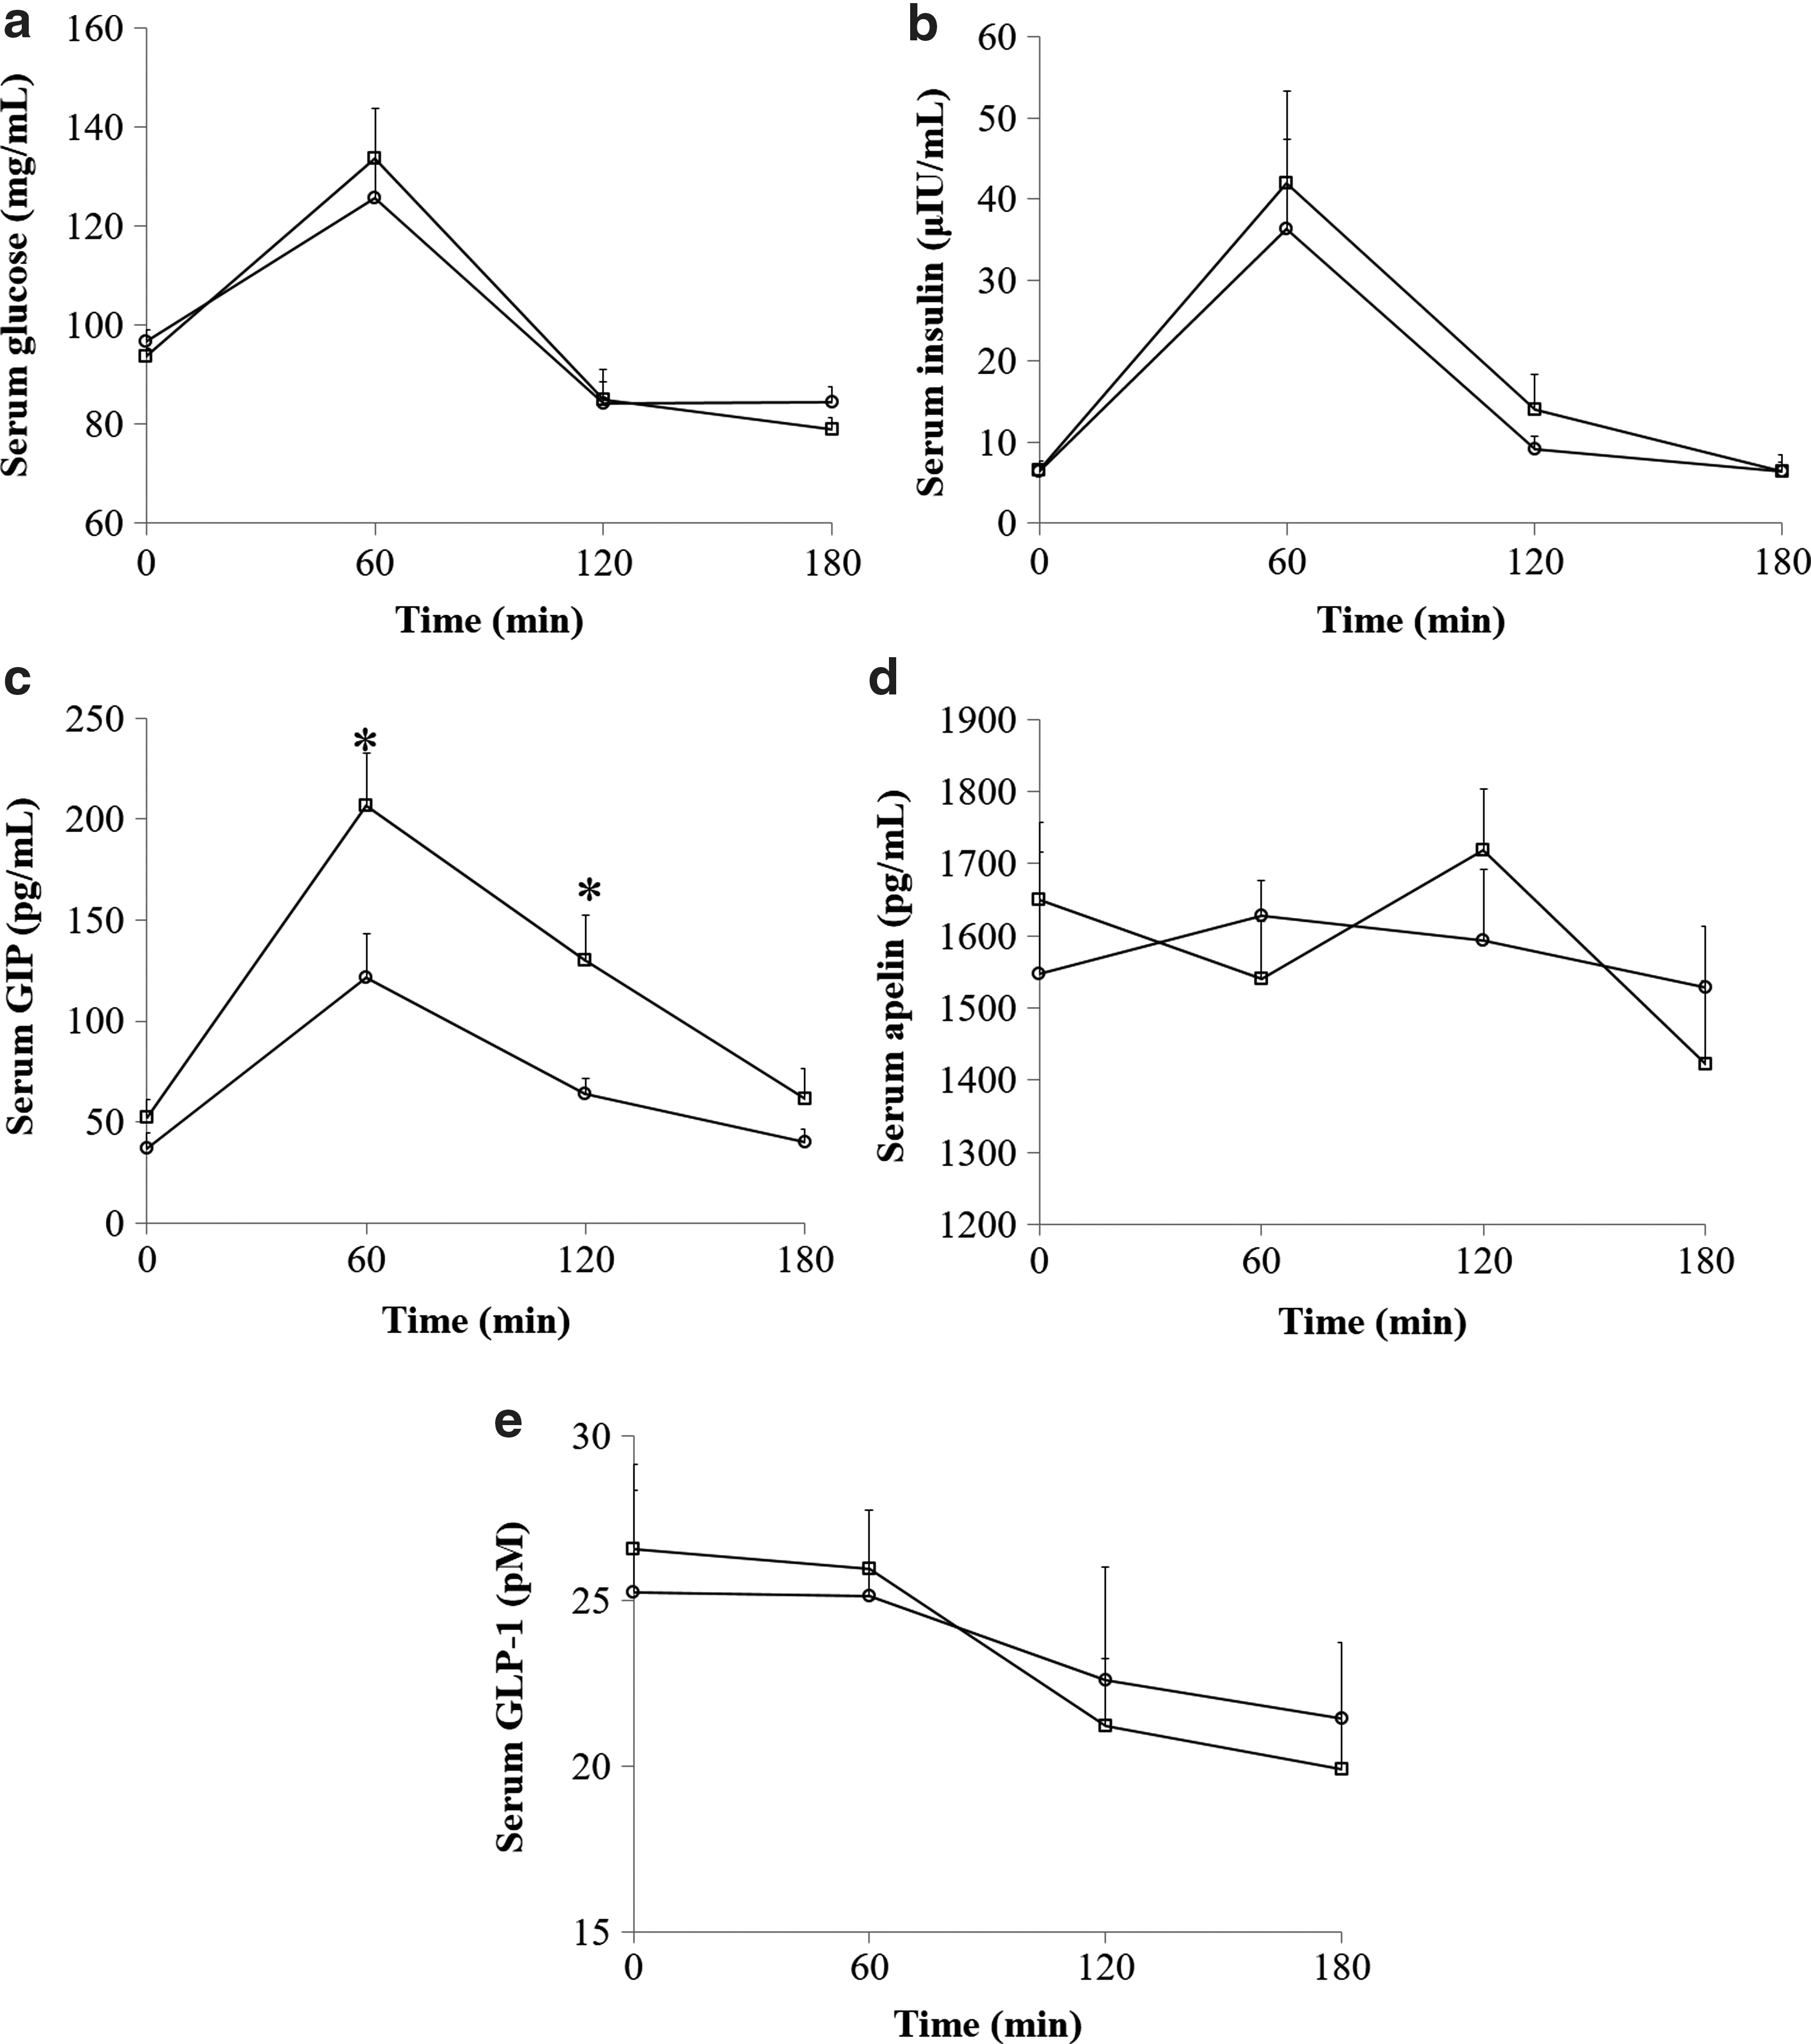
The subjects were of mean age 26.3 ± 0.8 years, with BMI of 21.6 ± 0.9 kg/m2, waist circumference of 77.7 ± 3.4 cm, normal serum lipidemic parameters, and normal HbA1c levels. Serum glucose and insulin peaked significantly at 60 min in both trials (Fig. 1a, b). However, glucose and insulin responses did not differ between raisin and glucose trial. Serum GIP also peaked significantly at 60 min after ingestion of both test and reference foods. GIP levels were found lower in raisin trial compared to glucose at 60 (121.7 ± 21.8 vs. 206.7 ± 25.8) and 120 min (63.9 ± 7.5 vs. 129.9 ± 22.5) postprandially (Fig. 1c). There was also a significant difference (P = .004) in the incremental area under the curve (iAUC) after raisin consumption compared to control. No differences were reported for apelin and GLP-1 levels in either trial (Fig. 1d, e).
Serum glucose
Furthermore, there was no significant difference in baseline plasma ghrelin levels between raisin and glucose. Plasma ghrelin reduced significantly at 60 min either in glucose or in raisin trial. Ghrelin levels were significantly lower after raisin consumption compared to glucose at 120 and at 180 min postingestion (193.9 ± 59.5 vs. 263.9 ± 51.6, P = .011 and 275.9 ± 65.5 vs. 347.7 ± 75.5, P = .035, respectively) (Fig. 2a). Serum obestatin did not differ at baseline between raisin and glucose. Obestatin peaked significantly at 120 min in both trials. However, it did not reach statistical significance between the two interventions (Fig. 2b). The ghrelin/obestatin ratio was found significantly lower at 120 min after raisin ingestion compared to glucose (1.5 ± 0.7 vs. 2.5 ± 0.8, P = .020) (Fig. 2c).

Plasma ghrelin
Discussion
Low postprandial GIP concentrations might be favorable, because several studies have indicated that GIP might be involved in the development of obesity due to its anabolic effects in adipose tissue, such as stimulation of fatty acid synthesis and incorporation of fatty acids into triglycerides. 25,26 Our results show that replacement of simple glucose with a dried fruit, that is raisins, may regulate GIP in healthy subjects of normal weight. This is in accordance with the findings of a previous study of Johnston et al. 27 This study aimed to investigate whether naturally occurring phenolic compounds in apple juice had any effects on plasma glucose concentrations and circulating gastrointestinal hormones in healthy volunteers. Plasma GIP concentrations were higher for the first 90 min after consumption of the control compared to both the clear apple juice (P < .005) and the cloudy apple juice (P < .05) that provided 25 g of glucose and 30.7 g of fructose. Furthermore, plasma GLP-1 levels were also higher for the first 90 min following the cloudy apple juice compared with both the control (P < .005) and the clear apple juice (P < .05); however, this is not the case herein. Phenolic content of apple juice (clear and cloudy), namely phloridzin and chlorogenic acids, has been shown to inhibit active sugar transport. Since GIP is secreted in response to the active absorption of glucose, 28 the reduced and delayed GIP responses to the beverages also indicate that there has been delayed glucose absorption after consumption of both apple juices compared with the control. In previous studies, phenolic content of raisins was calculated approximately at 190 mg 29 and vanillic acid, kaempferol, and quercetin were found as the main phenolic compounds. 30 Although in the study of Johnston et al. no information about the total phenolic content of apple juice is given to compare it with the phenolic content of raisins, the lower GIP levels after raisin consumption can also be attributed to delayed sugar absorption.
Another recent study of Wölnerhanssen et al. 31 examined GIP and GLP-1 levels after ingestion of glucose or fructose in healthy subjects. Its findings were also in accordance with our findings concerning GIP levels as glucose ingestion induced significantly greater elevations in plasma GIP concentrations compared to fructose. Although GLP-1 was unaffected in our study, in this study GLP-1 levels were found lower after fructose ingestion. It must be stated that in the study of Wölnerhanssen et al., the two meals were not isocaloric (75 g of glucose vs. 25 g of fructose) in contrast with our study, and probably this can explain this difference between them. Similarly, in the study of García-Rodríguez et al., 32 a carbohydrate constituent of a new fructose-free diabetes-specific formula with high content of resistant starch type IV, a mixture of soluble and insoluble fiber and high content of monounsaturated fatty acids (MUFAs), was compared to a glucose solution. GLP-1 and GIP AUC were significantly lower after intake of the carbohydrate constituent compared to glucose, due to the fiber content that leads to slower digestion and absorption by delaying gastric emptying and/or shortening the small intestinal transit time. In general, GLP-1 may promote satiation, however, it is not likely that it contributes to satiety as it rapidly declines after carbohydrate ingestion. 33
On the contrary, the study of Hoggard et al. 34 investigated the acute effect of a standardized bilberry extract on glucose metabolism and GIP and GLP-1 in diabetic patients and there was no difference in treatment for the iAUC for plasma GIP and GLP-1 or for any of the individual time points compared with placebo. In addition, in another study, 35 the satiating capacity of three beverages containing 3 g barley β-glucan, or 2.5 g dietary fiber (DF) from fruit, or without DF (control) was evaluated. No significant changes were observed postprandially for both GIP and GLP-1.
In addition, our study indicated that glucose and raisins had similar effect on postprandial glycemia and insulinemia. Raisins are dried vine fruits (Vitis vinifera L.) produced in several geographic regions in the world. Like fresh grapes, they contain fiber but no fat, saturated fat, or cholesterol, but they contain both fructose and glucose in approximately same percentage. The regulated glucose and insulin response to raisin supplementation 36 and the cardioprotective long-term effect in diabetic patients have been published to this moment. 37
On the contrary, most of the above-mentioned studies have shown differences in insulin levels. It is known that the consumption of slowly digestible products, although it does not always result in a low glycemic response, might have several beneficial effects. 38 Because glucose enters the circulation slower, less insulin is secreted to keep glucose concentrations beneath an acceptable limit, which also prevents a decrease in glucose concentrations beneath baseline and consequently an increased food intake. 39 This circle of the glucose-insulin-glucose response is associated with regulation of markers of inflammation and oxidative stress and decreased risk of the development of type 2 diabetes mellitus. 40,41 Herein, a possible, although nonsignificant, regulation of glucose levels at 180 min postprandially can be attributed to this circle of glucose-insulin-glucose (Fig. 1a).
Another important result of our study is the possible regulatory effect of raisin consumption on ghrelin levels in healthy subjects of normal weight, compared to glucose. On the contrary, no effect on obestatin was observed after either raisin or glucose intake.
Several studies have been conducted to examine ghrelin levels after consumption of meals of different macronutrients. Tannous dit El Khoury et al. 14 investigated the response of postprandial ghrelin to changes in macronutrient composition of three different meals (high carbohydrate, high fat, and high protein) in healthy adult males. As expected, the levels of ghrelin fell significantly following the three meals. The high-carbohydrate meal induced the most significant decrease in postprandial ghrelin secretion compared to the other two meals (P < .05). However, in a high-protein meal, at 180 min, ghrelin was maintained significantly lower compared to either the high-carbohydrate or high-fat meal (P < .01). These results were verified in a more recent study 42 where total ghrelin levels decreased significantly more after carbohydrate or protein ingestion than after lipids, while ghrelin's nadir levels were reached most rapidly after the carbohydrate-enriched preload. A high-fructose beverage has been shown to attenuate postprandial suppression of ghrelin compared to a high-glucose beverage in normal-weight subjects. 43 Yet, the above results were not repeated when the trial was conducted in obese subjects. 44 No differences in the AUCs for ghrelin were observed in the case of supplementation with high-fructose corn syrup or sucrose-sweetened beverages or beverages sweetened with fructose or glucose. 45
Other studies have focused on the effect of fiber content on ghrelin levels. In a recent study, when healthy subjects were asked to consume either dried plums or low-fat cookies or white bread as a reference food, ghrelin levels were lower (P < .05) in dried plum trial than in white bread at the 15- and 30-min time points. 46 Furthermore, there was a tendency (P = .056) toward a lower ghrelin area over the curve response during the dried plum trial compared to low-fat cookie trial. The portion of dried plums used for the current experiment provided 6 g of fibers, whereas the white bread and low-fat cookies contained 3 and 0 g of fiber, respectively. In our study, raisins consumed provided 5 g of fibers, while no fiber in glucose trial. Dietary fiber in both experiments may play a role in controlling blood glucose levels and increasing satiety, perhaps by slowing the gastric emptying rate and slowing absorption of macronutrients and/or increasing colonic fermentation, which results in a slower appearance of glucose into the blood stream. 47 The reduced ghrelin levels found herein after the intake of raisins demonstrate that fiber content in raisins delays rise in hunger feeling, as in the case of a novel product high in complex carbohydrates and fibers investigated by García-Rodríguez et al. 32
In addition, the effect of polyphenols has been investigated in the metabolic responses to products containing sugars. Although with several beneficial metabolic effects, maple syrup, rich in polyphenolic lignans, did not affect postprandial ghrelin levels in rats. 48
A previous study about the content of raisins in phenolics has shown that they are rich in a plethora of antioxidant compounds, mainly vanillic acid, kaempferol, and quercetin. 30 Therein, phenolic compounds were found to be absorbed and bioavailable in humans, the majority of the identified compounds peaked in circulation 60 min after ingestion. Thus, the decrease in plasma ghrelin levels 60 min after ingestion might be attributed to the concurrent increase in circulating phenolics in plasma. Puglisi et al. 49 indicated that raisin consumption, alone or combined with walking, for 6 weeks resulted in an increase in ghrelin levels postintervention. This paradoxical result could be explained only if it is hypothesized that subjects had reduced their food intake after 6-week intervention resulting in an increase in ghrelin levels. In our survey, the consumption of the two meals was acute and their effect on ghrelin levels could not be comparable. In accordance with the present, Gruendel et al. 50 examined a polyphenol-rich insoluble dietary fiber preparation from carob pulp (carob fiber) on postprandial ghrelin responses and found that after intake of this preparation, ghrelin concentrations decreased compared to control meal after 60 min (P < .001). Subjects consumed 5, 10, or 20 g of carob fiber that provided 142, 284, or 568 mg of total phenolics, respectively. Herein, the portion of 74 g of raisins provided 140 mg of total phenolics, which is comparable to the median dose of the carob fiber trial. These findings are in accordance with ours on ghrelin, indicative of a synergistic effect of dietary fiber and phenolics on postprandial ghrelin. However, in another study, ghrelin levels increased 24 h after consumption of carob fiber. 51
Regarding obestatin, herein, it remained unchanged after consumption of both raisins and glucose. Little data on the postprandial effect of different types of macronutrients in obestatin levels are published. Most of the studies have focused on the determination of obestatin at fasting in different groups. In the study of Qi et al., 52 obestatin levels were found lower in patients with impaired glucose regulation and type 2 diabetes mellitus compared to healthy subjects, implying that obestatin may play a role in appetite resolution in patients with type 2 diabetes mellitus. Huda et al. 53 examined the response of obestatin to a meal in three different groups (lean, obese, and gastrectomy group). Obestatin did not change significantly from baseline in response to the meal in all study groups but was significantly lower in morbidly obese subjects compared to lean subjects, supporting a possible role for obestatin in long-term body weight regulation.
The ghrelin/obestatin ratio has been investigated in several pathologies, including those linked to an unbalanced energy homeostasis and/or GH secretion. Our study is the first time where the ghrelin/obestatin ratio was investigated in normal-weight subjects after meals. Expectedly, within the first 60 min after individual meals, the ghrelin/obestatin ratio was reduced. However, a balance in appetite drive was observed in the raisin meal 1 h after intake and throughout the 3-h trial versus a significant increase in appetite in glucose trial.
One of the major strengths of the present study is that test meals were balanced for sugars and energy. Furthermore, all subjects (both males and females) were carefully selected to be healthy matched for age and BMI, while the study is the first evaluating obestatin at a postprandial state comparing different meals. However, this short duration does not allow extrapolating the results in a long-term daily consumption of raisins with regard to metabolic parameters, regulation in body weight and body composition. In conclusion, the results of the present study suggest that raisin consumption could be favorable in terms of regulating appetite compared to refined sugars or glucose-based products in normal-weight healthy subjects. In addition, since high postprandial GIP concentrations might be involved in obesity development, this GIP regulating effect of raisin consumption is of great attention and should be further examined.
Footnotes
Acknowledgment
The study was supported by IKY Fellowships of Excellence for Postgraduate Studies in Greece — Siemens Program.
Author Disclosure Statement
No competing financial interests exist.