
Abstract
The purpose of this study was to investigate the antiobesity effect of Sanguisorba officinalis L. (SOL) in 3T3-L1 adipocytes and obese C57BL/6J mice. SOL was extracted with water and 30%, 50%, 70%, and 100% ethanol (EtOH). 3T3-L1 adipocytes were treated with SOL extracts (100 μg/mL) during the differentiation period. Triglyceride (TG) accumulation was determined by Oil Red O staining, and the expression of adipocyte-specific proteins was measured by Western blot analysis. C57BL/6J mice were fed a high-fat diet to induce obesity and were orally administered SOL 50% ethanol extract (50, 100, and 200 mg/kg) for 8 weeks. Among the SOL extracts, the 50% EtOH extract considerably inhibited TG accumulation through the downregulation of PPARγ, C/EBPα, and SREBP-1c in 3T3-L1 adipocytes. In addition, the 50% ethanol extract reduced body weight and adipose tissue weight and improved serum lipid profiles through downregulation of PPARγ, C/EBPα, FABP4, and ACC and upregulation of adiponectin and CPT-1 in obese C57BL/6J mice fed a high-fat diet. These results suggested that the SOL 50% EtOH extract may have an antiobesity effect through the regulation of transcription factors related to adipogenesis, lipogenesis, and lipolysis.
Introduction
O
Drugs used to treat obesity include sibutramine and orlistat. 4 They are known as appetite suppressant and digestive inhibitor. 5,6 Sibutramine inhibits the reuptake of serotonin and norepinephrine, and orlistat blocks absorption of dietary fat by inhibiting a lipase. 5,6 However, they have side effects such as headache, xerostomia, insomnia, stomachache, diarrhea, and steatorrhoea. 7 Recently, interest in natural antiobesity substances is growing remarkably. 8 Various studies have reported that obesity can be improved by natural substances such as quercetin, rutin, catechin, and fucoidan. 9 –11
Adipogenesis is the process of cell differentiation in which preadipocytes become adipocytes and is controlled by adipogenic and lipogenic transcription factors such as CCAAT/enhancer-binding proteins (C/EBPs), peroxisome proliferator-activated receptor γ (PPARγ), and sterol regulatory element-binding protein 1c (SREBP-1c). 12,13 In the early phase of differentiation, the expressions of C/EBPβ and C/EBPδ increase, which induce the expression of PPARγ, and the expression of C/EBPα appears to depend on the PPARγ activity. 14,15 PPARγ and C/EBPα are master regulators of adipogenesis in vitro and in vivo for TG accumulation and promote adipocyte-specific genes such as perilipin, fatty acid-binding protein 4 (FABP4), and glucose transporter type 4 (GLUT4). 5,16 SREBP-1c is considered to be an important transcription factor of fatty acid and TG synthesis, is activated by insulin, and stimulates the expression of several lipogenic transcription factors, including ATP-citrate lyase (ACL), acetyl-CoA synthetase (ACS), acetyl-CoA carboxylase (ACC), fatty acid synthase (FAS), stearoyl-CoA desaturase-1 (SCD-1), and glycerol-3-phosphate acyltransferase (GPAT). 17,18
AMP-activated protein kinase (AMPK) is a major regulator of cellular and whole-body energy homeostasis that coordinates metabolic pathways to balance nutrient supply with energy demand. 19 It is now recognized that pharmacological activation of AMPK improves blood glucose homeostasis, lipid profile, and blood pressure in insulin-resistant rodents. 20,21 Thus, AMPK may be an important target for preventing and treating obesity. 22 Phosphorylated AMP-activated protein kinase (p-AMPK) promotes lipolysis by increasing carnitine palmitoyl transferase-1 (CPT-1), hormone-sensitive lipase, and uncoupling protein 2 (UCP-2), and suppresses lipogenesis by decreasing the expressions of ACC and FAS. 23,24 Adiponectin, a hormone derived in adipose tissue, has been shown to increase β-oxidation by the phosphorylation of AMPK. 25 CPT-1 is an enzyme that transports long-chain fatty acyl-CoA from the cytosol into the intermembrane space of mitochondria, and the generation of ATP is promoted by activation of CPT-1. 26,27 UCP-2 is a mitochondrial carrier protein, which decreases the generation of ATP through energy dissipation as heat. 28 ACC is an enzyme that synthesizes malonyl CoA from acetyl CoA, and FAS is an enzyme capable of de novo lipogenesis by promoting the conversion of acetyl CoA and malonyl CoA to palmitate. 26,29
Sanguisorba officinalis L. (SOL) is a perennial plant belonging to the Rosaceae family and grows wild in the hills and fields. 30 The height of the plant is 0.3–1.5 m, the rhizome grows lengthwise and sidewards, the stem grows straight, the leaves are a serrate oval shape, and it has the scent of cucumber. 31 The flowers are dark red and bloom from July to September, and the quadrangle fruits ripen in October. 32 Its young leaves are edible and the roots were used as a hemostatic agent. 33 According to previous studies, the ingredients of SOL are known to contain ellagic acid, gallic acid, catechin, and pomolic acid. 34 –36 Furthermore, SOL has exhibited various effects, including anti-inflammatory, antiallergic, and anti-cancer effects in previous studies. 37 –39 However, studies related to antiobesity effects are not reported yet.
In this study, we investigated the antiobesity effect of SOL in 3T3-L1 adipocytes by measuring the accumulation of TG and expression of adipogenesis and lipogenesis transcription factors. In addition, we examined the antiobesity effect of SOL in high-fat diet-induced obese C57BL/6J mice through measurements of body weight and adipose tissue weight, analysis of serum lipid profiles, and expressions of adipogenesis, lipogenesis, and lipolysis-related transcription factors.
Materials and Methods
Materials
SOL was purchased from the Gi-Dam herb garden located in Inje, Republic of Korea. The dried leaves and stems were extracted by boiling and reflux with water and 30%, 50%, 70%, and 100% ethanol (EtOH) for 3 h. The extracts were filtered, concentrated by a vacuum evaporator (Roravapor R-200; Buchi, Flawil, Switzerland), and freeze-dried (Bondiro; Il Shin Lab Co. Ltd., Seoul, Republic of Korea) to obtain powder. The extraction yield of SOL was 33.1% (water extract), 38.2% (30% ethanol extract), 35.2% (50% ethanol extract), 29.5% (70% ethanol extract), and 29.4% (100% ethanol extract).
Cell culture and differentiation
3T3-L1 preadipocytes (CL-173, American Type Culture Collection, Manassas, VA, USA) were seeded into 12-well plates at a density of 2 × 10⁵ cells/well and cultured in Dulbecco's modified Eagle's medium (DMEM, Lonza, Walkersville, MD, USA) containing 10% bovine serum (BS) (Gibco, Grand Island, NY, USA) and 1% penicillin–streptomycin (P/S) (Gibco) at 37°C in a humidified atmosphere of 5% CO2. To differentiate the cells, 2-day-postconfluent cells (day 0) were incubated for 2 days in the MDI medium (DMEM containing 10% fetal bovine serum (FBS) (Gibco), 1% P/S, 0.5 mM 3-isobutyl-1-methylxanthine (IBMX) (Sigma Aldrich, St. Louis, MO, USA), 1 μM dexamethasone (Dexa) (Sigma Aldrich), and 10 μg/mL insulin (Gibco) for 2 days. On day 2, the cells were incubated in the maintenance medium (DMEM containing 10% FBS, 1% P/S, and 10 μg/mL insulin) for 2 days. On day 4, the medium was changed to DMEM containing 10% FBS and 1% P/S every second day until day 8. During the differentiation period, the cells were treated with SOL extracts.
MTT assay
Cell viability was measured by the MTT assay. The 3T3-L1 preadipocytes were seeded into 24-well plates at a density of 5 × 10⁴ cells/well and cultured in DMEM containing 10% BS and 1% P/S at 37°C in a humidified atmosphere of 5% CO2. The SOL extracts (0, 100, 200, and 300 μg/mL) were added into 24-well plates and incubated for 24 h. Then, 2 mg/mL thiazolyl blue tetrazolium bromide (MTT) (Sigma Aldrich) reagent (200 μL) was added to each well. After 4 h, the formazan crystals were dissolved in dimethyl sulfoxide (DMSO) (Sigma Aldrich) and the absorbance was measured at 570 nm by UV-visible spectrometer (Multiskan FC; Thermo Fisher Scientific, Inc., Waltham, MA, USA). The cell viability (%) was obtained by comparing the samples with the control.
Oil Red O staining
Intracellular TG accumulation was measured using Oil Red O staining. The differentiated cells were washed with phosphate-buffered saline (PBS) (Lonza) and fixed in 4% formaldehyde at room temperature for 1 h. Then, the cells were washed with 60% isopropanol and stained with Oil Red O (Sigma Aldrich) solution (six parts of 0.6% Oil Red O dye in isopropanol and four parts of distilled water) at room temperature for 1 h. After staining, the cells were washed with tap water, the stained TG was observed by light microscopy (ECLIPSE TS100, Nikon, Tokyo, Japan), and the dyed Oil Red O was eluted with isopropanol. The absorbance was measured at 570 nm by UV-visible spectrometer, and TG accumulation (%) was obtained by comparing the samples with the MDI.
Western blot analysis in the cells
The differentiated cells were washed with PBS and lysed with PRO-PREP protein extraction solution (iNtRON Biotechnology, Seongnam, Korea). The lysates were centrifuged at 12,000 g for 30 min at 4°C, and the protein concentrations were determined using a BCA protein assay kit (Thermo Fisher Scientific, Inc.). The proteins were mixed with 2X sample buffer and heated for 5 min at 95°C before sodium dodecyl sulfate–polyacrylamide gel electrophoresis (SDS-PAGE), separated by 10% SDS-PAGE at 100 V for 90 min, and transferred to PVDF membrane (Merck Millipore, Billerica, MA, USA) at 350 mA for 90 min. The membranes were blocked with 5% skim milk in 1X TBST at room temperature for 1 h and incubated overnight with primary antibody at 4°C. Then, the membranes were washed five times with 1X TBST every 10 min, incubated with secondary antibody conjugated to horseradish peroxidase at room temperature for 1 h, and washed five times with 1 × TBST every 10 min. The specific protein bands were visualized on an X-ray film activated by chemiluminescence using ECL reagent. The primary antibodies specific for β-actin, PPARγ, C/EBPα, and SREBP-1c, and the secondary antibodies were obtained from Cell Signaling Technology (Danvers, MA, USA) and Santa Cruz Biotechnology (Dallas, TX, USA).
Animal experiment
Five-week-old male C57BL/6J mice were purchased from Central Laboratory Animal Incorporated (Seoul, Korea). The diets were normal diet (ND; 10% kcal fat; Research Diets, Inc., New Brunswick, NJ, USA) and high-fat diet (HFD; 60% kcal fat; Research Diet, Inc.), and obesity was induced in the mice by a high-fat diet for 2 weeks. The animals were housed in a controlled environment of 24°C ± 5°C and a relative humidity of 55% ± 5% with a 12-h light/12-h dark cycle. After 2 weeks, the mice were randomly divided into six groups: the nonobesity group (ND; n = 12), obesity group (HFD; n = 12), three groups of mice were orally treated with SOL 50% EtOH extract at concentrations of 50, 100, and 200 mg/kg/day (HFD+S50, HFD+S100, and HFD+S200; n = 12, respectively), and one group of mice was orally treated with Garcinia cambogia (GC) water extract at a concentration of 100 mg/kg/day (HFD+G100; n = 12). GC, which is already known to reduce body fat, was used as a positive control in this study. 40 The extracts of SOL and GC were dissolved in normal saline solution and orally administered once a day for 8 weeks. The mice were allowed ad libitum intake of food and water. The body weights and energy intakes were measured weekly. At the end of the experimental period, the mice were anesthetized with 2,2,2-tribromoethanol (Sigma Aldrich) and 2-methyl-2-buthanol (Sigma Aldrich) after a 12-h fasting. Blood was collected into a serum separation tube and centrifuged at 2000 g for 20 min (centrifuge 5424R; Eppendorf, Hamburg, Germany) and the sera were stored at −70°C until they were analyzed. In addition, the liver, kidney, and epididymal adipose tissue were dissected and weighed. The epididymal adipose tissues were stored at −70°C until they were analyzed. All experimental procedures involving animals were performed in accordance with a protocol that was approved by the Institutional Animal Care and Use Committee (IACUC) of Hallym University (Approval No. Hallym 2014-91).
Serum biochemistry analysis
The aspartate aminotransferase (AST), alanine aminotransferase (ALT), TG, total cholesterol (TC), high-density lipoprotein cholesterol (HDL-C), low-density lipoprotein cholesterol (LDL-C), and glucose (GLU) levels in serum were measured enzymatically using a clinical chemistry analyzer (Konelab 20XT; Thermo Fisher Scientific, Inc.).
Histological analysis
The adipose tissue was fixed in 4% paraformaldehyde, dehydrated with a graded series of ethanol solutions by a tissue processor (TP1020; Leica Biosystems, Nussloch, Germany), and embedded in paraffin (Tissue Embedding Center EG1150; Leica Biosystems). The paraffin blocks were cut to 5 μm thickness (Rotary Microtome RM2255; Leica Biosystems) and the sections were stained with hematoxylin and eosin (H&E). Then, the stained adipose tissue was observed by optical microscopy (ECLIPSE Ni-U; Nikon).
Western blot analysis in the animals
The epididymal adipose tissues were homogenized in PRO-PREP protein extraction solution. The lysates were centrifuged at 12,000 g for 30 min at 4°C and the protein concentrations were determined using a BCA protein assay kit. The proteins were mixed with 2 × sample buffer, heated for 5 min at 95°C before SDS-PAGE, separated by 10% SDS-PAGE at 100 V for 90 min, and transferred to PVDF membrane at 350 mA for 90 min. The membranes were blocked with 5% skim milk in 1 × TBST at room temperature for 1 h and incubated overnight with primary antibody at 4°C. Then, the membranes were washed five times with 1 × TBST every 10 min, incubated with secondary antibody conjugated to horseradish peroxidase at room temperature for 1 h, and washed five times with 1X TBST every 10 min. The specific protein bands were visualized on an X-ray film activated by chemiluminescence using ECL reagent. The primary antibodies specific for adiponectin, FABP4, ACC, and CPT-1 and the secondary antibodies were obtained from Cell Signaling Technology and Santa Cruz Biotechnology.
Statistical analysis
The results are expressed as the mean ± standard deviation of triplicate experiments. An analysis of variance and Duncan's multiple range tests were used to determine the significance of differences among means, and P < .05 was considered to be statistically significant.
Results
Cell viability in 3T3-L1 preadipocytes
To measure the cell viability of SOL extracts, the MTT assay was used to evaluate the 3T3-L1 preadipocytes. The cells were treated with SOL extracts at various concentrations (0, 100, 200, and 300 μg/mL) for 24 h. The SOL extracts were confirmed to have no significant cytotoxicity up to 300 μg/mL compared with the control (Fig. 1). Therefore, we used these extracts at a concentration of 100 μg/mL in the following experiments.
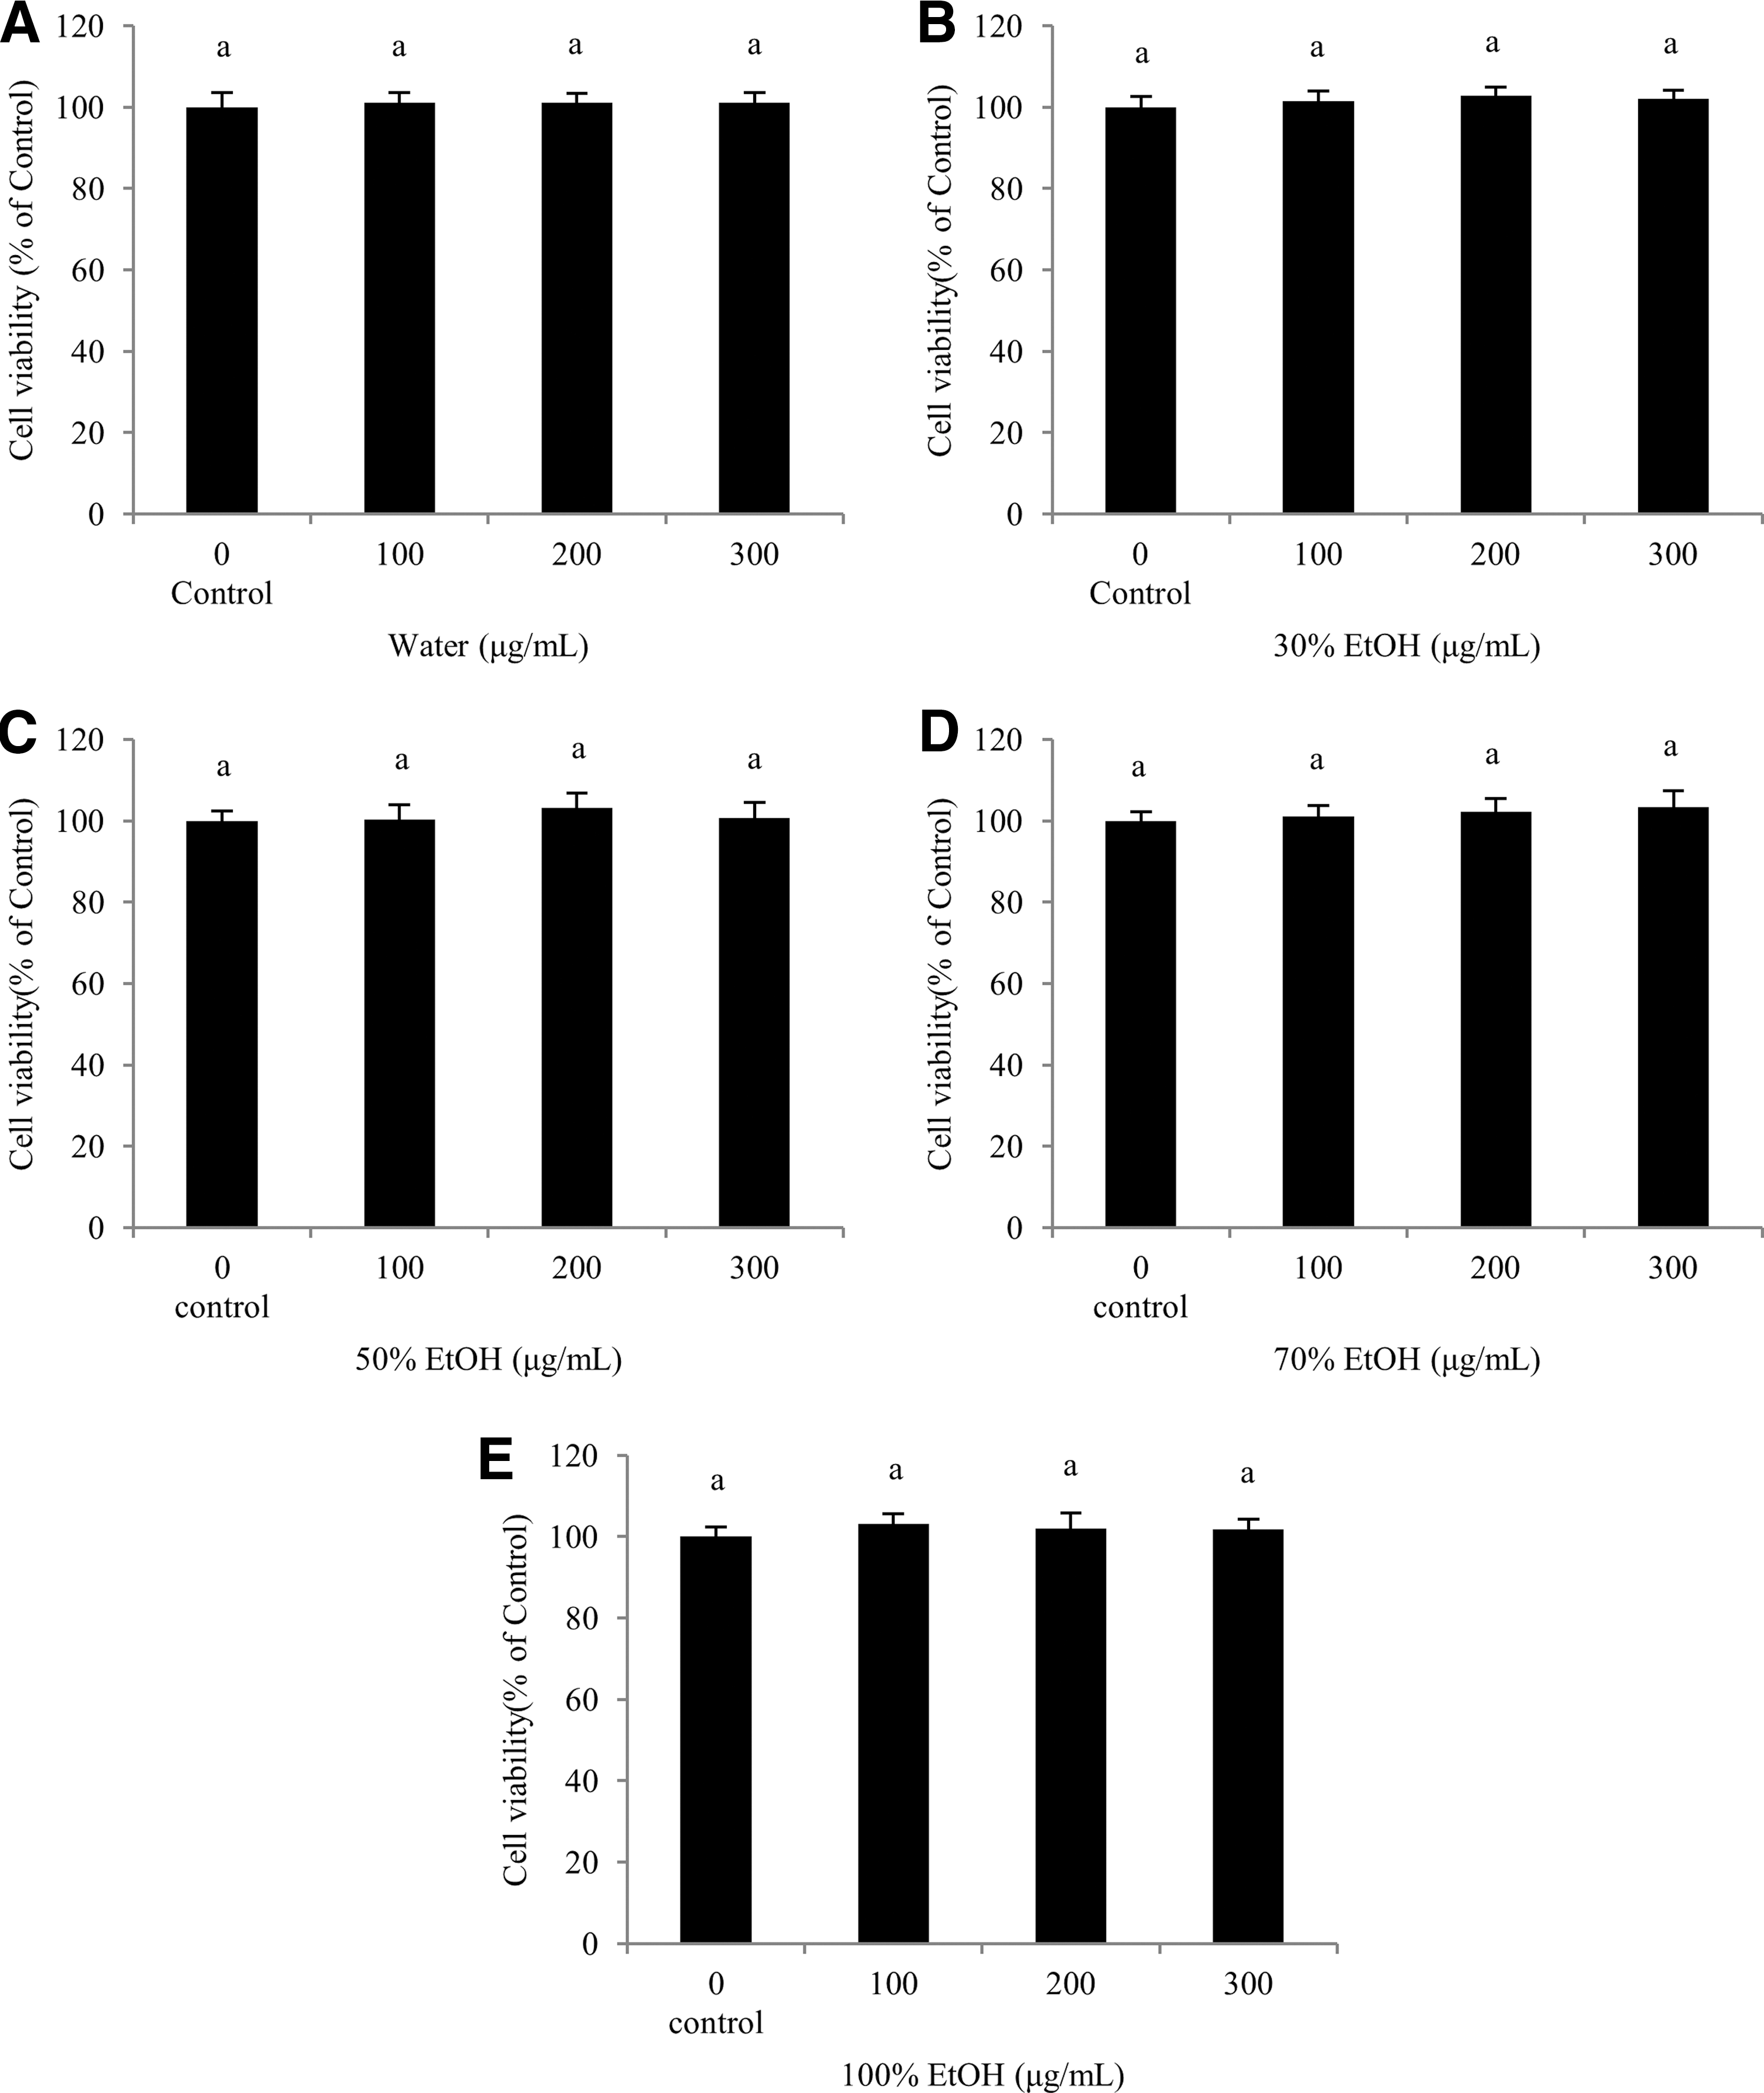
Effects of Sanguisorba officinalis L. on cell viability of 3T3-L1 preadipocytes. The 3T3-L1 preadipocytes were treated with SOL
TG accumulation in 3T3-L1 adipocytes
To identify whether SOL extracts inhibit differentiation of preadipocytes into adipocytes, 3T3-L1 preadipocytes were differentiated using MDI mixtures (0.5 mM IBMX, 1 μM Dexa, and 10 μg/mL insulin) and treated with or without SOL extracts (water and 30%, 50%, 70%, and 100% EtOH) at 100 μg/mL for 8 days. Oil Red O staining was used to measure the quantity of TG during the adipogenesis period. Control preadipocytes were not treated with the MDI inducing substance and few lipid droplets were observed. In contrast, in the MDI-induced preadipocytes, many lipid droplets were observed. As shown in Figure 2, both 50% and 70% EtOH extract from SOL decreased the TG accumulation in adipocytes, and this decrease was ∼78.13% ± 1.69% and ∼88.90% ± 2.66% at 100 μg/mL, respectively. They inhibited each about 20% and 10% compared with MDI. The other extracts stimulated the accumulation of TG rather than MDI. These results suggested that the inhibition effects of adipogenesis are superior in the SOL 50% EtOH extract.
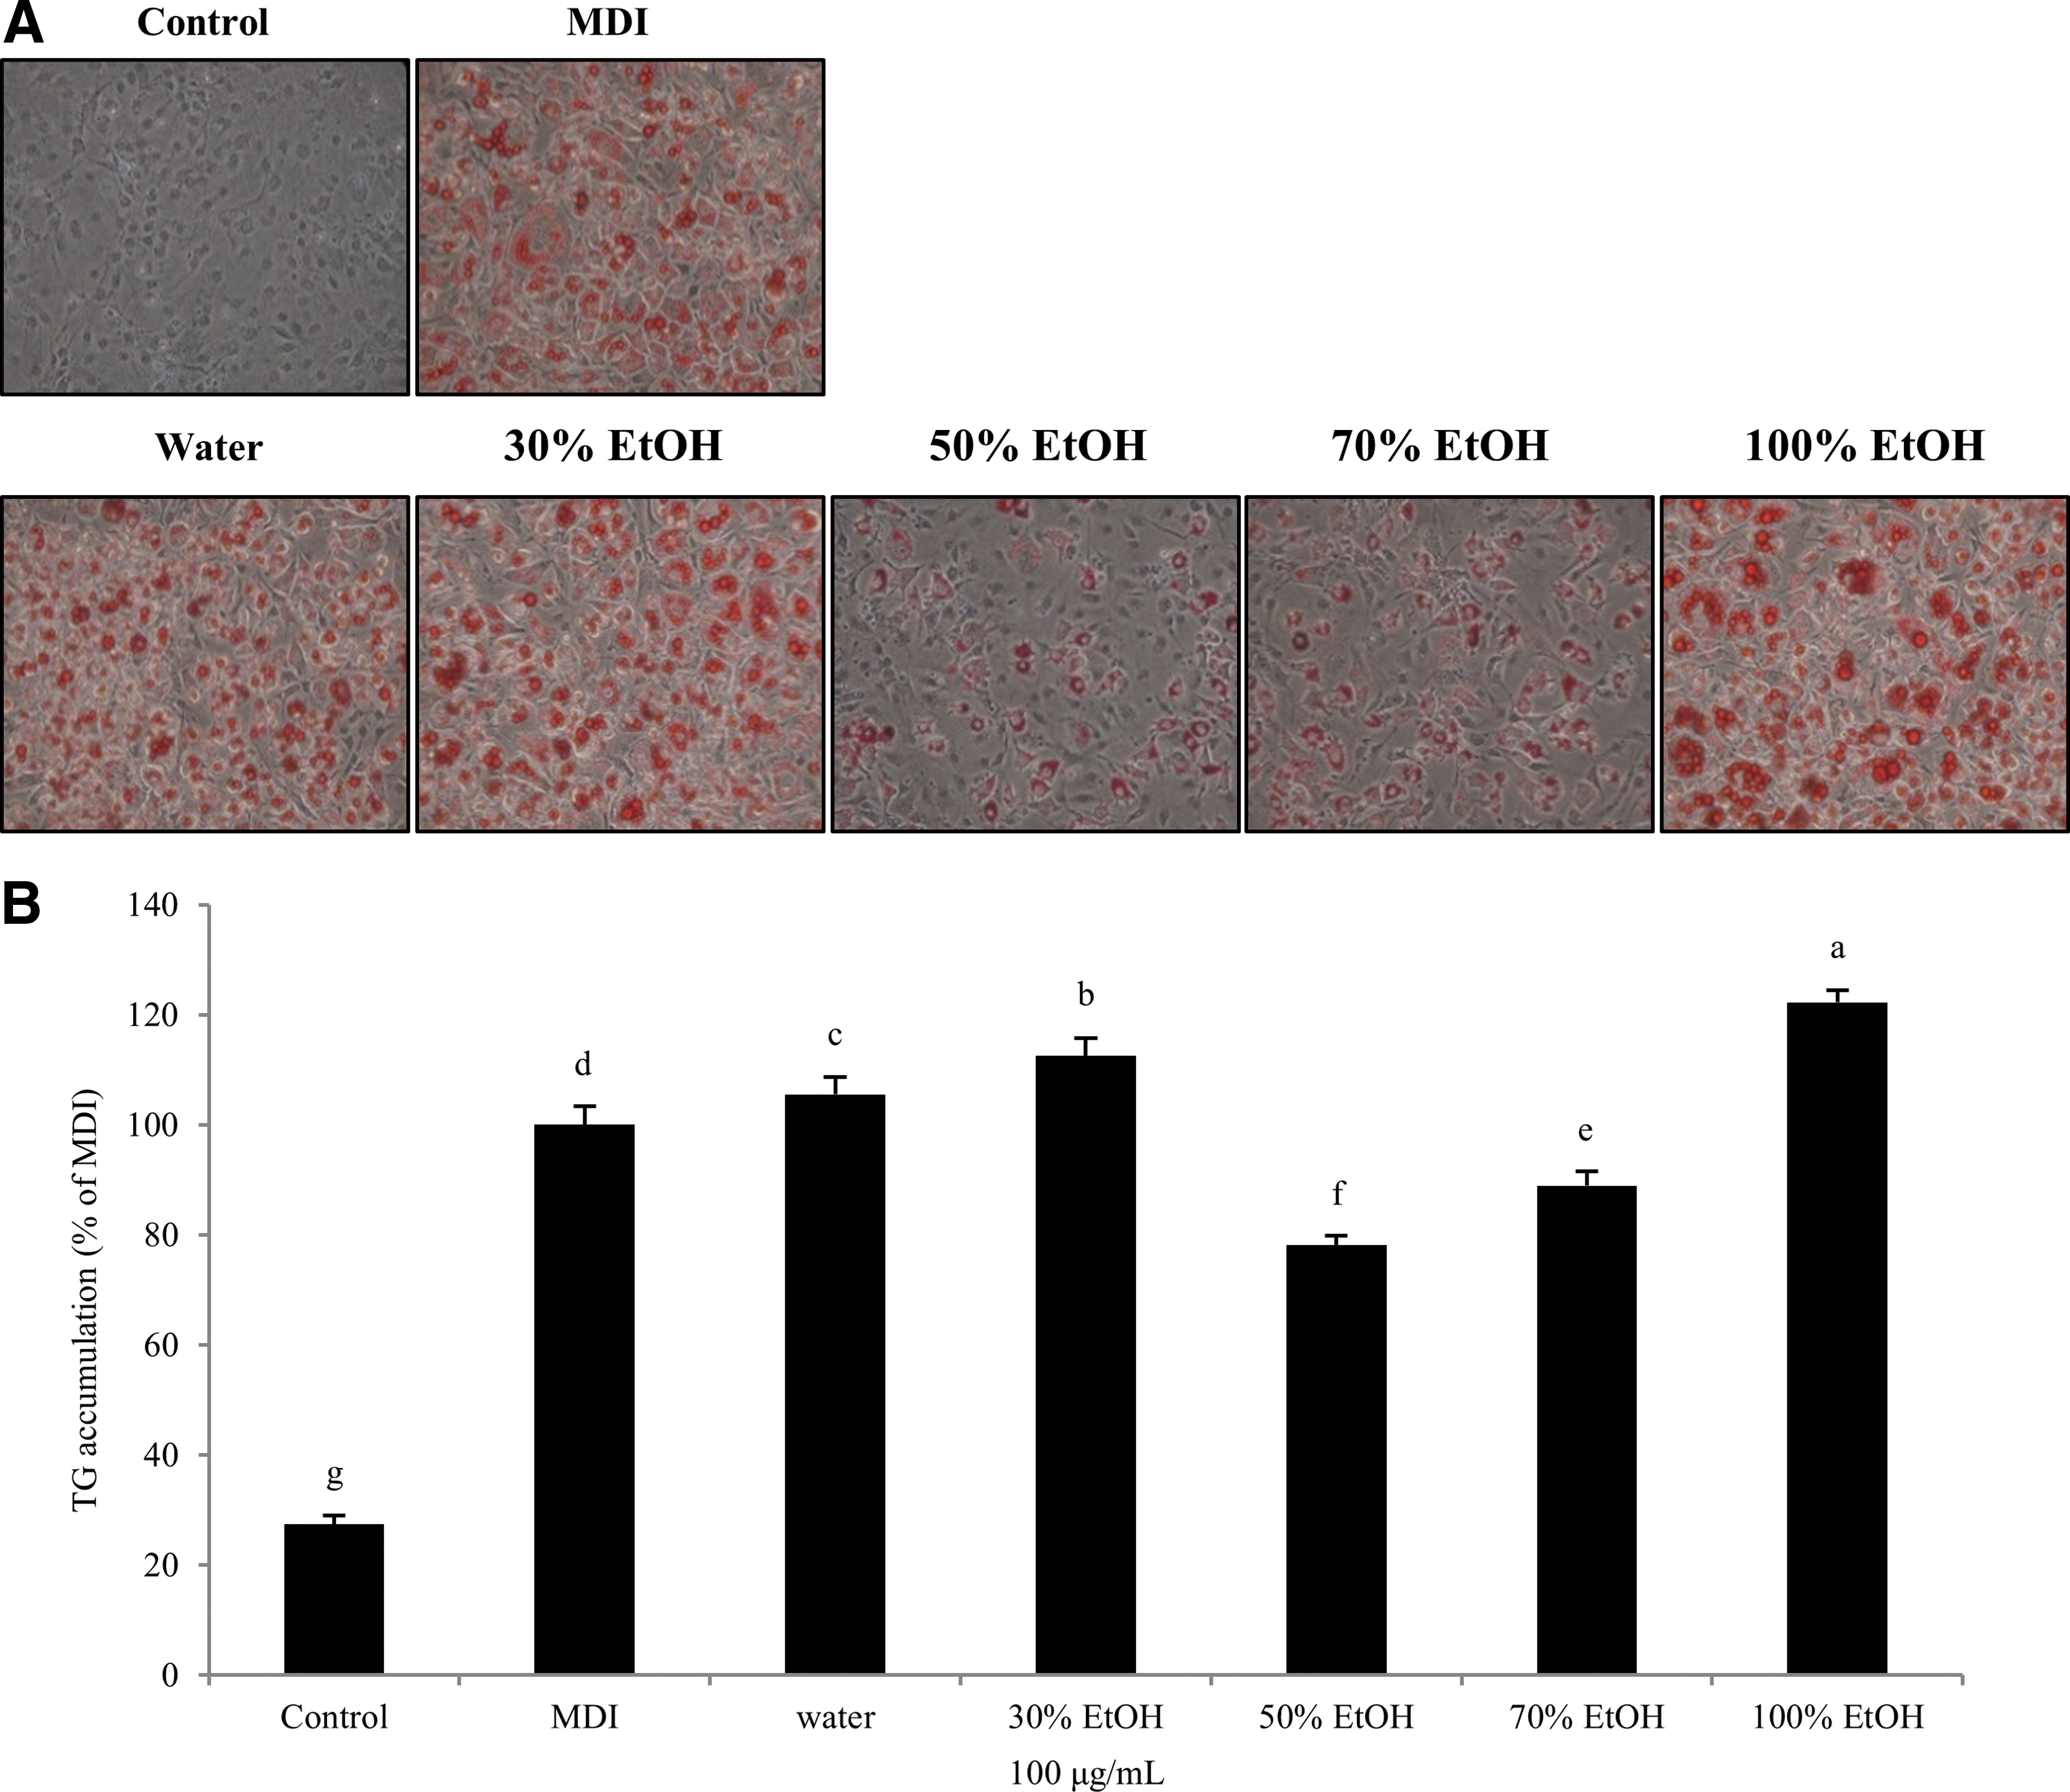
Effects of Sanguisorba officinalis L. on TG accumulation in 3T3-L1 adipocytes.
Expression of adipogenesis and lipogenesis transcription factors in 3T3-L1 adipocytes
C/EBPβ and C/EBPδ are the first transcription factors that appear during differentiation by MDI mixture, and they accelerate adipogenesis by inducing PPARγ and C/EBPα. 41 In addition, PPARγ and C/EBPα induce adipocyte-specific genes such as FABP4 and GLUT4. 42 To confirm whether the decrease of lipid droplets is due to downregulation of adipogenesis and lipogenesis related to transcription factors such as the PPARγ, C/EBPα, and SREBP-1c, we conducted Western blot analysis of proteins of the 3T3-L1 adipocytes. As shown in Figure 3, MDI increased the protein levels of PPARγ, C/EBPα, and SREBP-1c in comparison with the control. When the SOL extracts were treated at a concentration of 100 μg/mL, 50% and 70% EtOH extracts decreased the expression of PPARγ, C/EBPα, and SREBP-1c in comparison with the MDI. The other extracts increased the expression more than the MDI. These results demonstrated that 50% EtOH extract inhibits TG accumulation through downregulation of PPARγ, C/EBPα, and SREBP-1c.

Effects of Sanguisorba officinalis L. on the expression levels of adipocyte-specific transcription factors in 3T3-L1 adipocytes. The protein expression levels of adipocyte-specific transcription factors were measured using Western blot analysis.
Body weight and calorie intakes in high-fat diet-induced obese C57BL/6J mice
Based on the results of the in vitro experiment, we tested the SOL 50% EtOH extract in vivo. To examine the effect on body fat, we used obese C57BL/6J mice fed a high-fat diet. The body weight gain and calorie intakes of the mice are shown in Table 1. The body weight of the HFD+S200 and HFD+G100 groups were significantly lower compared with that of HFD group from the third week, and the body weight of the HFD+S200 and HFD+G100 groups were significantly lower compared with that of HFD group from the fifth week. The significance of body weight differences was maintained until 10 weeks, and the body weights of the HFD+S200 and HFD+G100 groups increased the least among the mice fed a high-fat diet. The body weight gains of the HFD group were considerably higher than those of the ND group, which indicates a high-fat diet-induced obesity. In addition, the body weight gains were lower in the HFD+S50, HFD+S100, HFD+S200, and HFD+G100 groups than the HFD group, and the maximum effect was observed in the HFD+S200 and HFD+G100 groups among the mice fed a high-fat diet. Furthermore, the energy intakes were not different in all of the groups except for the ND group. Therefore, we demonstrated that SOL 50% EtOH extract lowers body weight gain.
Each value is expressed as the mean ± SD (n = 12).
Values with different superscripts are significantly different at P < .05.
ND: mice were fed a normal diet (10% kcal fat); HFD: mice were fed a high-fat diet (60% kcal fat); HFD+S50: mice were fed a high-fat diet and orally treated with SOL 50% EtOH extract at a concentration of 50 mg/kg/day; HFD+S100: mice were fed a high-fat diet and orally treated with SOL 50% EtOH extract at a concentration of 100 mg/kg/day; HFD+S200: mice were fed a high-fat diet and orally treated with SOL 50% EtOH extract at a concentration of 200 mg/kg/day; HFD+G100: mice were fed a high-fat diet and orally treated with GC water extract at a concentration of 100 mg/kg/day.
Relative weight of liver, kidney, and epididymal adipose tissue and histological analysis of adipose tissue in high-fat diet-induced obese C57BL/6J mice
To verify whether the reduced body weight was associated with adipose tissue weight and adipocyte size, we measured the weight of tissue, and stained adipose tissue using H&E, from the obese C57BL/6J mice fed a high-fat diet. As shown in Table 2, the relative weights of liver and kidney were not significant among the mice fed a high-fat diet, suggesting that there is no abnormality after administration of the extracts. The relative weight of epididymal adipose tissue was higher in the HFD group than the ND group. Moreover, the weights of epididymal adipose tissue were significantly lower in the HFD+S50, HFD+S100, HFD+S200, and HFD+G100 groups, and the HFD+S200 and HFD+G100 groups showed the lowest amount of adipose tissue.
Each value is expressed as the mean ± SD (n = 12).
Values with different superscripts are significantly different at P < .05.
ND: mice were fed a normal diet (10% kcal fat); HFD: mice were fed a high-fat diet (60% kcal fat); HFD+S50: mice were fed a high-fat diet and orally treated with SOL 50% EtOH extract at a concentration of 50 mg/kg/day; HFD+S100: mice were fed a high-fat diet and orally treated with SOL 50% EtOH extract at a concentration of 100 mg/kg/day; HFD+S200: mice were fed a high-fat diet and orally treated with SOL 50% EtOH extract at a concentration of 200 mg/kg/day; HFD+G100: mice were fed a high-fat diet and orally treated with GC water extract at a concentration of 100 mg/kg/day.
Histological analysis of epididymal adipose tissue is shown in Figure 4. The size of adipocytes was larger in the HFD group compared to the ND group. Furthermore, the size of adipocytes was smaller in the HFD+S50, HFD+S100, HFD+S200, and HFD+G100 groups compared to the HFD group, and the HFD+S200 and HFD+G100 groups showed the smallest size of adipocytes, except for the ND group. Ultimately, we concluded that the SOL 50% EtOH extract decreases adipose tissue weight and adipocyte size, and these effects lead to a reduction of body weight.

Effects of Sanguisorba officinalis L. on the size of adipocytes in high-fat diet-induced obese C57BL/6J mice. The sections of epididymal adipose tissue were stained with hematoxylin and eosin and observed under a microscope at a magnification of 200 × . ND: mice were fed a normal diet (10% kcal fat); HFD: mice were fed a high-fat diet (60% kcal fat); HFD+S50: mice were fed a high-fat diet and orally treated with SOL 50% EtOH extract at a concentration of 50 mg/kg/day; HFD+S100: mice were fed a high-fat diet and orally treated with SOL 50% EtOH extract at a concentration of 100 mg/kg/day; HFD+S200: mice were fed a high-fat diet and orally treated with SOL 50% EtOH extract at a concentration of 200 mg/kg/day; HFD+G100: mice were fed a high-fat diet and orally treated with GC water extract at a concentration of 100 mg/kg/day. Color images available online at
Serum biochemical analysis in high-fat diet-induced obese C57BL/6J mice
To evaluate the effect of SOL 50% EtOH extract on hepatotoxicity and blood lipids in obese C57BL/6J mice fed a high-fat diet, we measured serum liver enzyme levels such as AST and ALT and serum lipid profiles such as TG, TC, HDL-C, LDL-C, and GLU. According to Table 3, the HFD group showed significantly higher levels of AST and ALT than the ND group, and the other groups were not significantly different in comparison with the HFD group. The oral administration did not influence the toxicity indicators for 8 weeks. For the blood lipid levels, the TG, TC, HDL-C, LDL-C, and GLU were significantly higher in the HFD group than the ND group. The levels of TG, TC, LDL-C, and GLU in the HFD+S50, HFD+S100, HFD+S200, and HFD+G100 groups were relatively decreased compared to HFD, whereas the level of HDL-C was not significant among mice fed a high-fat diet. The improvements in lipid levels were superior in the HFD+S200 and HFD+G100 groups, and oral administration of SOL 50% EtOH extract did not influence the level of HDL-C. We concluded that the level of TC was not affected by the level of HDL-C, but by the level of LDL-C in the significance test, and SOL 50% EtOH extracts resulted in the most improvement in serum lipid profiles.
Each value is expressed as the mean ± SD (n = 12).
Values with different superscripts are significantly different at P < .05.
ND: mice were fed a normal diet (10% kcal fat); HFD: mice were fed a high-fat diet (60% kcal fat); HFD+S50: mice were fed a high-fat diet and orally treated with SOL 50% EtOH extract at a concentration of 50 mg/kg/day; HFD+S100: mice were fed a high-fat diet and orally treated with SOL 50% EtOH extract at a concentration of 100 mg/kg/day; HFD+S200: mice were fed a high-fat diet and orally treated with SOL 50% EtOH extract at a concentration of 200 mg/kg/day; HFD+G100: mice were fed a high-fat diet and orally treated with GC water extract at a concentration of 100 mg/kg/day.
AST, aspartate aminotransferase; ALT, alanine aminotransferase; TC, total cholesterol; HDL-C, high-density lipoprotein cholesterol; LDL-C, low-density lipoprotein cholesterol; TG, triglyceride; GLU, glucose.
Expression of adipogenesis, lipogenesis, and lipolysis transcription factors in high-fat diet-induced obese C57BL/6J mice
To verify whether SOL 50% EtOH extract affects the protein expression of adipogenesis (PPARγ, C/EBPα, and FABP4), lipogenesis (ACC), and lipolysis (adiponectin, CPT-1)-related genes, we conducted Western blot analysis from protein of epididymal adipose tissues of obese C57BL/6J mice fed a high-fat diet. As shown in Figure 5, the HFD group showed that the protein levels of PPARγ, C/EBPα, FABP4, and ACC increased, whereas the protein levels of adiponectin and CPT-1 decreased more than the ND group. The HFD+S50, HFD+S100, HFD+S200, and HFD+G100 groups exhibited significantly decreased expression of PPARγ, C/EBPα, FABP4, and ACC and increased expression of adiponectin and CPT-1 compared to the HFD group. The expression of adipogenesis, lipogenesis, and lipolysis-related transcription factors was the lowest in the HFD+S200 and HFD+G100 groups. These results demonstrated that the 50% EtOH extract reduces body weight and adipose tissue weight and improves serum lipid profiles through downregulation of PPARγ, C/EBPα, FABP4, and ACC and upregulation of adiponectin and CPT-1.

Effects of Sanguisorba officinalis L. on the expression level of adipogenic, lipogenic, and lipolytic transcription factors in high-fat diet-induced obese C57BL/6J mice.
Discussion
Recently, many studies have concentrated on the prevention and treatment of obesity for accomplishing a healthy life because of the increasing prevalence of obesity and obesity-related diseases. 43 Therefore, this study investigated natural substances that have antiobesity effects without side effects.
Adipogenesis is accompanied by sequential expression and activation of adipogenic and lipogenic transcription factors. 44 PPARγ and C/EBPα increased the expression of FABP4 and GLUT4, and SREBP-1c increases the expression of FAS, ACC, and SCD-1. 42,45 Several studies have suggested that the activation of AMPK can inhibit adipogenesis by decreasing the expression of transcription factors such as PPARγ, C/EBPα, and SREBP-1c. 46 Also, activation of AMPK promotes fatty acid β-oxidation and hinders fatty acid synthesis by inactivation of ACC and increase of CPT-1 activity. 47
In this study, we evaluated the antiobesity effects of SOL using 3T3-L1 adipocytes and high-fat diet-induced obese C57BL/6J mice. The 3T3-L1 preadipocytes were differentiated using MDI mixtures and then treated with SOL extracts (water and 30%, 50%, 70%, and 100% EtOH) at a concentration of 100 μg/mL for 8 weeks. The SOL 50% EtOH extract effectively suppressed TG accumulation and expression of PPARγ, C/EBPα, and SREBP-1c in the adipocytes. Based on the results of the in vitro experiment, an in vivo experiment was used to examine the antiobesity effects of the SOL 50% EtOH extract. The C57BL/6J mice were fed a high-fat diet to induce obesity and were treated orally with the SOL 50% EtOH extract (50, 100, and 200 mg/kg/day) and GC water extract (100 mg/kg/day) for 8 weeks. The final body weights and body weight gains were considerably lower in the HFD+S200 group without affecting energy intake. The weight of adipose tissue and size of adipocytes were much lower in the HFD+S200 group. The levels of TG, TC, LDL-C, and GLU were relatively decreased, whereas the level of HDL-C was not significant in the HFD+S200 group. The expression of PPARγ, C/EBPα, FABP4, and ACC was lower, and the expression of adiponectin and CPT-1 was higher in the HFD+S200 group. Our results demonstrated that the SOL 50% EtOH extract has an antiobesity effect in 3T3-L1 adipocytes and obese C57BL/6J mice. This effect was further evidenced by the inhibition of adipogenesis through regulation of PPARγ and C/EBPα. We assumed that the SOL 50% EtOH extract likely activated AMPK because it decreased the expression of ACC and increased expression of adiponectin and CPT-1. Although it is well known that ellagic and gallic acids have antiobesity effects as in several studies, 48,49 further studies on which components in the SOL 50% EtOH extract exert the antiobesity effects are needed.
In conclusion, our results demonstrated that the 50% EtOH extract among the SOL extracts considerably inhibited the TG accumulation through the downregulation of PPARγ, C/EBPα, and SREBP-1c in 3T3-L1 adipocytes. In addition, the results demonstrated that the 50% EtOH extract reduced body weight and adipose tissue weight and improved serum lipid profiles through downregulation of PPARγ, C/EBPα, FABP4, and ACC and upregulation of adiponectin and CPT-1 in obese C57BL/6J mice fed a high-fat diet. We suggest that the SOL 50% EtOH extract is a potential natural substance for the prevention or treatment obesity, but additional studies are required to provide information about its efficacy as an antiobesity agent.
Footnotes
Acknowledgment
This work was supported by the Hallym University Research Fund (HRF-201510-012).
Author Disclosure Statement
No competing financial interests exist.