




Abstract
This study was performed to investigate the effects of Crataegi fructus ethanol extracts (CFEEs) on the differentiation of 3T3-L1 cells, and to evaluate the effects of C. fructus powder (CFP) on lipid metabolism and its antiobesity effect in rats fed a high-fat and high-cholesterol (HFC) diet. Both in vitro and in vivo studies were performed for physiological activity and antiobesity effects on the serum, liver, and adipose tissues in obesity-induced rats. CFEEs showed significant inhibitory action on differentiation and triglyceride (TG) accumulation in 3T3-L1 mature cells in a dose-dependent manner. Subcutaneous, mesenteric, epididymal, and total adipose tissue weights of HFC diet group were heavier than those of normal diet (N) group, whereas those of groups fed CFP were significantly decreased. Levels of serum TGs, total cholesterol (TC), and low-density lipoprotein cholesterol were significantly decreased in the CFP groups than in the HFC group, whereas the serum high-density lipoprotein cholesterol level decreased in the HFC group and markedly increased in the CFP groups. TC and TG levels in the liver and adipose tissues were significantly lower in CFP groups than in the HFC groups. In addition, feeding with CFP significantly reduced the occurrence of fatty liver deposits and steatosis, and inhibited an HFC diet-induced increase in adipocyte size. These results suggest that C. fructus may improve lipid metabolism in the serum, liver, and adipose tissue, and may potentially reduce lipid storage.
Introduction
O
For treatment and prevention of obesity, various methods such as weight loss, body fat reduction, exercise, drug, and diet have been applied. The most preferential way is considered to be diet. 4 Recently, the relationship between food and diseases received increasing attention because of an increase in chronic diseases, for which obesity is a common cause. 5 Thus, there has been growing interest in natural substances that can prevent obesity, reduce levels of cholesterol and triglycerides (TGs) in the body, guarantee safety, and be commercialized. 6 It is also highly desirable to develop new functional foods from natural plants that are capable of treating obesity.
Crataegi fructus is a mature fruit from Crataegus pinnatifida Bunge, a deciduous tree species belonging to the family Rosaceae. It has its own savory fragrance and sweet and sour taste. 7 In the East, C. fructus has a cultivation history of more than 3000 years and was widely used as a folk drug that has medicinal effects, including effects on blood circulation, diuretic, cardiotonic, and stomachic effects. 8 C. fructus contains abundant vitamins, minerals, and carotene. In addition, it also contains various organic acids as well as various flavonoid compounds. 9 In addition, it has been reported that C. fructus contains polyphenols with antioxidant properties. 10 Previously, studies were performed to investigate the physiological activities of C. fructus. These activities include antioxidant, antibacterial, and anticomplement activities. 11,12 These studies investigated its inhibitory effects on α-amylase and α-glucosidase, differentiation and degradation effects on adipocytes, protective effects against liver damage, hyperlipidemia improvement effects, vasodilating effects, memory improvement effects, and enhancement of cognitive ability. This study was performed to investigate inhibitory effects of C. fructus ethanol extracts (CFEEs) on differentiation of 3T3-L1 cells. In addition, we investigated lipid metabolism improvement and ameliorating effects of C. fructus powder (CFP) on the serum, liver, and adipose tissues in diet-induced obese rats fed high-fat and high-cholesterol (HFC) diets.
Materials and Methods
Experimental materials
Korean C. fructus was purchased from Gyeongdong Market in Seoul, South Korea. It was freeze dried, ground to a powder, and stored at −70°C until used.
Sample extraction
Every 100 g of freeze-dried CFP was mixed with 500 mL of 80% ethanol and extracted three times in a heating mantle (Mtops ms-265, Seoul, Korea) attached to a reflux condenser at 65°C for 3 h, and then filtered using Whatman filter paper (No. 2). Solvent was removed from the filtrate using a rotary vacuum evaporator (EYELA VACUUM NVC-1100, Tokyo, Japan) in a water bath at 40°C. Then, the filtrate was concentrated under low pressure and freeze drying, and stored frozen at −70°C to prevent oxidation.
Cell culture and differentiation
3T3-L1 cells were cultured following the method described by Chen et al. 13 Cells were inoculated into Dulbecco's Modified Eagle's Medium (DMEM) containing 10% fetal bovine serum (FBS) in six-well culture plates at concentrations of 0.3 × 10⁵ cell/well for differentiation. Then, cells were cultured in a 5% carbon dioxide (CO2) incubator at 37°C, in which 2 mL medium was added per well for differentiation. To investigate the effect of CFEEs on differentiation of 3T3-L1 cells, cells were cultured in DMEM containing 10% FBS for 14 days from the day of washing to the day of measurement of differentiation and the medium was changed every 2 days. To induce differentiation, insulin (10 μg/mL), dexamethasone (1 μM), and IBMX (0.5 nM/mL) were added on the first day of differentiation induction, and the same amount of insulin (10 μg/mL) was added after 2 days. As a control, cells were treated with dimethyl sulfoxide (DMSO), which was used for dilution of CFEEs, and were treated with CFEEs for 2 days after the day of cell washing.
Cell viability analysis
Cytotoxicity was determined by the 3-[4,5-dimethylthiazole-2-yl]-2,5-di-phenyl-tetrazolium bromide (MTT) assay. In brief, 3T3-L1 preadipocytes were treated at each concentration in the medium without FBS and antibiotics. After incubation for 24 h, the MTT solution (5 mg/mL) was added and samples were incubated for 4 h, and then the supernatant was removed. The supernatants were carefully aspirated and 200 μL of DMSO was added to dissolve the formazan, and the plates were incubated on a shaker. After 30 min, absorbance was measured at 540 nm using a microplate reader (EL808; BioTek, Winooski, VT). The cytotoxicity was compared using the absorbance value of untreated control cells as the baseline.
Measurement of 3T3-L1 mature cell differentiation
Differentiation of 3T3-L1 preadipocytes into mature cells was measured by monitoring the activity of glycerol-3-phosphate dehydrogenase (GPDH) enzyme in the cells during culture, using the method described by Wise and Green. 14 After completion of cell culture, culture medium was completely removed from the six-well plate, and residual medium was washed off with phosphate-buffered saline (PBS). Then, cells were scraped using 260 μL of homogenizing buffer (pH 7.4; 0.25 M sucrose, 5 mM Tris base, 1 mM ethylenediaminetetraacetic acid (EDTA), 1 mM dithiothreitol), then collected into 1.5-mL Eppendorf tubes and incubated on an ice bed. Cells were subjected to sonication (Sonics & Materials, Inc., Newtown, CT) at 6 W for 10 sec and centrifugation at 2580 g at 4°C for 10 min. Then, 200 μL of the supernatant was transferred to a new Eppendorf tube. Thereafter, 800 μL assay buffer (100 mM triethanolamine, 2.5 mM EDTA, 0.1 mM β-mercaptoethanol, and 0.176 M NADH), 100 μL 0.16 μM dihydroxyacetone phosphate lithium solution as its substrate, and 150 μL of the supernatant were transferred to a cuvette and mixed by shaking. This was followed by measurement of optical density at 340 nm using a spectrophotometer (Shimadzu UV-Visible Spectrophotometer, UV-1601, Kyoto, Japan) to determine GPDH activity.
Measurement of TG content in 3T3-L1 mature cells
Levels of TG produced during induction of differentiation in 3T3-L1 cells were measured by an enzymatic method. After washing three times with PBS, differentiation-induced and maintained cells were lysed by osmolysis using 200 μL M-PER mammalian cell extraction solution (Pierce, Inc., Rockford, IL). The lysed solution was transferred to a new 1.5 mL microtube and then incubated on an ice bed for 30 min to ensure complete lysis. Thereafter, the mixture was centrifuged at 1792 g at 4°C and the supernatant was used for experiments. Glycerol standard (Sigma-Aldrich, St. Louis, MO) was used as a control after dilution by concentration (39.0625–2500 μg/mL). After addition of 160 μL free glycerol reagent to a 96-well enzyme-linked immunosorbent assay plate, 5 μL water (blank), glycerol standard, and samples were added to the wells. Solutions in each well were mixed by tapping the plate, and incubated at 37°C for 5 min, followed by measurement of initial absorbance (IA) at 540 nm. TG reagent (40 μL) was added to each well and mixed by tapping, and then incubated at 37°C for 5 min, followed by measurement of final absorbance (FA) at 540 nm. TG levels in the samples were calculated using IA and FA.
Breeding and diet of experimental animals
Thirty-two male Sprague Dawley rats (5 weeks old) were purchased from Central Lab. Animal, Inc. (South Korea). Animals were adapted to solid formula feed for 1 week, divided into four groups with eight rats per treatment group following a randomized block design, distributed into stainless cages with one rat per cage, and reared for 4 weeks. Experimental groups were divided into normal diet group (N), HFC diet group (control), HFC diet with 5% CFP group (CL), and HFC diet with 10% CFP group (CH). Experimental diets were prepared by using a modified AIN-93 purified diet as given in Table 1. 15 The normal diet group was supplied with lard corresponding to 10% of the diet weight as a fat source. The HFC diet group was supplied with lard and cholesterol corresponding to 20% and 1% of the diet weight, respectively. CFP was supplied corresponding to 5% and 10% of diet weight for the CL group and the CH group, respectively. Water and diet were provided ad libitum. Rearing room conditions were 18 ± 2°C for temperature and 12 h (08:00–20:00) of lighting cycle. To calculate the rate of weight gain, weight before the experiment was subtracted from the final weight, and the result was divided by weight before the experiment. To calculate the food efficiency ratio (FER), gained weight during the rearing period was divided by amount of food intake during the same period. The experimental protocol used in this study was approved by the Institutional Animal Care and Use Committee of Chosun University (CLACUC2015-A0029).
AIN-93-MX mineral mixture and AIN-93-VX vitamin mixture. 15
CH, high-fat–high-cholesterol diet containing 10% of Crataegi fructus powder; CL, high-fat–high-cholesterol diet containing 5% of Crataegi fructus powder; HFC, high-fat and high-cholesterol; N, normal diet.
Treatment of experimental animals
After completion of feeding experiments, experimental animals were fasted for 12 h and lightly paralyzed using CO2, then decapitated. Blood was collected and serum was separated by centrifugation at 1150 g for 20 min. The separated serum samples were used to measure serum lipid contents and enzyme activities. In addition, liver and adipose tissues were surgically removed, followed by removal of residual blood and other attached materials using 0.9% saline solution. Thereafter, water was removed with filter paper, weight was measured, and tissue samples were rapidly frozen to prevent reduction of enzyme activity and kept in a deep freezer at −70°C.
Measurements of serum enzyme activities and lipid contents
An automated hematology biochemistry analyzer (Fuji Dri-Chem 3500; Fujifilm, Tokyo, Japan) was used to measure alanine aminotransferase (ALT), aspartate aminotransferase (AST), alkaline phosphatase (ALP), and lactate dehydrogenase (LDH) activities in the serum, as well as TG, total cholesterol (TC), and high-density lipoprotein cholesterol (HDL-C) contents. Low-density lipoprotein cholesterol (LDL-C) contents were calculated by using the Friedewald formula {TC–(HDL-C–TG/5)}. 16 Ratio of HDL-C to TC was calculated by dividing HDL-C by TC. The atherogenic index (AI), used to evaluate the degree of cardiovascular risk, was calculated by the following equation {(TC–HDL-C)/HDL-C}. Cardiac risk factor (CRF) was calculated through dividing TC by HDL-C. 17
Measurements of lipid contents in liver tissues and adipose tissues
To measure TG and TC levels in liver tissues, epididymal, and mesenteric adipose tissues, total lipids were extracted from each tissue using the method reported by Folch et al. 18 At first, 0.1 g of the extracted liver tissues and adipose tissues was mixed with 6 mL CHCl3–MeOH (2:1, v/v) and incubated in a refrigerator for 3 days, followed by addition of H2O and centrifugation at 1150 g for 20 min. The bottom layer corresponding to the lipid layer was retrieved and then used for analysis of TG and TC contents. TC contents were measured by the method reported by Zlatkis and Zak, 19 and TG contents were measured by the method of Biggs et al. 20
Hepatic tissue accumulation and adipocyte size
The dissected liver and epididymal adipose tissues were fixed in 3% formaldehyde solution, and paraffin-embedded sections were stained with hematoxylin–eosin (H&E). Liver sections were examined for lipid accumulation under a light microscope (100 × magnification). Adipocyte sizes were measured in randomly chosen microscopic areas from independent animals using the Olympus microscope system, and average adipocyte size was calculated by dividing the chosen microscopic area by the total number of adipocyte cells in this area.
Statistical analysis
Experimental results were subjected to statistical analysis using SPSS (Statistical Package for Social Science). Results are expressed as mean ± standard error for each experimental group. For testing statistical significance, one-way analysis of variance was performed to compare the means among test groups as an independent variable (N, HFC, CL, and CH) in one categorical variable, followed by multiple pair-wise comparison using Tukey's test at P < .05.
Results
Effects on cell viability, differentiation, and TG content of 3T3-L1 cells
To examine CFEE-induced cytotoxicity, 3T3-L1 preadipocyte viability after exposure to 50–200 μg/mL CFEEs for 24 h was evaluated by MTT assay. Cells were still viable at all CFEE concentrations tested, as compared with untreated control cells (Fig. 1A). In addition, the treatments did not change cell morphology, showing no toxicity of CFEEs treatment (figures not shown). To find out effects of CFEEs on differentiation and TG content of 3T3-L1 cells, cells were treated with a series of CFEE concentrations, including 50, 100, and 200 μg/mL; the results from the measurements are presented in Figure 1B and C. As CFEEs concentration increased, GPDH activity declined in a dose-dependent manner, showing an inhibitory effect on differentiation of 3T3-L1 cells. At CFEE concentrations of 50, 100, and 200 μg/mL, GPDH activity in 3T3-L1 cells significantly decreased by 7.73%, 17.71%, and 23.11%, respectively, compared with that in the control. Consistently, as CFEEs concentration increased, TG content in 3T3-L1 cells decreased. Only at a CFEE concentration of 200 μg/mL, TG content significantly decreased by 46.09% compared with that in the control.
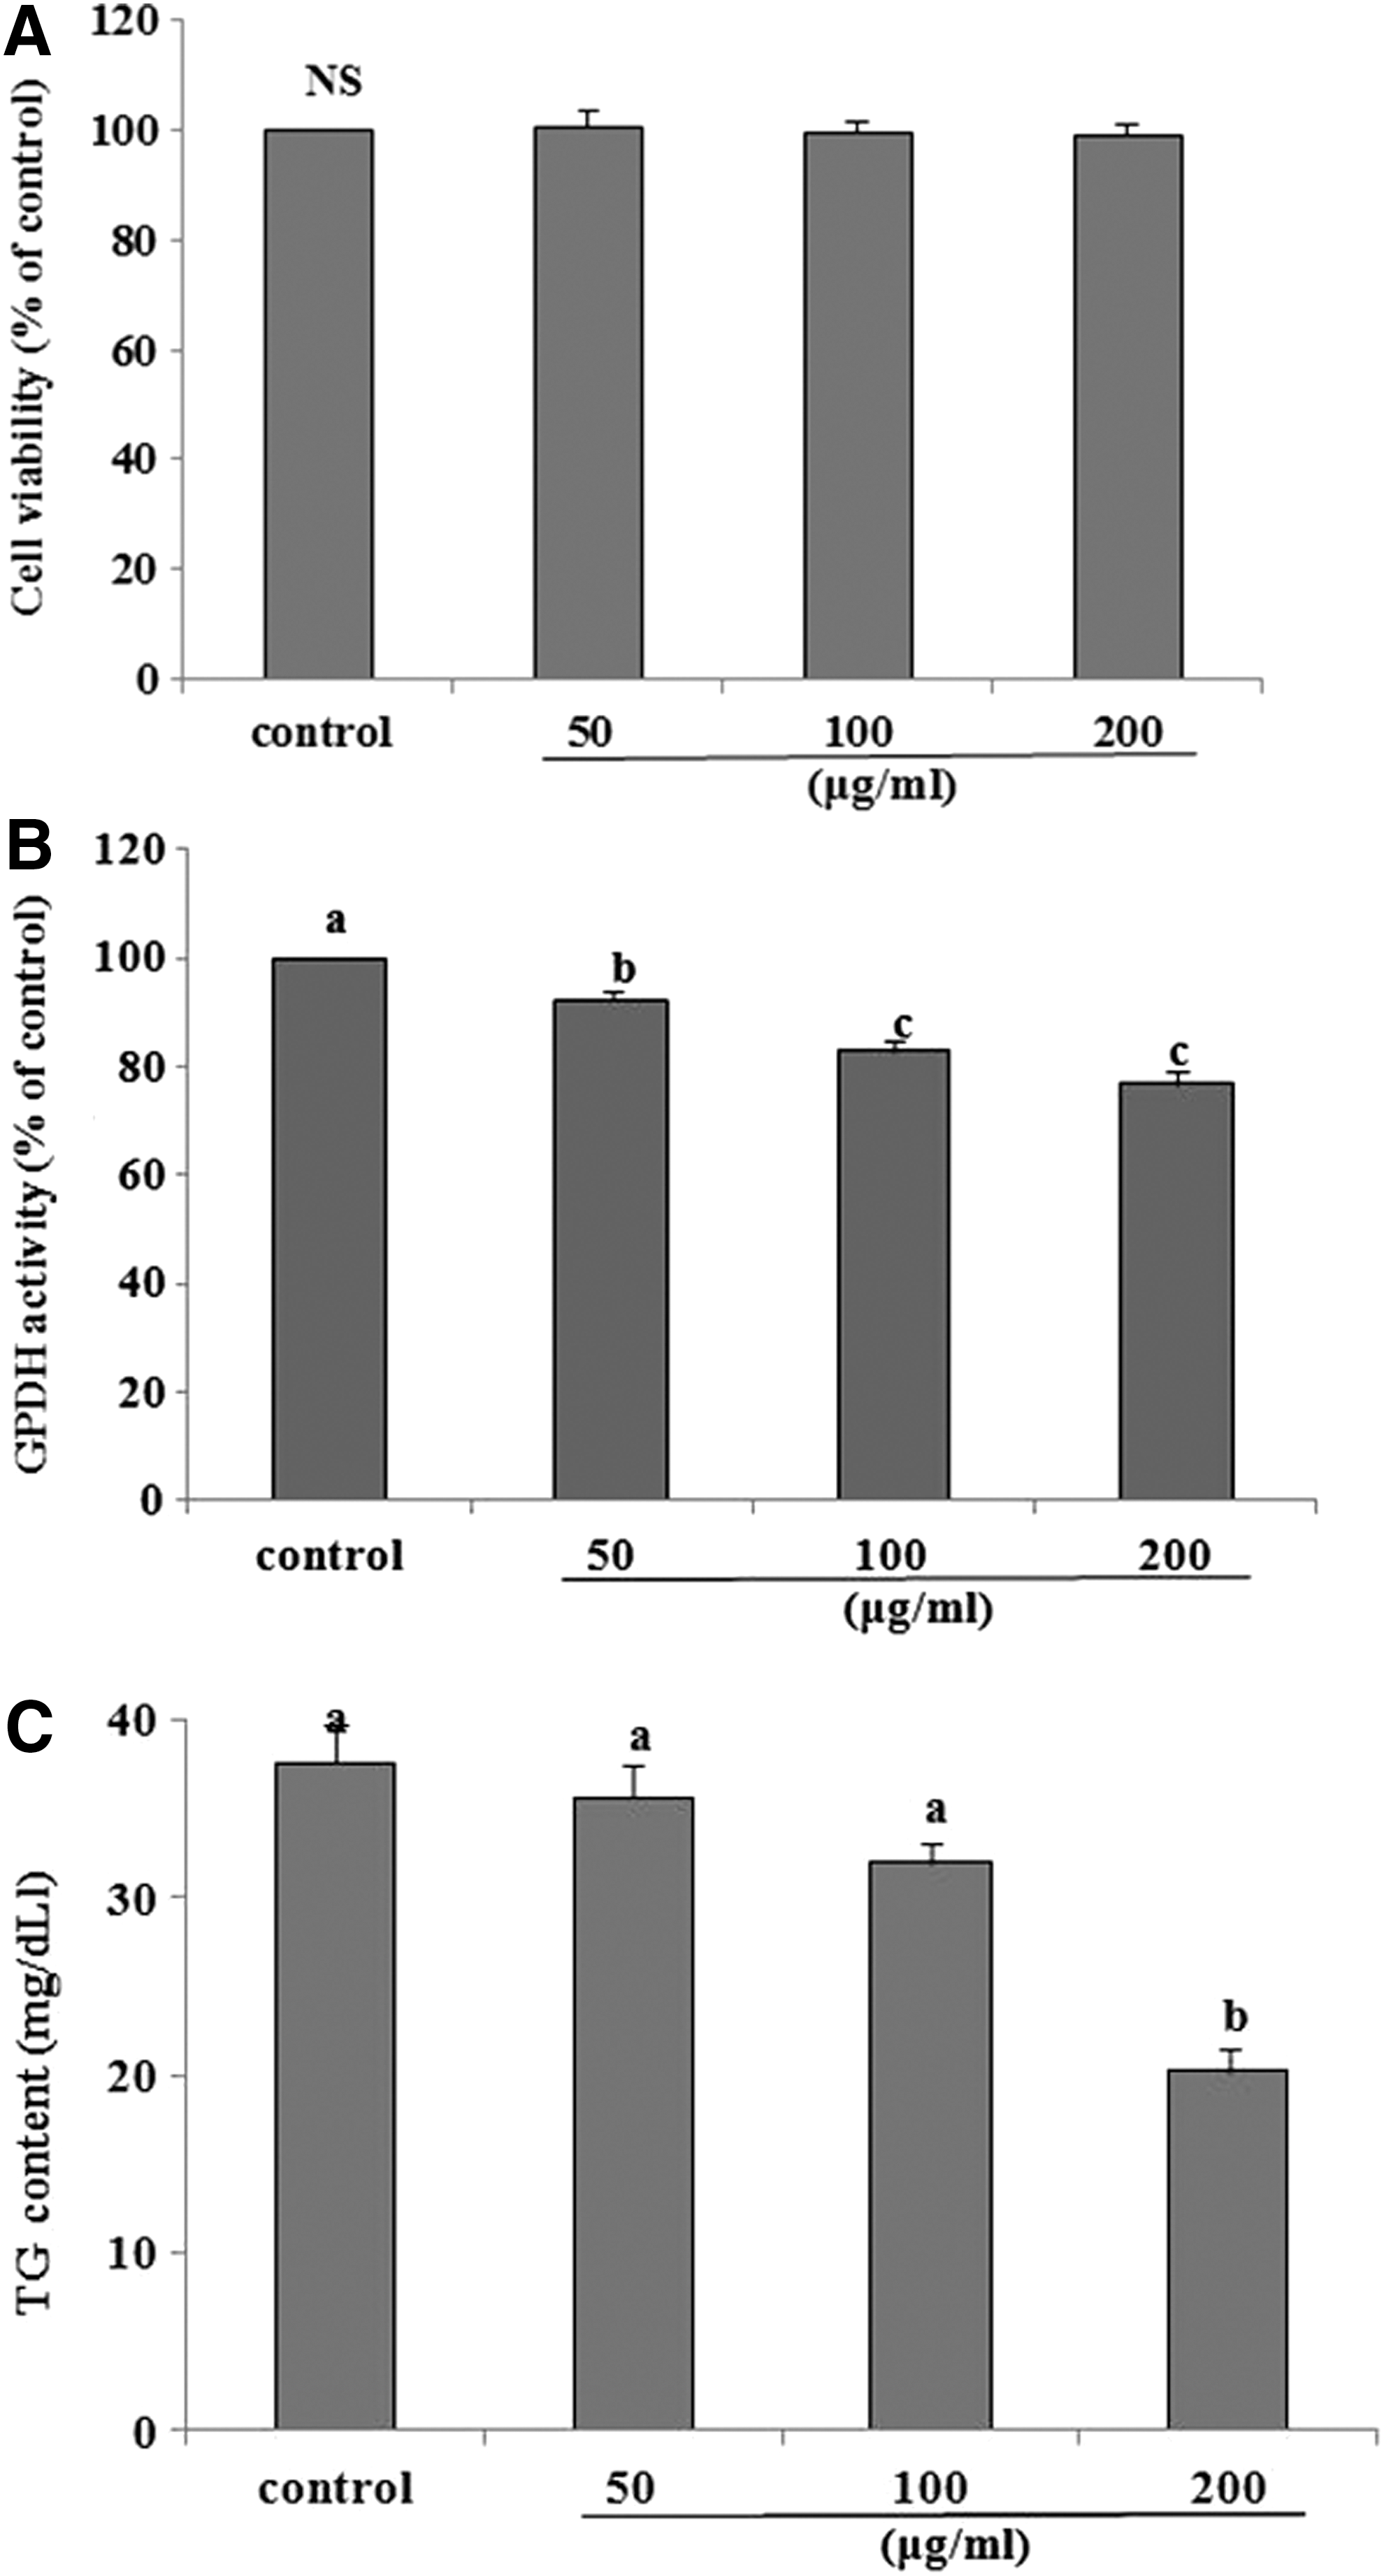
Effects of Crataegii fructus ethanol extracts on cytotoxicity
Weight gain, food intake, and FER
The results of weight gain, food intake, and FER of rats fed the HFC diet with different amounts of CFP for 4 weeks are presented in Table 2 for comparison. For weight gain, the HFC group gained significantly more weight by 20.21% than the N group. The groups fed by HFC diet with supplementation of CFP (CL and CH) gained less weight by 3.28% and 12.90%, respectively, than the HFC group, but only the CH group with supplementation of 10% CFP gained significantly less weight. Food intakes were not significantly different among experimental groups. For FER, the HFC groups (HFC, CL, and CH) had significant elevations than the N group, whereas there were no significant differences between the HFC groups (HFC, CL, and CH).
Values with different superscripts in the same column are significantly different (P < .05) between groups by Tukey's test.
FER: total weight gain/total food intake.
Values are mean ± standard error of eight rats per each group.
NS: not significantly different among groups.
FER, food efficiency ratio.
Weights of liver and adipose tissues
Weights of liver and adipose tissues of rats fed HFC diet with different amounts of CFP for 4 weeks are presented in Table 3 for comparison. Although the HFC group had a significant increase in liver tissue weight compared with the N group, there were no significant differences between the HFC groups (HFC, CL, and CH). Weights of subcutaneous, mesenteric, epididymal, and total adipose tissues also significantly increased in the HFC group compared with those in the N group. Weights of adipose tissues that were higher because of HFC diet were significantly lower with CFP supplementation. However, there were no significant differences in weights of retroperitoneal adipose tissues among the experimental groups.
Values with different superscripts in the same column are significantly different (P < .05) between groups by Tukey's test.
The results are mean ± standard error for eight rats in each group.
NS: not significantly different among groups.
AT, adipose tissue.
ALT, AST, ALP, and LDH activities in serum
Activities of ALT, AST, ALP, and LDH measured in the serum of rats fed HFC diets with different amounts of CFP for 4 weeks are presented in Figure 2. Serum ALT, AST, ALP, and LDH activities increased significantly in the HFC group compared with those in the N group. ALT, AST, and LDH activities that increased because of the HFC diet were significantly decreased by CFP feeding. However, there were no significant differences in serum ALP activity among the HFC groups (HFC, CL, and CH).

Serum activities of ALT
TG, TC, LDL-C, and HDL-C contents, AI, and CRF in serum
Changes in TG, TC, LDL-C, and HDL-C contents, AI, and CRFs in the serum of rats fed with HFC diet with different amounts of CFP for 4 weeks are presented in Figure 3. For TG, TC, and LDL-C contents in serum, the HFC group showed significantly higher levels than the N group. The CL and CH groups exhibited lower H&E staining, and lower TG, TC, and LDL-C contents in serum in a dose-dependent manner than the HFC group. In contrast, HDL-C content in the serum was significantly lower in the HFC group than in the N group, and significantly increased by CFP administration. AI and CRF were also significantly higher in the HFC group than in the N group, and significantly lower in the CL or CH group than in the HFC group, whereas there was no significant difference depending on CFP amount.
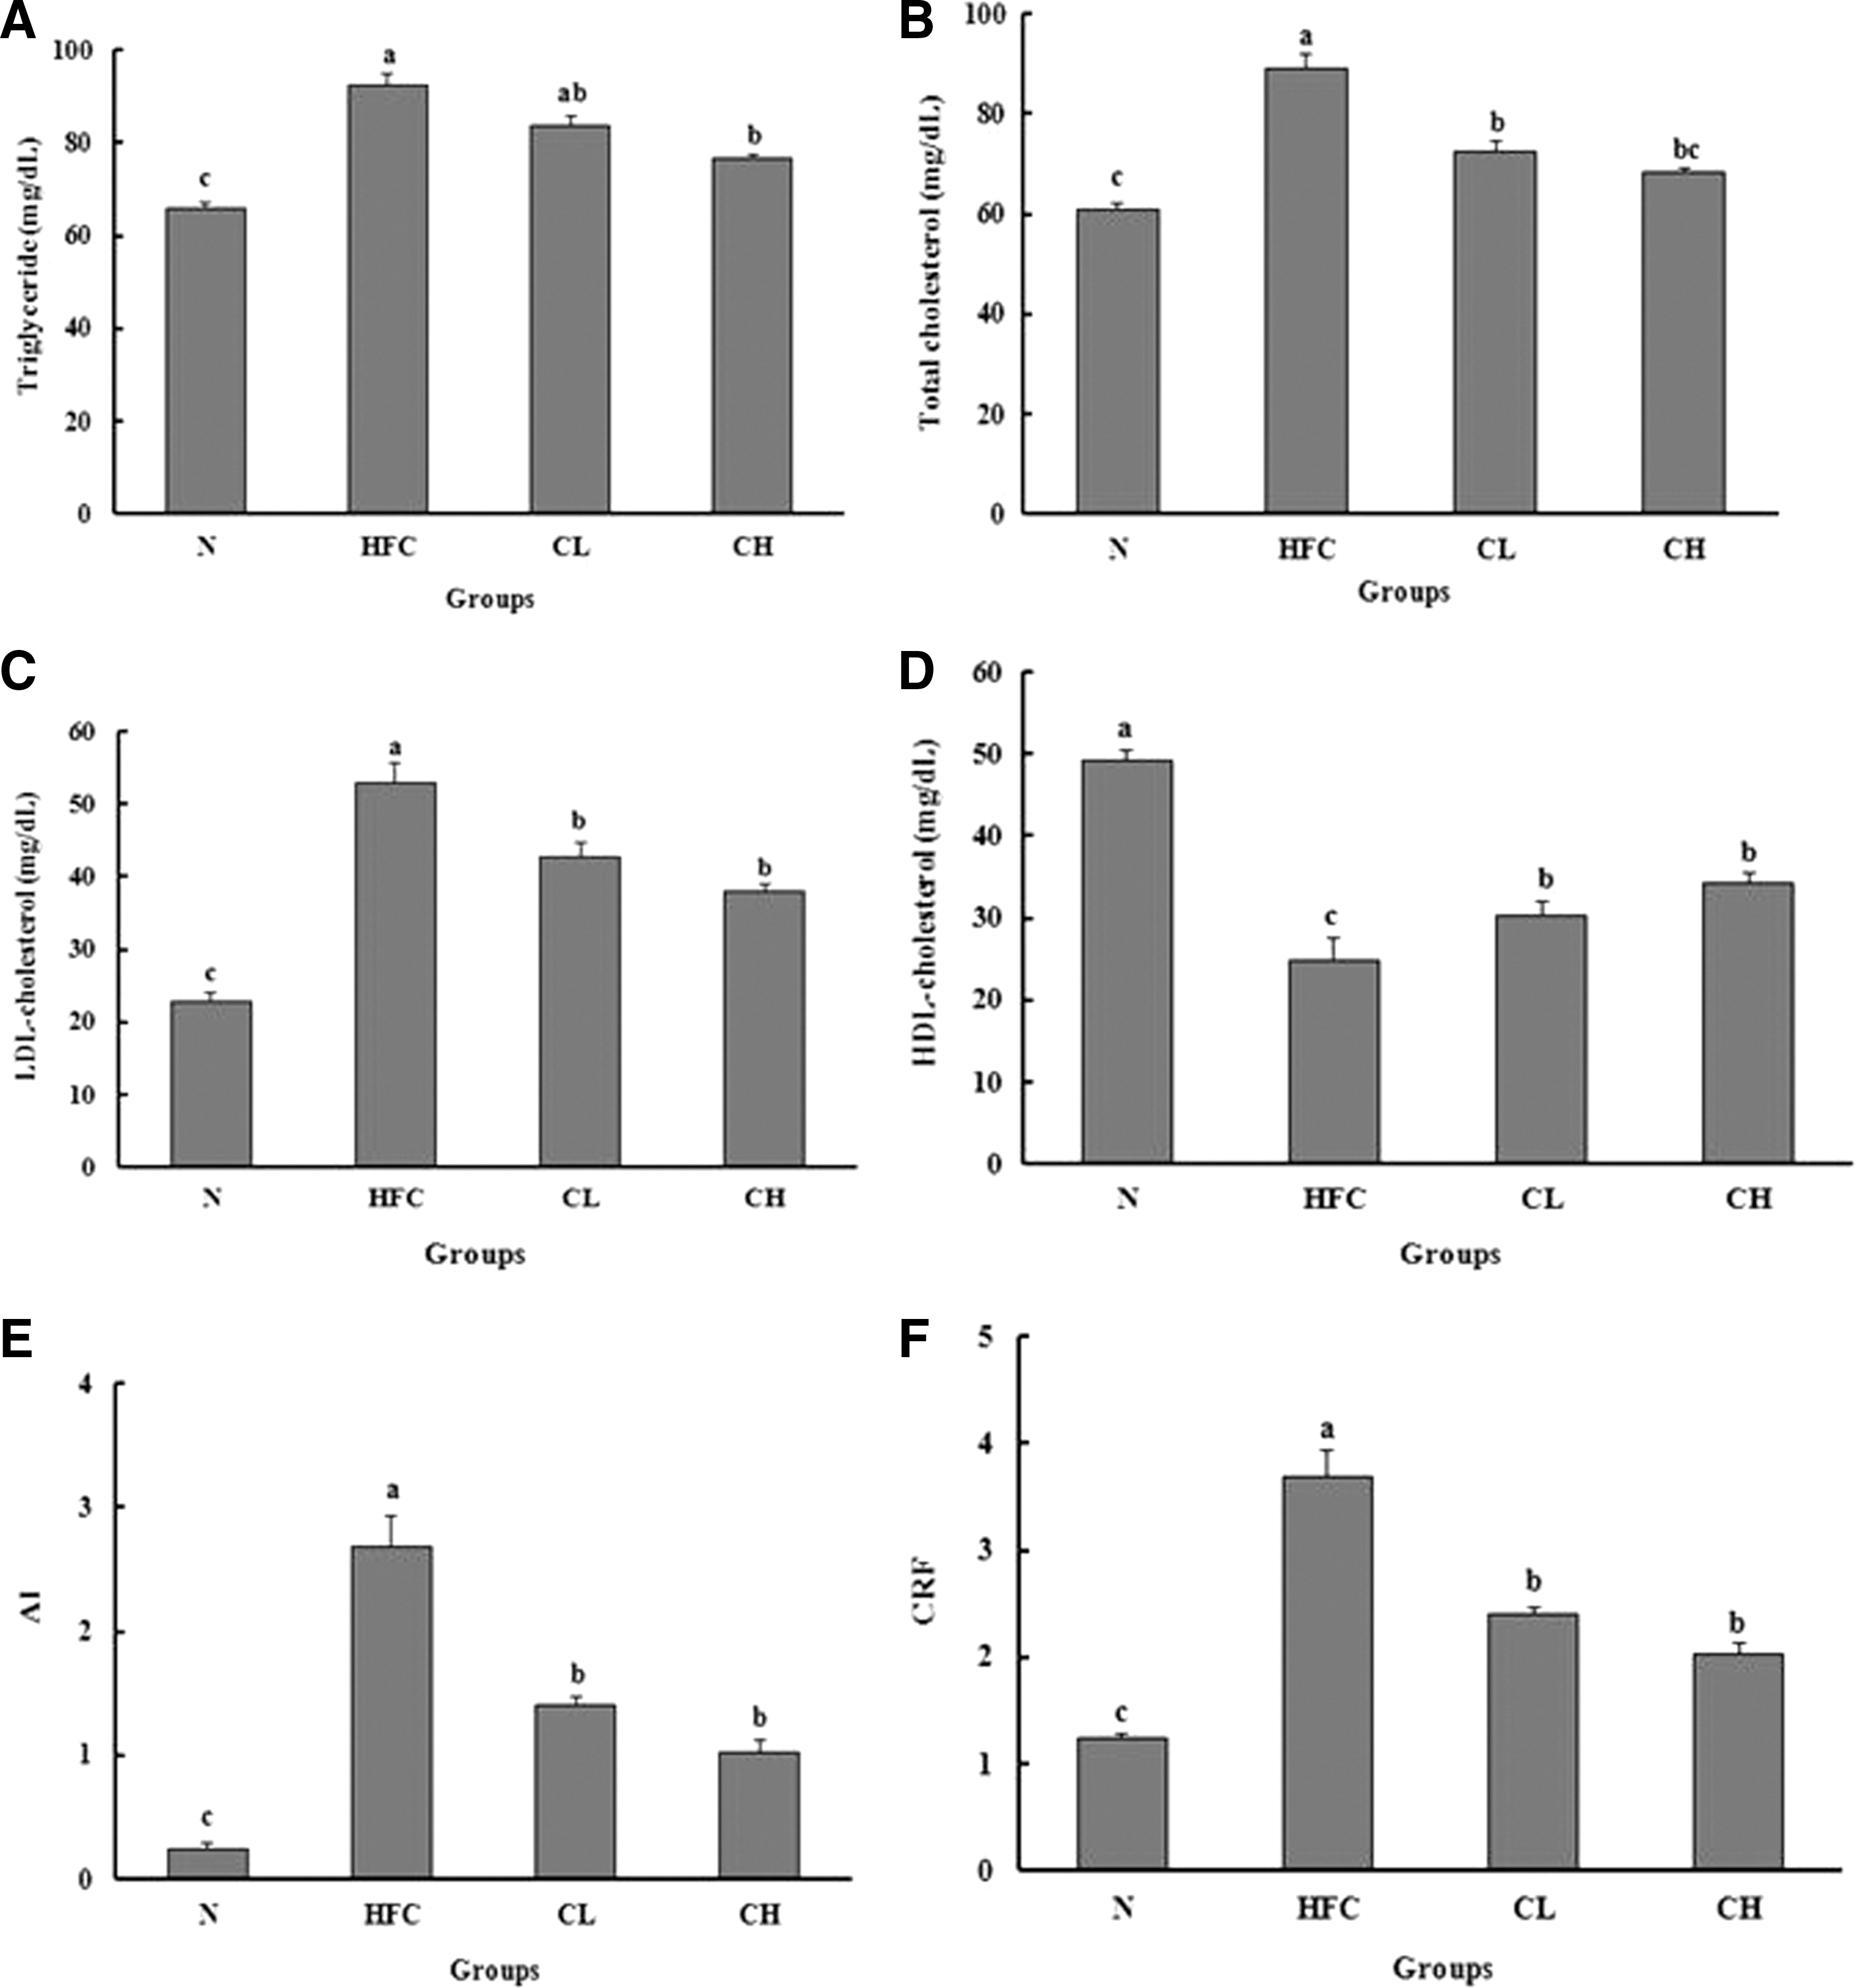
Contents of TG
TG and TC contents in liver and adipose tissues
TG and TC contents in liver and adipose tissues of rats fed HFC diet with different amounts of CFP for 4 weeks are presented in Figure 4. Contents of TG and TC in liver tissue of the HFC group showed a significant increase compared with those of the N group. TG contents in liver tissues significantly declined in the CH group with 10% CFP supplementation compared with those in the HFC group, and there was a significant difference depending on the amount of CFP. In comparison with the HFC groups (HFC, CL, or CH), the groups with HFC diet with CFP supplementation (CL and CH) showed a significant dose-dependently lower TC content in the liver tissues. The HFC group also had significantly higher TG and TC contents in mesenteric and epididymal adipose tissues than the N group. TG and TC contents in mesenteric and epididymal adipose tissues declined in a CFP dose-dependent manner. For mesenteric adipose tissue, however, only the CH group with 10% CFP supplementation had significantly lower levels of TG and TC than the HFC group. For epididymal adipose tissue, both CL and CH groups with CFP supplementation had significantly lower TG and TC contents than the HFC group.

Contents of TG and total cholesterol in the liver
Lipid accumulation in the liver tissue
To determine the level of lipid accumulation in the liver tissue, H&E staining was performed, which found clear lipid accumulations (red color) and various sizes of lipid droplets in hepatocytes of rats fed HFC diet, as shown in Figure 5, which corresponded to findings of severe fatty liver. Lipid accumulation seemed to be inhibited in liver tissues of the group with HFC diet with CFP supplementation compared with that of the HFC group. These results showed a similar trend to the TG contents in liver tissues shown in Figure 4.

Histological changes of liver in the rats fed by HFC diets containing Crataegii fructus powder. Each tissue was stained with H&E, and observed microscopically at 100 × magnification. H&E, hematoxylin–eosin.
Sizes of epididymal adipocytes
As the measurement of adipocyte size is known as an effective method to prove antiobesity effects, epididymal adipose tissues of rats were stained, observed under the microscope, and analyzed by an image analyzer, as shown in Figure 6. The HFC group had clearly larger epididymal adipocytes than the N group. In contrast, the group with HFC diet with CFP supplementation had smaller adipocytes than the HFC group.
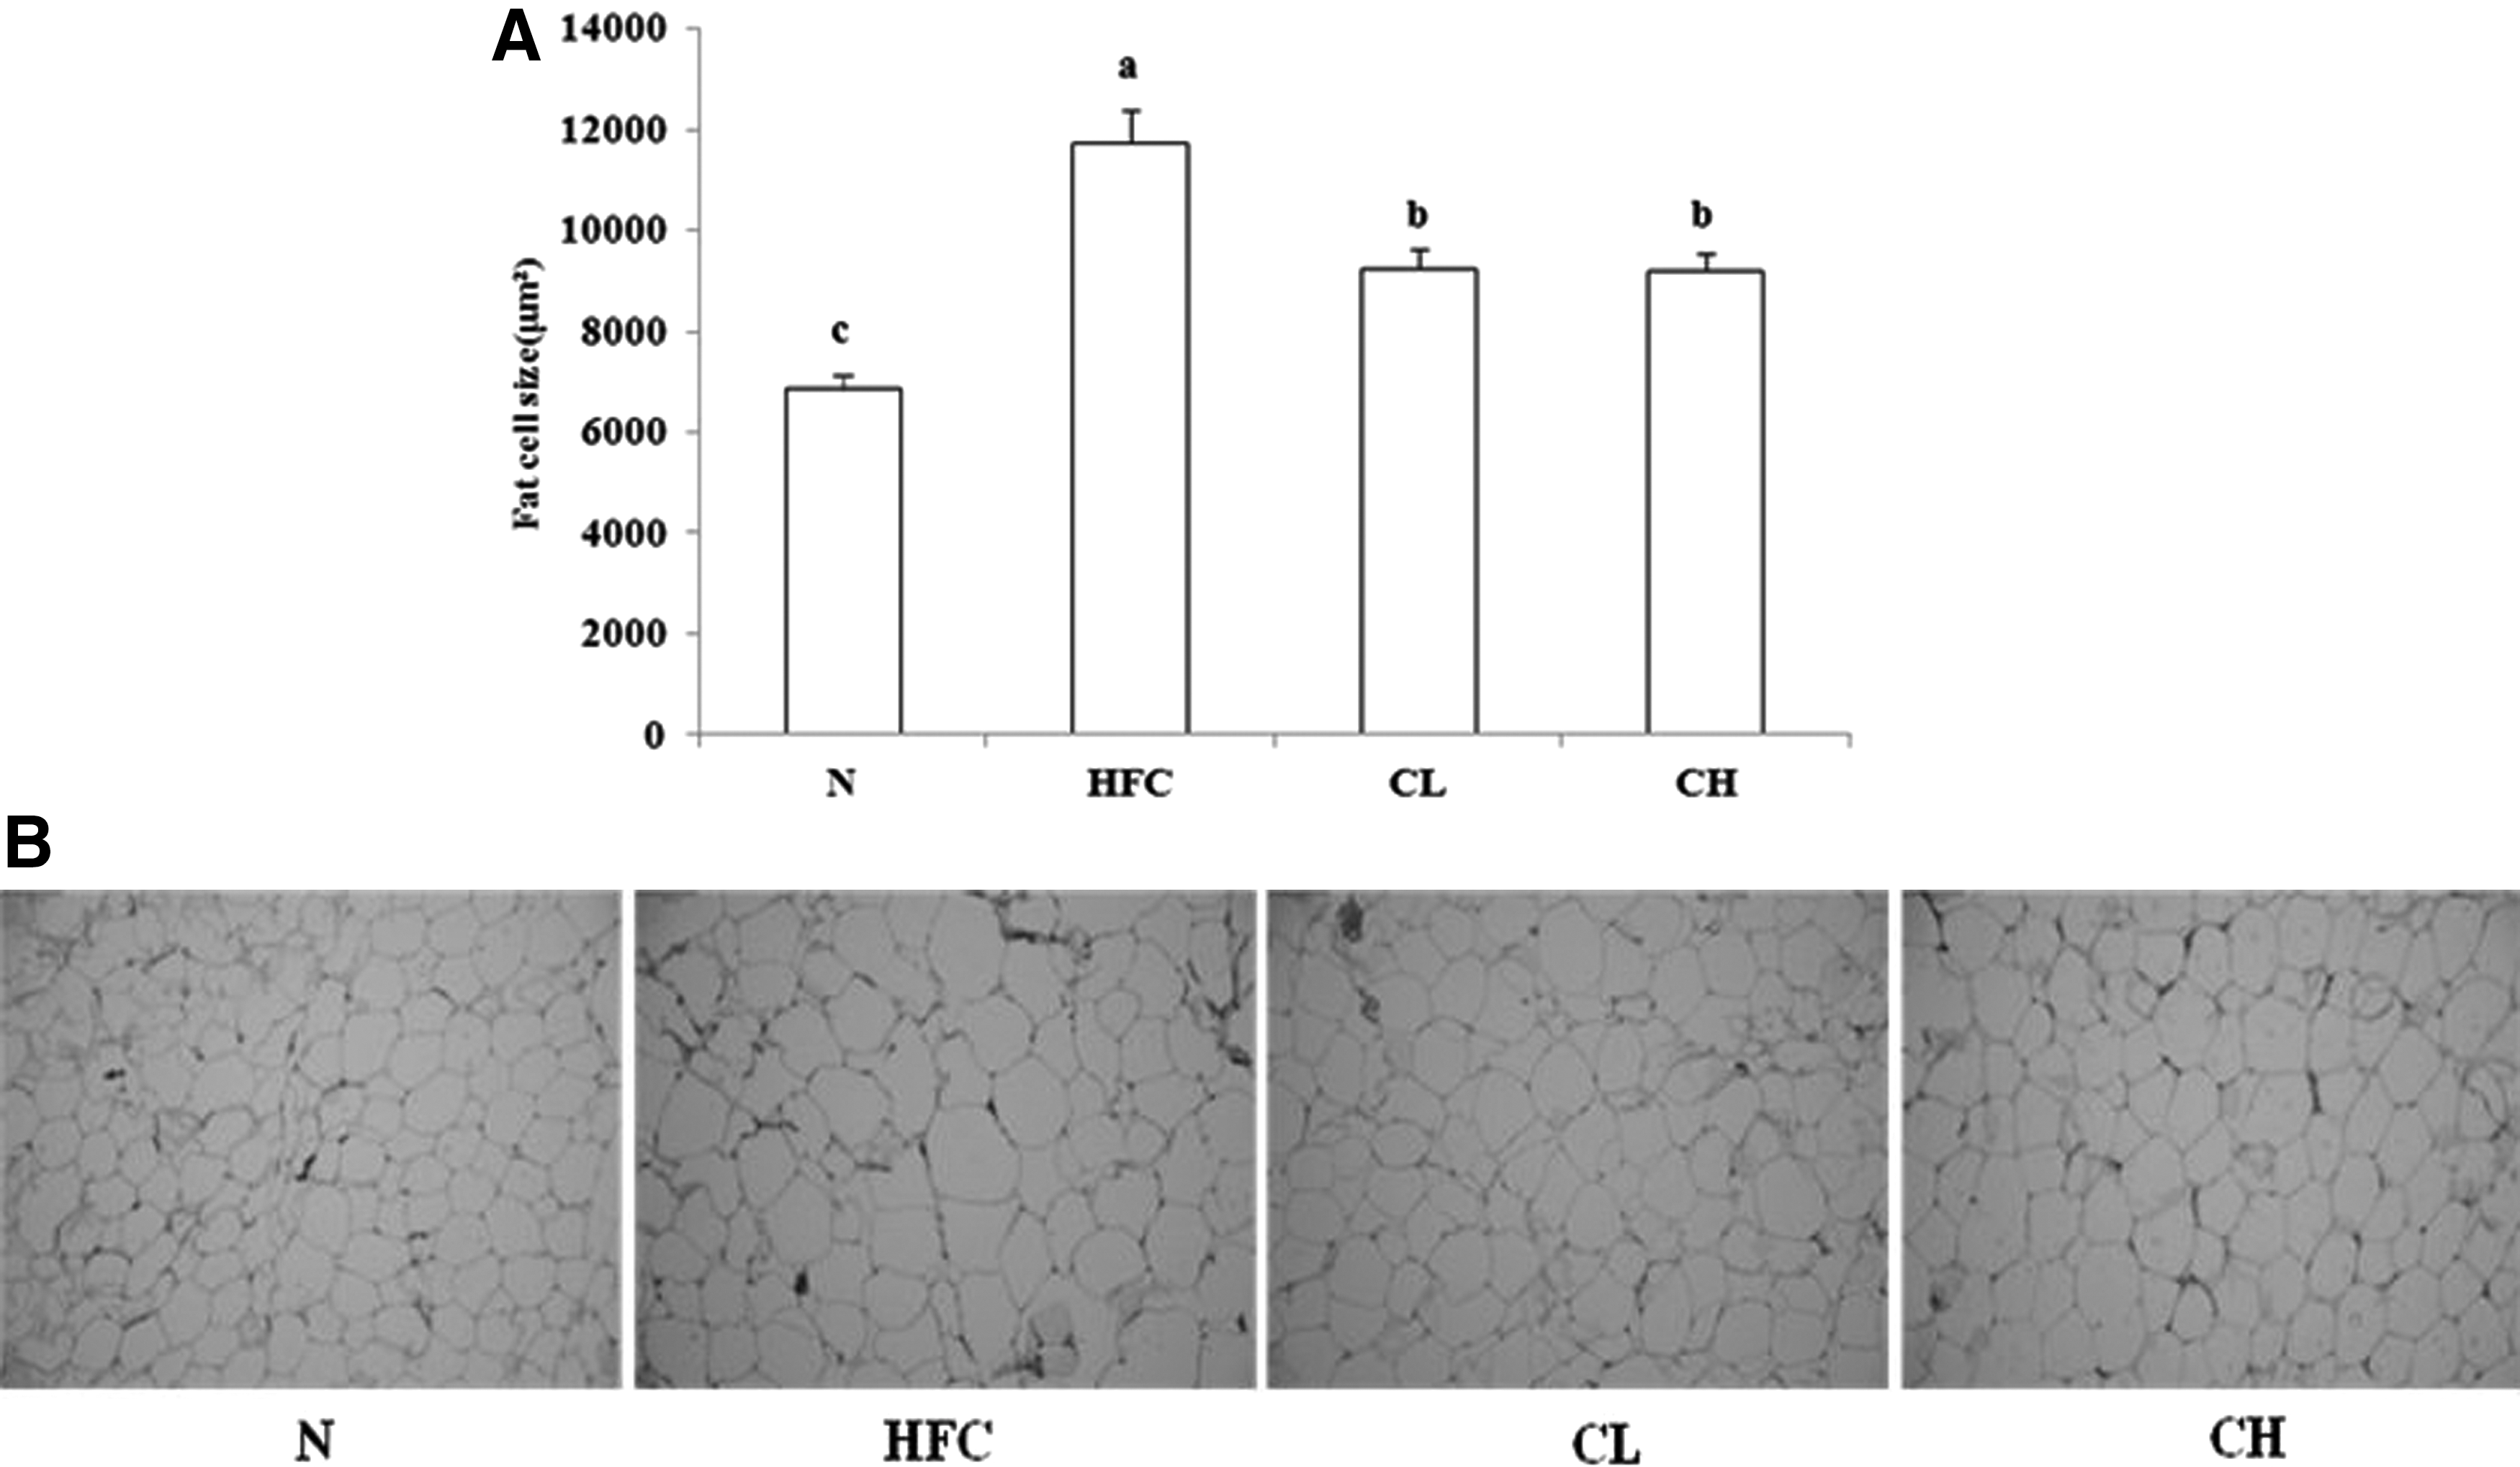
Epididymal adipocyte size in the rats fed by HFC diets containing Crataegi fructus powder. Adipocyte size of the epididymal fat pads
Discussion
Obesity is induced by hyperplasia of adipocytes through adipogenesis and hypertrophy because of lipid accumulation. 21 Hyperplasia of adipocytes is regulated by proliferation and differentiation of cells, whereas hypertrophy of adipocytes is controlled by the balance between lipogenesis and lipolysis. 22 Thus, how to inhibit lipid accumulation and stimulate lipolysis of accumulated lipids in cells has been extensively studied. 3T3-L1 preadipocyte used in this study, is a cell line derived from 3T3 cells, a mouse fibroblast, which has biological features and characteristics that can differentiate into adipocytes under optimal culture conditions. Therefore, it has been used as a model to study not only metabolic process of adipocytes but also lipid accumulation and adipogenesis. 23 GPDH is an enzyme that converts dehydroxyacetone phosphate to glycerol-3-phosphate, and is useful to investigate whether preadipocytes have differentiated into mature adipocytes. GPDH activity and H&E staining of the contents of the adipocytes are upregulated during conversion of 3T3-L1 preadipocytes into adipocytes. 14,24 In this study, treatment of the 3T3-L1 cells with different concentrations of CFEEs inhibited differentiation of 3T3-L1 cells in a dose-dependent manner. Similarly, Won et al. 12 reported that 3T3-L1 cells treated with C. fructus pharmacopuncture in a series of concentrations showed reduction in GPDH activity in a dose-dependent manner. During differentiation of preadipocytes to adipocytes, lipids accumulate in the cells. Decreases in TG contents by CFEEs administration indicate inhibition of differentiation.
The HFC group had a significantly higher weight gain than the N group in vivo, showing an induction of obesity. All the HFC groups (HFC, CL, and CH) showed weight losses after feeding CFP, regardless of food intake. Chon et al. 25 treated rats fed by a high-fat diet with 1.5% and 3.0% fermented vinegar for 6 weeks. This resulted in decreases in weight and FER in a dose-dependent manner compared with the control, whereas there was no significant difference in food intake. Thus, although CFP supplementation had no effect on food intake of obese rats induced by HFC diet, it still caused weight loss. This weight loss effect of CFP was caused by inhibition of lipid absorption by bioactive substances, including dietary fibers and polyphenols of C. fructus.
High-fat diet induced lipid accumulation in the liver, leading to weight gain, 26 and its long-term administration with high cholesterol induced liver hypertrophy. 27 Consistently, the HFC diet resulted in accumulation of excessive lipids and cholesterols in the liver, causing liver hypertrophy. Although the groups fed HFC diet with CFP supplementation (CL and CH) tended to have greater reduction in the liver tissue than the HFC group, there was no significant difference between them. These results are consistent with the report of Ban et al., 28 in which oral administration of boiled water extracts of C. fructus for 4 weeks to obese rats made no significant difference in the weight of the liver tissues compared with that of the control group, despite weight loss in liver tissue.
Serum ALT and AST are marker enzymes of liver damage from fatty liver caused by high-fat diet, high-cholesterol diet, and alcohol, or damage of liver tissue by hepatotoxicants which accelerates the release of these enzymes into the blood, leading to higher activities. 26 Similarly, the HFC diet also resulted in significant elevation of serum ALT and AST activities. Serum ALP activity is enhanced by biliary obstruction or liver diseases. In cases of severe hepatocyte disorders such as acute renal failure, hyperlipidemia, and pulmonary infarction, AST, ALT, and ALP activities are elevated together, which induces bile acid secretion disorders in the liver, resulting in elevations of serum cholesterol concentration. In addition, serum LDH is an enzyme involved in oxidation–reduction reactions at the final step of anaerobic glycolysis in the body, and it has been reported that LDH activity markedly increases in acute hepatitis, early liver cancer, myocardial infarction, pernicious anemia, and leukemia. In this study, serum ALT, AST, and LDH activities that were elevated by HFC diet decreased by CFP supplementation. It seemed that CFP delayed damage of hepatocytes caused by fatty liver under the HFC diet condition, so it is expected that CFP would be effective in preventing liver dysfunction and maintaining the liver function.
Cholesterol contained in animal fat at high levels causes elevation of LDL-C concentration, leading to elevation of TC level. 29 In this study, TC and TG contents in serum were significantly higher in the HFC group than in the N group. Park et al. 11 evaluated the effect of C. fructus fermented liquid diet for 6 weeks in rats fed a high-fat diet. This caused significant reductions in serum TG contents only in the high-dose group compared with the control. Chon et al. 25 administered 1.5% and 3.0% fermented C. fructus vinegar for 6 weeks to rats fed high-fat diet, which resulted in significant reduction in serum TG contents in all groups fed fermented C. fructus vinegar compared with the control, and significant reduction of serum TC contents only in the high-dose group. LDL-C contents that were elevated by HFC diet declined with CFP supplementation, and the reduced HDL-C contents increased. CFP seems to inhibit hyperlipidemia, which would be helpful for prevention of arteriosclerosis and cardiovascular diseases. All studies in high-fat diet fed rats treated with C. fructus extracts, 28 C. fructus-fermented liquid, 30 and fermented C. fructus vinegar 25 showed improvements in serum lipids.
TG contents in liver tissues became significantly higher in the HFC group than in the N group. It was speculated that although TGs synthesized in the liver were supposed to enter into very low-density lipoprotein (VLDL), VLDL produced in the liver was unable to be released to the plasma because of accumulation of TGs in the liver by HFC diet. 31 However, the groups with HFC diet and CFP supplementation (CL and CH) showed significant reductions in TG contents compared with the HFC group, and also showed a significant difference depending on CFP amount. In addition, observation of liver tissue morphologies revealed that fat globules in liver tissues of the HFC group showed a dense distribution, whereas the number of fat globules in the CL and CH groups decreased, which supported that CFP inhibited fat globule accumulation. These were similar to the results of studies in which C. fructus boiled water extract was orally administered to obese rats induced by high-fat diet resulting in significant reductions in total lipid, TG, and TC contents in liver tissues compared with the control. 28 Administration of C. fructus-fermented liquid 30 and fermented C. fructus vinegar 25 to rats with high-fat diet resulted in significant reductions in TG and TC contents in liver tissue depending on the dose. In this study, HFC diet increased TG and TC contents in serum and liver tissues, whereas CFP administration reduced TG and TC contents in serum and liver tissue.
Obesity is not caused by weight gain but by increased body fat. It is known that an increase in peritoneal adipose tissue, not subcutaneous fats, is a risk factor for health, as higher abdominal lipid contents are accompanied by a higher incidence of metabolic diseases even when body fat contents remain the same. 32,33 In this study, increased weights of subcutaneous, mesenteric, epididymal, and total adipose tissues by HFC diet were reduced by CFP administration. CFP administration significantly reduced TG and TC contents in mesenteric and epididymal adipose tissues of rats. CFP seems to have an antiobesity effect through inhibition of lipid accumulation in adipose tissues. Consistent with changes of weight and TG contents in adipose tissues, bigger sizes of epididymal adipocytes caused by HFC diet were inhibited by CFP diet, which confirmed that CFP has an inhibitory effect against increases in body fat that is induced by HFC diet. Polyphenols such as flavonoids and phenolic acids are known to reduce cholesterol, and it was reported that administration of 0.1% flavonoids reduced TC levels in plasma and liver significantly. 34 Among flavonoids of C. fructus, quercetin is known to have various effects, including antioxidant, anti-inflammatory, anticancer, inhibition of lipid peroxidation, inhibition of cholesterol synthesis, reduction of adipogenesis, and regulation of adipogenesis. 35 Also, dietary fibers inhibit intestinal lipid absorption, elevate bile acid synthesis, 36 and decompose fatty acids in the large intestine. This inhibits endogenous cholesterol synthesis, leading to improvement of hyperlipidemia in humans and animals.
Conclusion
CFEEs inhibited in vitro differentiation of 3T3-L1 cells and reduced accumulation of TGs. CFP administration along with HFC diet reduced lipid contents of serum, liver, and adipose tissues along with weight losses of body and adipose tissues. Therefore, it was determined that C. fructus improves lipid metabolism in the body and inhibits lipid accumulation, leading to potent antiobesity effects.
Footnotes
Acknowledgment
This work was supported by the National Academy of Agricultural Science (Code PJ01180502), Rural Development Administration, Republic of Korea.
Author Disclosure Statement
No competing financial interests exist.