
Abstract
The aim of this study was to investigate whether fermented Platycodon grandiflorum (FPG) inhibits lipid accumulation in 3T3-L1 adipocytes and mice with high-fat diet (HFD)-induced obesity. We evaluated the effect of FPG on antiadipogenic activity via regulation of peroxisome proliferator-activated receptor gamma (PPARγ) and CCAAT/enhancer-binding protein alpha (C/EBPα), as well as protein expression of their target genes, fatty acid binding protein 4 (FABP4). We further examined the antiobesity effects of FPG on HFD-induced obesity in mice. The FPG was orally administered to mice with a HFD at 50, 100, or 200 mg/kg/day for 8 weeks. Our results show that FPG significantly inhibited fat accumulation during 3T3-L1 adipogenesis through downregulating adipogenic transcript factors. Moreover, FPG markedly reduced the final body weight with a decrease in epididymal adipose tissue mass and adipocyte size compared with the untreated HFD-induced group. The effects of FPG on HFD-induced obesity were primarily responsible for inhibiting adipogenesis in adipose tissue and regulating lipid metabolism, such as through lipogenesis and fatty acid oxidation. Additionally, FPG ameliorated serum total cholesterol, triglyceride, and low-density lipoprotein cholesterol levels. Hence, FPG may be an alternative treatment for controlling obesity through downregulating lipid accumulation.
Introduction
I
Adipose tissue development is closely related to adipocyte differentiation. 4 This process occurs in several stages and involves a cascade of adipogenesis- and lipogenesis-related proteins. Therefore, inhibiting adipogenesis and lipogenesis is key to treating obesity. 5 Several hormones and growth factors have been identified that affect adipogenesis and lipogenesis in a positive or negative manner. Many different nuclear factors influence the adipogenic process, including the early markers CCAAT/enhancer-binding protein alpha (C/EBPα) and peroxisome proliferator-activated receptor gamma (PPARγ), as well as sterol regulatory element-binding protein-1c (SREBP-1c). 6 Increased expression of PPARγ and C/EBPα induces adipocyte differentiation and transactivates downstream target genes, such as fatty acid synthase (FAS) and fatty acid binding protein 4 (FABP4), which are involved in maintaining the adipocyte phenotype. This increased expression also activates expression of adipocyte-specific proteins, such as adiponectin. 7 –9 Fatty acid β-oxidation largely occurs in mitochondria and peroxisomes for lipid utilization. Mitochondrial PPARα target enzymes involved in fatty acid β-oxidation include carnitine palmitoyltransferase 1 (CPT-1), which catalyzes entry of long-chain fatty acyl-CoA into mitochondria. 10 In addition, elevated serum triglyceride (TG), total cholesterol (TC), and low-density lipoprotein cholesterol (LDL-c) levels induce elevated blood lipid concentrations. 11 Moreover, excessive levels of free radicals produce oxidative stress in cells, and oxidative stress plays a critical role in various diseases. 12 Several methods have been developed to evaluate the antioxidant capacity of natural substances, including nitroblue tetrazolium (NBT) assays. 13 Therefore, various assays are required to evaluate the antiobesity activity of natural medicinal foods.
Platycodon grandiflorum (PG) is a perennial plant of the Campanulaceae family. FG is an oriental herb that improves insulin resistance and lipid profiles of rats with diet-induced obesity. The roots of PG are widely used in traditional oriental medicine as an expectorant for hyperlipidemia, hypertension, and diabetes. Furthermore, certain studies have reported antiobesity activity for PG. 14 –16 However, the effect of fermented Platycodon grandiflorum (FPG), by Lactobacillus rhamnosus HK-9, on obesity markers in cell and rodent models has not been reported. In general, fermentation is efficient at improving its biological activities. 17 The aim of this study was to evaluate the antiobesity activity of FPG on lipid accumulation in 3T3-L1 adipocytes and HFD-induced mouse.
Materials and Methods
Cell line and materials
The 3T3-L1 preadipocytes were obtained from American Type Culture Collection (ATCC, CL-173, Manassas, VA). Dulbecco's modified Eagle's medium (DMEM), phosphate buffered saline (PBS), and trypsin-EDTA were purchased from Lonza (Walkersville, MD). Bovine calf serum (BCS), fetal bovine serum (FBS), penicillin–streptomycin (P/S), and insulin were purchased from Gibco (Gaithersburg, MD). Dexamethasone (DEX), 3-isobutyl-1-methylxanthine (IBMX), methylthiazolyldiphenyl-tetrazolium bromide (MTT), Oil red O (ORO), and NBT were purchased from Sigma (St. Louis, MO). Unless noted, all other chemicals were purchased from Sigma.
Preparing the FPG extract
PG was purchased from the local market (Chuncheon, Korea). PG (1 kg) was extracted with water (10 L) at 97°C ± 2°C three times for 8 h in an extractor (Habdong Co. Ltd., Anyang, Korea) under thermal reflux. Thereafter, the mixtures were centrifuged at 10,000 g for 10 min. The supernatant was collected and filtered using a polytetrafluoroethylene membrane (0.45 μm), concentrated using a vacuum evaporator (Rotavapor R-220; Büchi, Flawil, Switzerland), and then freeze-dried (Bondiro; Il Shin Lab Co., Seoul, Korea) to obtain powder. The microorganism used to prepare the FPG extract was L. rhamnosus HK-9 from the Korean Culture Center of Microorganisms (KCCM11254P, Seoul, Korea). The microorganisms were precultured in de Man Rogosa and Sharpe (MRS) broth medium containing 0.05%
Cell culture
The 3T3-L1 preadipocytes were cultured in DMEM with 10% BCS at 37°C in 5% CO2 in 12-well plates and allowed to reach full confluence. After the cells reached confluence, they were incubated for an additional 2 days (Day 0). The cells were then differentiated with DMEM containing 1% P/S, 10% FBS and a hormonal mixture (MDI) consisting of 0.5 mM IBMX, 1 μM DEX, and 5 μg/mL insulin for 2 days (Day 2), which was followed by culturing with DMEM containing 1% P/S, 10% FBS, and 5 μg/mL insulin (Day 5). After inducing for 5 days, the medium was changed to DMEM with 1% P/S and 10% FBS (Day 7). At day 7, the cells were harvested.
Cell viability assay
The 3T3-L1 preadipocytes were seeded in 24-well plates and incubated for 24 h at 5% CO2. After 24 h, the preadipocyte medium was exchanged for a medium with different PG and FPG concentrations (100–300 μg/mL) for 24 h or 7 days. Next, 200 μL MTT solution was added to the cell culture. After 3 h, the absorbance was measured at 570 nm using a microplate reader (Thermo Fisher Scientific, Waltham, MA).
ORO staining
The cells were carefully washed twice with PBS and then fixed with 4% formaldehyde for 1 h. After removing the formaldehyde, the cells were thoroughly washed with 60% isopropanol. The cells were stained with the ORO solution (6:4, ORO dye:distilled water) for 40 min and washed with water. For a quantitative analysis, the ORO was used with 100% isopropanol, and the absorbance was measured at 570 nm using a microplate reader.
Reactive oxygen species production in 3T3-L1 cells
Intracellular reactive oxygen species (ROS) production was determined by NBT assay during adipogenesis. The NBT was reduced by ROS to a dark-blue formazan. On day 7 after induction, the cells were incubated for 90 min in PBS containing 0.2% NBT. Formazan was dissolved in 50% acetic acid, and the absorbance was determined at 570 nm.
Analysis of the 3T3-L1 cell protein levels
The protein levels were analyzed using the PRO-PREP protein extraction solution (iNtRON Biotechnology, Seongnam, Korea). The total cell lysates were centrifuged at 12,000 g and 4°C for 30 min, and the supernatant was collected. The cell protein concentration was determined using a Pierce bicinchoninic acid (BCA) protein assay kit (Thermo Scientific, Loughborough, United Kingdom). Ten micrograms of protein extract was dissolved in 2 × sample buffer and heated for 5 min at 95°C before sodium dodecyl sulfate/polyacrylamide gel electrophoresis (SDS-PAGE, 10%). The protein extracts were loaded in a 10% SDS-PAGE gel and transferred to polyvinylidene difluoride (PVDF) membranes at 100 V for 90 min. The membrane was then blocked for 1 h, incubated with a primary antibody at 4°C overnight, and rinsed in 1 × TBST for 10 min five times. After rinsing in 1 × TBST, the membrane was incubated with a secondary antibody for 1 h and rinsed in 1 × TBST for 10 min five times. Antibodies for PPARγ, C/EBPα, and FABP4 were obtained from Cell Signaling Technology (Beverly, MA). The horseradish peroxidase (HRP)-conjugated secondary antibodies were detected using a Luminata™ Forte Western HRP Substrate (Millipore Japan, Tokyo, Japan) in accordance with the manufacturer's directions. For all image analyses, the data were calculated using the ImageJ image analysis software.
Experimental animals
This animal study was conducted in conformity with protocols approved by the Committee on the Ethics of Animal Experiments of Hallym University (IRB No. 2014-91). The animals were 5-week-old male C57BL/6J mice purchased from Central Lab Animal, Inc. (Seoul, Korea). The mice were housed at 24°C ± 5°C and 55% ± 5% humidity under a 12-h light/12-h dark cycle. The mice were provided free access to their diet and water for 10 weeks, and their body weights and food intakes were measured every other day. The diets were normal diet (ND; 20% protein, 70% carbohydrate, 10% fat, by Research Diets, Inc., No. D12450B) and high-fat diet (HFD; 20% protein, 20% carbohydrate, 60% fat, by Research Diets, Inc., No. D12492). After inducing obesity with a HFD for 2 weeks, the mice were randomly divided into six groups: ND (n = 8), HFD (n = 8), HFD and 200 mg/kg/day PG (HFD-P200, n = 8), HFD and 50 mg/kg/day FPG (HFD-F50, n = 8), HFD and 100 mg/kg/day FPG (HFD-F100, n = 8), and HFD and 200 mg/kg/day FPG (HFD-F200, n = 8). The PG and FPG were dissolved in distilled water and orally administered once a day for 8 weeks.
Measuring serum biochemical parameters
At the end of the experimental period, the mice were fasted for 12 h, blood samples were collected from the retro–orbital venous plexus and centrifuged at 3500 g for 20 min, and serum was obtained and stored at −70°C before the analyses. The TG, TC, LDL-c, glucose (GLU), alanine aminotransferase (ALT), and aspartate aminotransferase (AST) levels were all assayed using an automatic analyzer (Konelab 20XT; Thermo Fisher Scientific).
Measuring organ weight
After blood sampling, the epididymal, liver, and kidney tissue was dissected out and weighed. The epididymal tissue was immediately frozen in liquid nitrogen and stored at −80°C until the protein levels were measured using an immunoblotting analysis.
Immunoblotting analysis
The epididymal adipose tissue was homogenized in PRO-PREP lysis buffer containing 1.0 mM PMSF, 1.0 mM EDTA, 1 μM pepstatin, 1 μM leupeptin, and 1 μM aprotinin. After separating the lysed protein extract using SDS-PAGE, a common immunoblotting analysis was performed. Antibodies for PPARγ, C/EBPα, SREBP-1c, adiponectin, FABP4, FAS, and CPT-1 were obtained from Cell Signaling Technology. The target proteins were detected using a Luminata Forte Western HRP Substrate in accordance with the manufacturer's directions.
Histological analysis of adipose tissue
Frozen epididymal adipose tissue was fixed in 4% paraformaldehyde and embedded in paraffin. Epididymal adipose tissue sections were prepared at 7 μM. The sections were stained with hematoxylin and eosin to examine the morphology.
Statistical analysis
The results are reported as the mean ± standard deviation of triplicate experiments. Statistical comparisons were performed using a GLM (general linear model) of SAS (SAS Institute, Cary, NC) and Duncan's multivariate test. The differences between means were considered statistically significant when P < .05.
Results
Effect of PG and FPG on cell viability
We investigated preadipocyte cytotoxicity at different PG and FPG concentrations (100–300 μg/mL). As shown in Figure 1A, treatments with different PG and FPG concentrations showed no significant effect on cell viability. We further investigated PG and FPG cytotoxicity at various concentrations (100–300 μg/mL) using mature fat cells (Fig. 1B). The PG and FPG concentrations showed no cytotoxicity up to 300 μg/mL. Therefore, we used these extracts at 200 μg/mL in the following experiments.
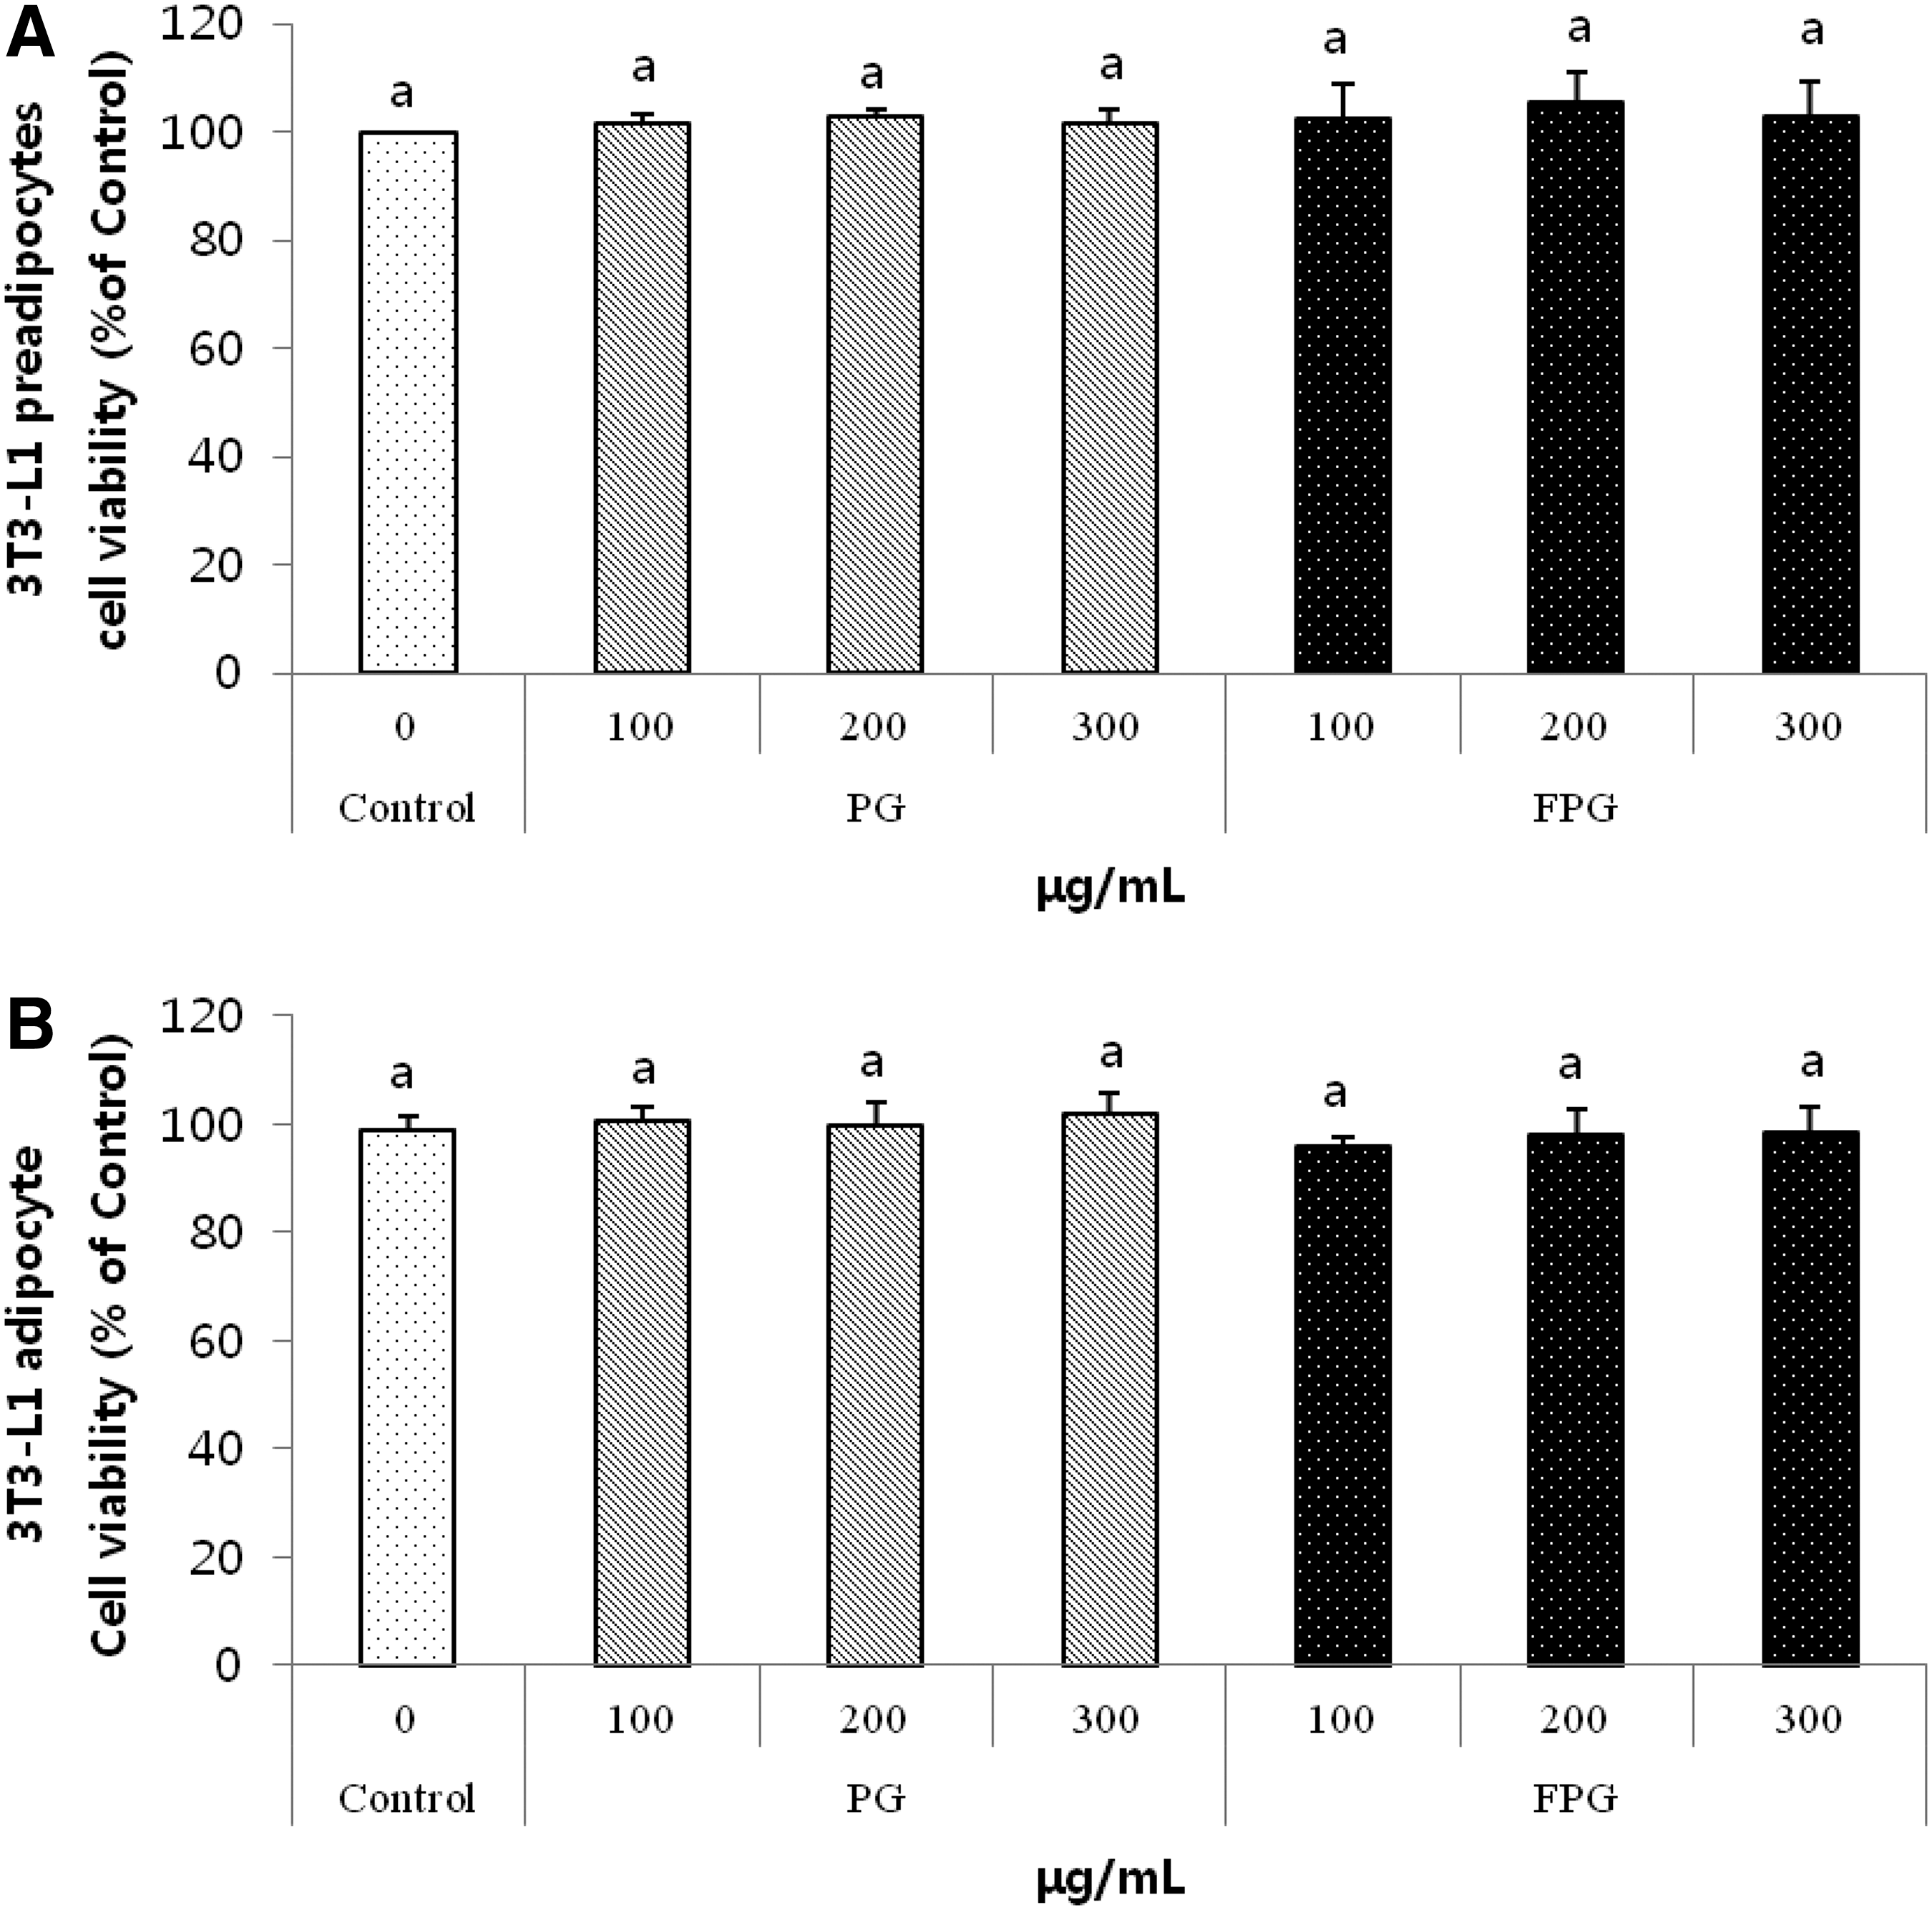
The effects of PG and FPG on 3T3-L1 preadipocyte or mature adipocyte viability.
PG and FPG inhibit lipid accumulation and ROS production
As shown in Figure 2A and B, treatment with 100 μg/mL of FPG slightly decreased lipid accumulation compared with MDI-treated control cells. However, lipid accumulation in cells treated with PG at 100 μg/mL did not significantly differ from the MDI-treated control cells. The cells treated with 200 μg/mL of PG and FPG both significantly reduced lipid accumulation by 7% and 20% compared with MDI-treated control cells. In addition, intracellular ROS production significantly decreased in the cells treated with FPG (200 μg/mL) compared with MDI-induced control cells. As mentioned above, lipid accumulation in the cells treated with FPG (200 μg/mL) paralleled the decreased ROS production in adipocytes (Fig. 3).

The effects of PG and FPG on lipid accumulation in 3T3-L1 adipocytes.
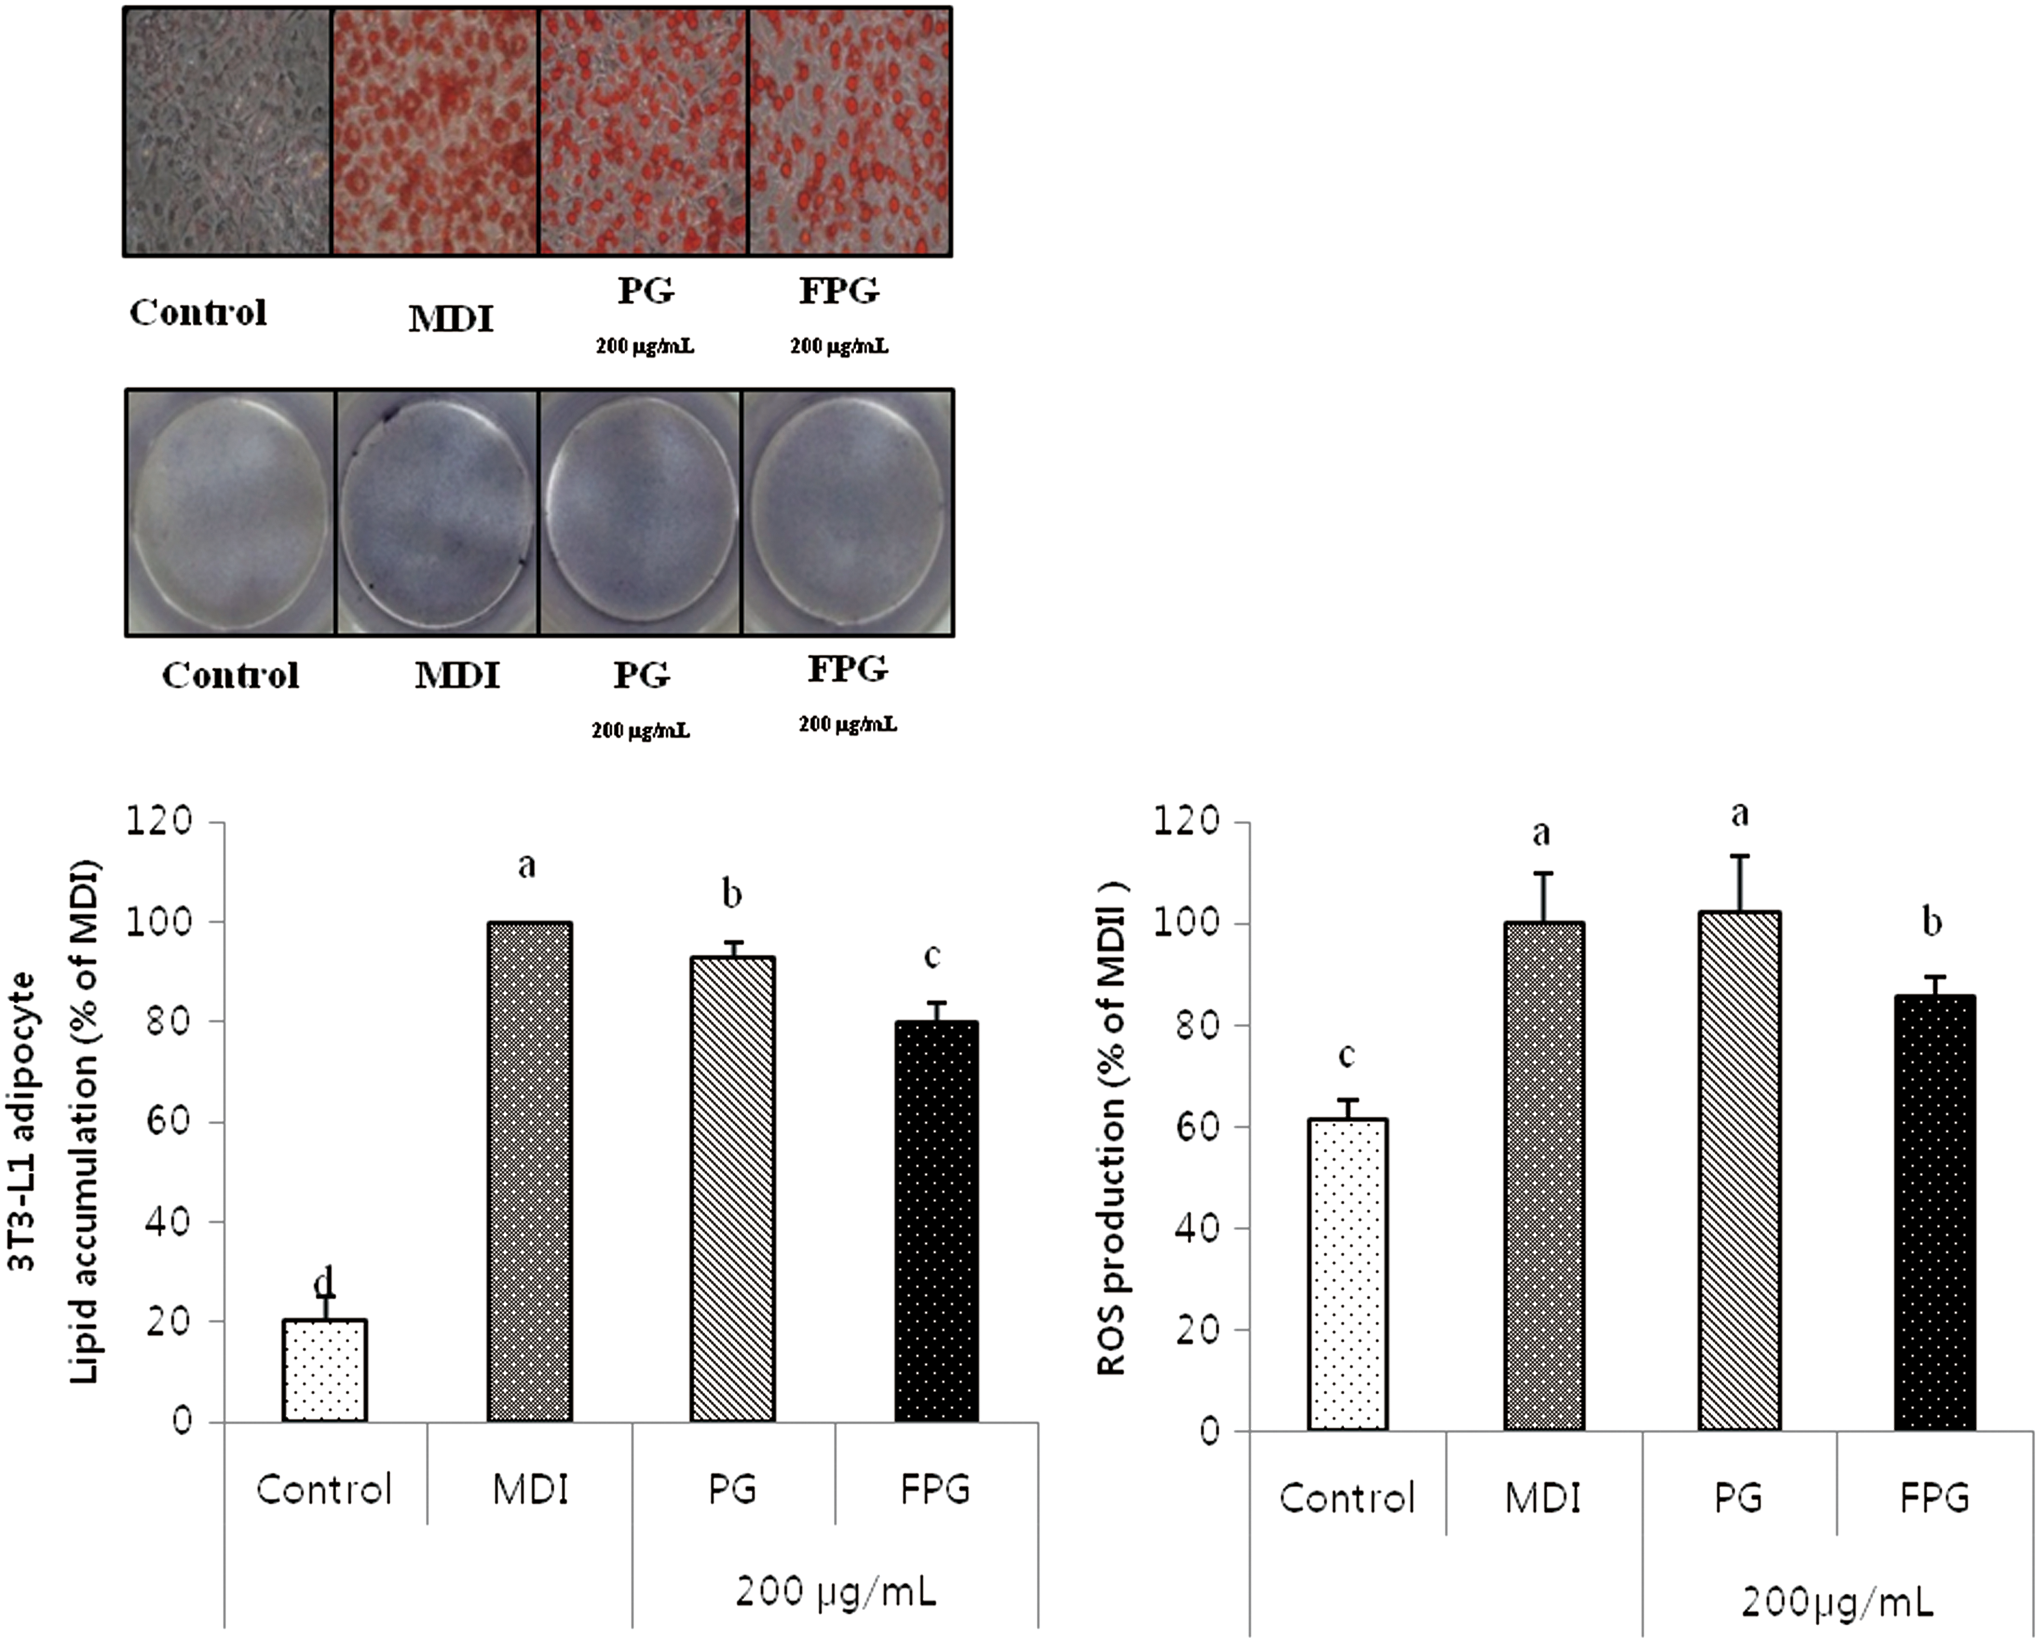
The effects of PG and FPG on lipid accumulation and ROS production. The 3T3-L1 adipocytes were cultured during differentiation (for 7 days) treatments with 200 μg/mL. The NBT assay was used to measure ROS production and determined using nitrotetrazolium blue chloride and the absorbance at 570 nm. The values are expressed as the mean ± SD. a–dThe differences between means were considered statistically significant when P < .05. NBT, nitroblue tetrazolium; ROS, reactive oxygen species. Color images available online at
Effects on adipogenic transcription factors
We investigated the influence of adipogenic transcription factors in the presence or absence of PG and FPG (Fig. 4). Treatment with FPG extract significantly downregulated protein expressions of both PPARγ and C/EBPα, which are key transcription factors during early adipogenesis. The FPG treatment also inhibited FABP4 protein expression, which is a PPARγ-targeted gene at a later adipogenesis stage. Based on the data, FPG likely inhibits lipid accumulation during adipogenesis by downregulating adipogenic-related proteins.
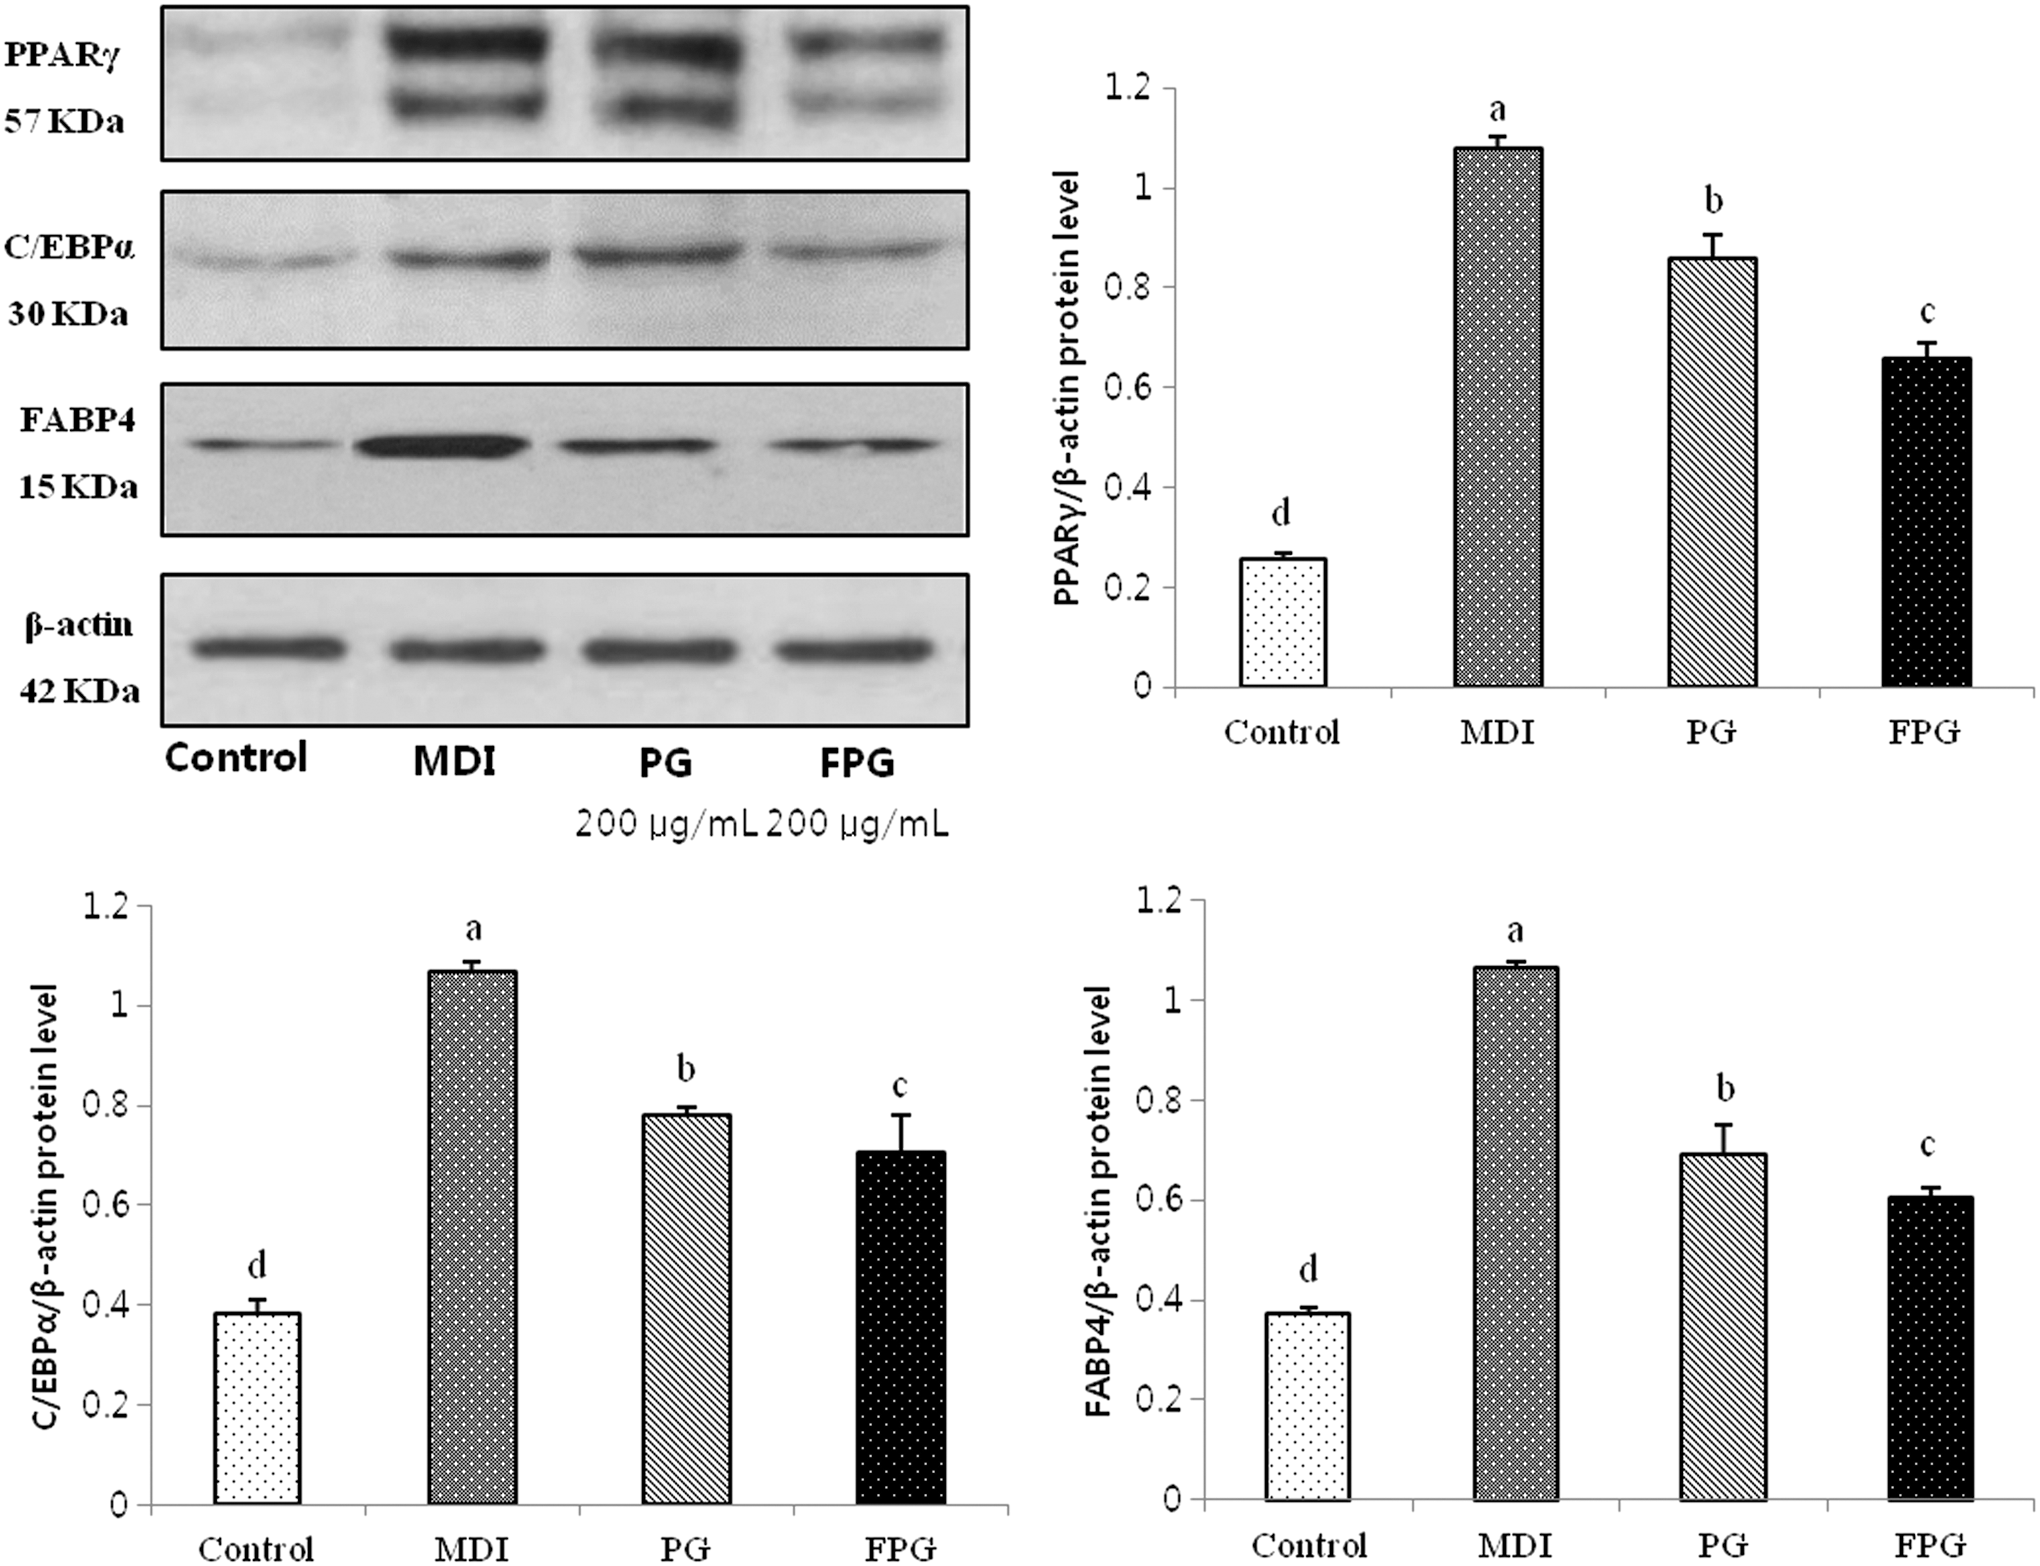
The effects of PG and FPG on adipocyte marker expression in 3T3-L1 adipocytes. The 3T3-L1 preadipocytes were differentiated into adipocytes in MDI medium in the absence or presence of 200 μg/mL PG and FPG for 7 days. The PG and FPG inhibited the expression of adipocyte-specific transcription factors during differentiation. The values are expressed as the mean ± SD. a–dThe differences between means were considered statistically significant when P < .05.
Effect of PG and FPG on body weight gain
To investigate PG and FPG antiobesity effects, the HFD-P200, HFD-F50, HFD-F100, and HFD-F200 groups were orally administered PG (200 mg/kg/day) and FPG (50, 100, and 200 mg/kg/day, respectively) for 8 weeks. At week 10, the final body weights of the mice fed the HFD significantly increased compared with mice fed the ND (Fig. 5). Furthermore, the body weight gain for the HFD-F200 group was significantly lower compared with the HFD group. However, food intake and water consumption did not differ significantly between the HFD and HFD-FPG groups (Table 1). We suggest that the antiobesity effects of the FPG extract were not mediated by reduced food and water consumption. Animals treated with PG and FPG appeared healthy and showed no abnormalities during the treatment period.
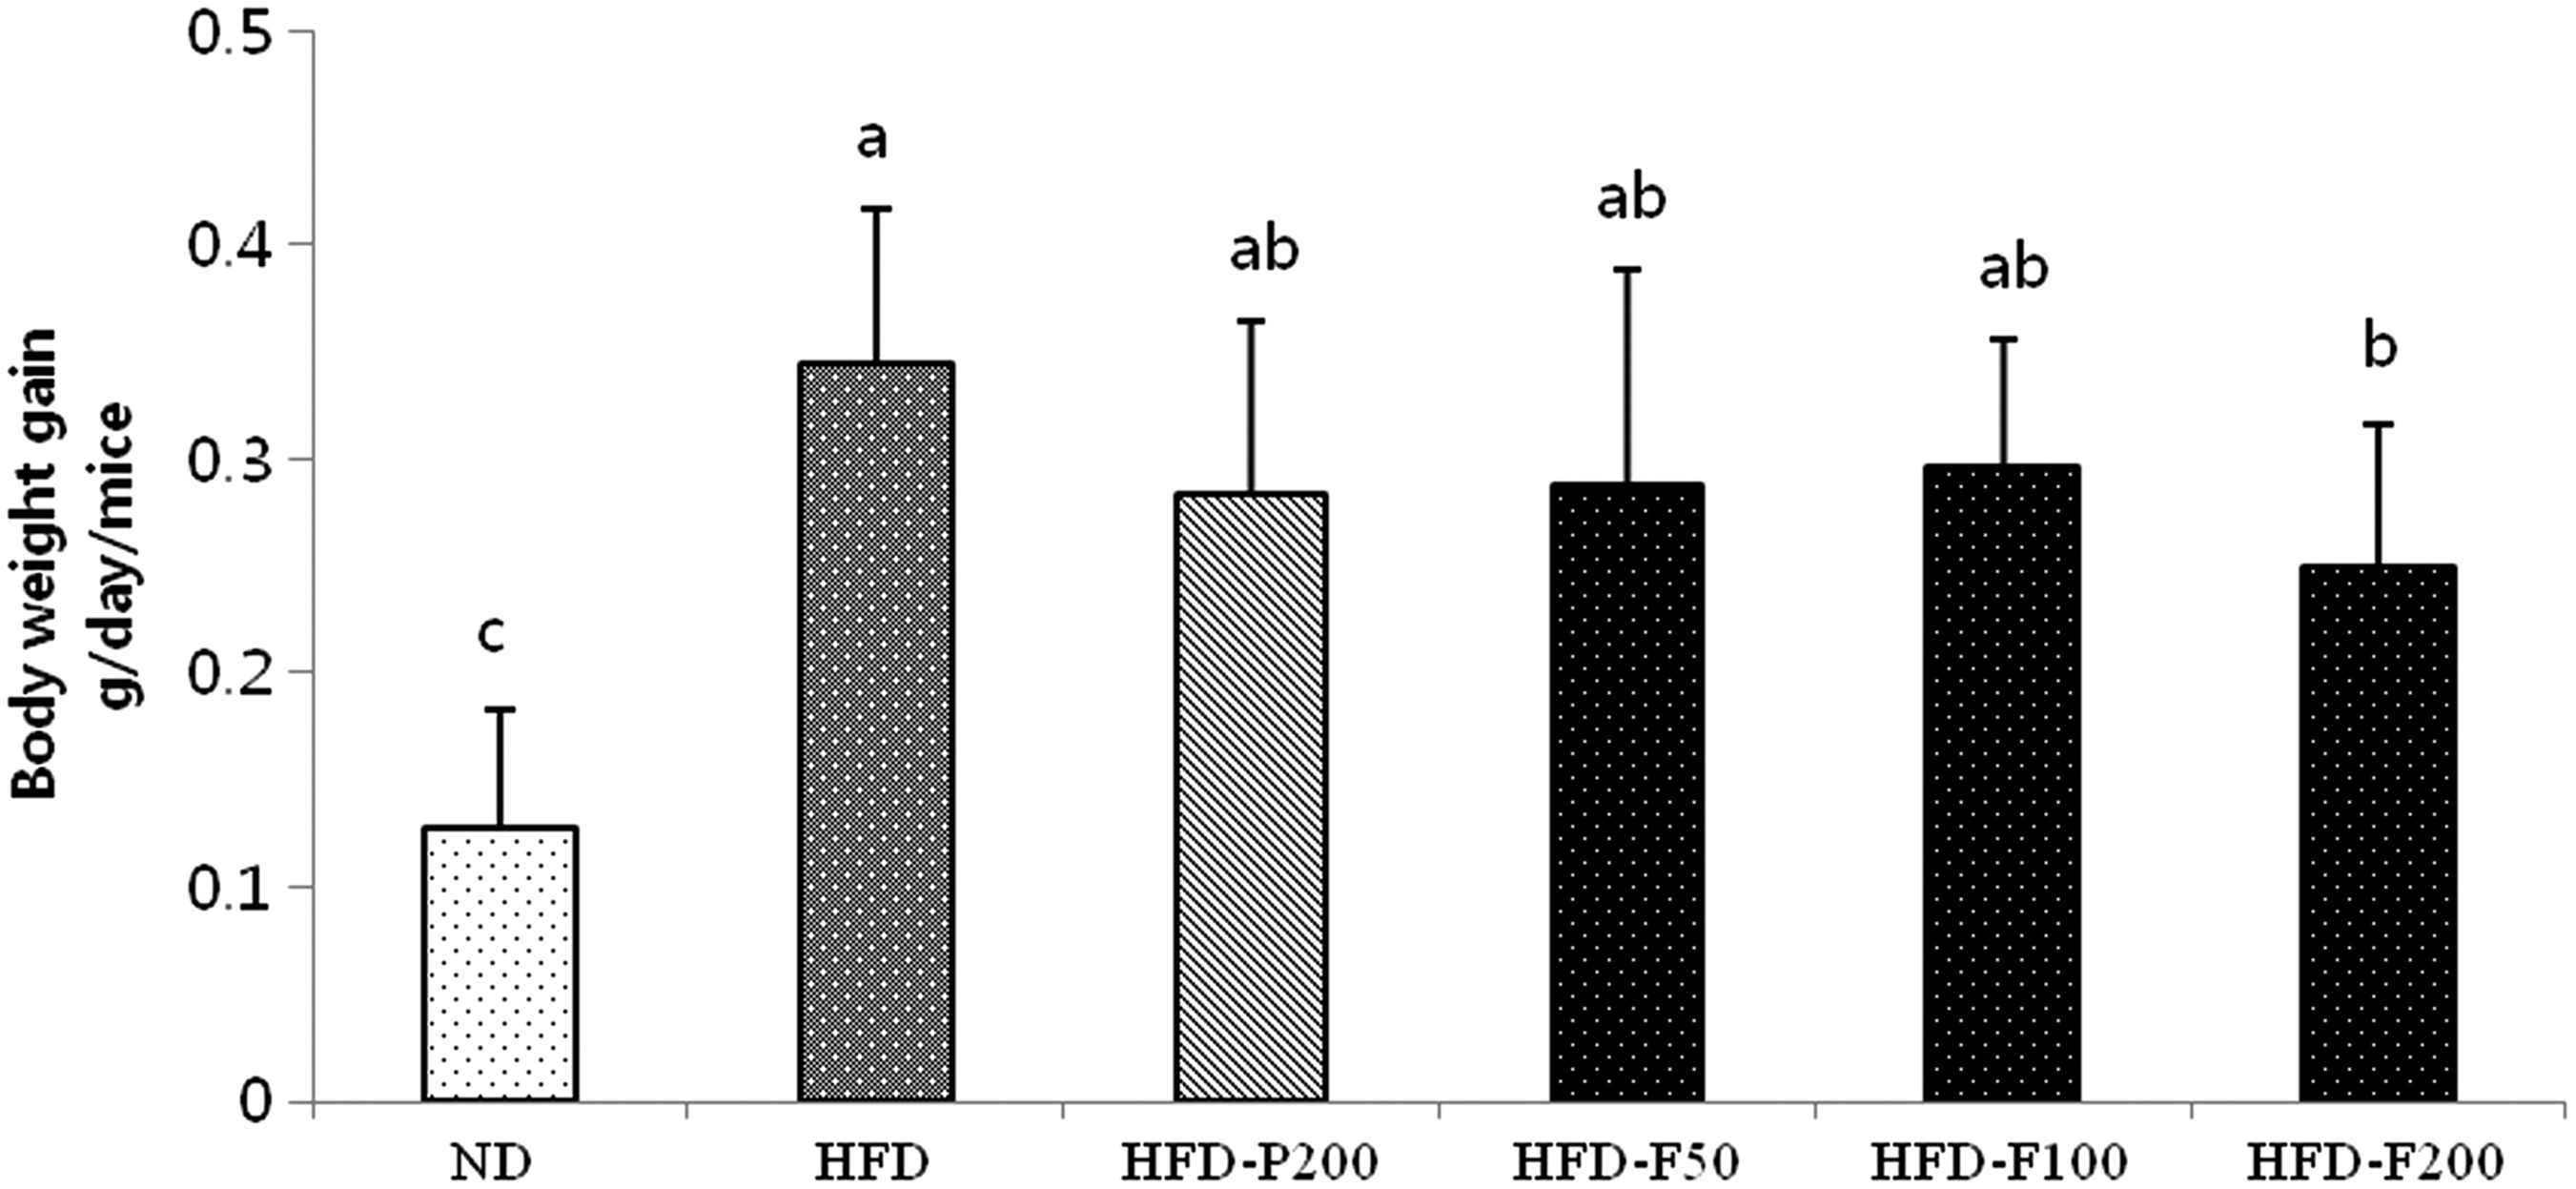
The effects of PG and FPG on body weight gain. Change in body weight from the initial week until the final week. The values are expressed as the mean ± SD. a–cThe differences between the means were considered statistically significant when P < .05. HFD, high-fat (60% fat) diet-induced mouse obesity mice group; HFD-F100, high-fat diet-induced mouse obesity group, which was orally treated with 100 mg/kg/day FPG; HFD-F200, high-fat diet-induced mouse obesity group, which was orally treated with 200 mg/kg/day FPG; HFD-F50: high-fat diet-induced mouse obesity group, which was orally treated with 50 mg/kg/day FPD; HFD-P200: high-fat diet-induced mouse obesity group, which was orally treated with 200 mg/kg/day PG; ND, normal diet mice group (10% fat).
The values are expressed as the mean body weight. a–cThe differences between the means were considered statistically significant when P < .05.
FPG, fermented Platycodon grandiflorum; ND, normal diet mice group (10% fat); HFD, high-fat (60% fat) diet-induced mouse obesity group; HFD-F100, high-fat diet-induced mouse obesity group, which was orally treated with 100 mg/kg/day FPG; HFD-F200, high-fat diet-induced mouse obesity group, which was orally treated with 200 mg/kg/day FPG; HFD-F50, high-fat diet-induced mouse obesity group, which was orally treated with 50 mg/kg/day FPG; HFD-P200, high-fat diet-induced mouse obesity group, which was orally treated with 200 mg/kg/day PG; PG, Platycodon grandiflorum.
Effects of PG and FPG on relative organ weight and histopathological changes in epididymal adipose tissues
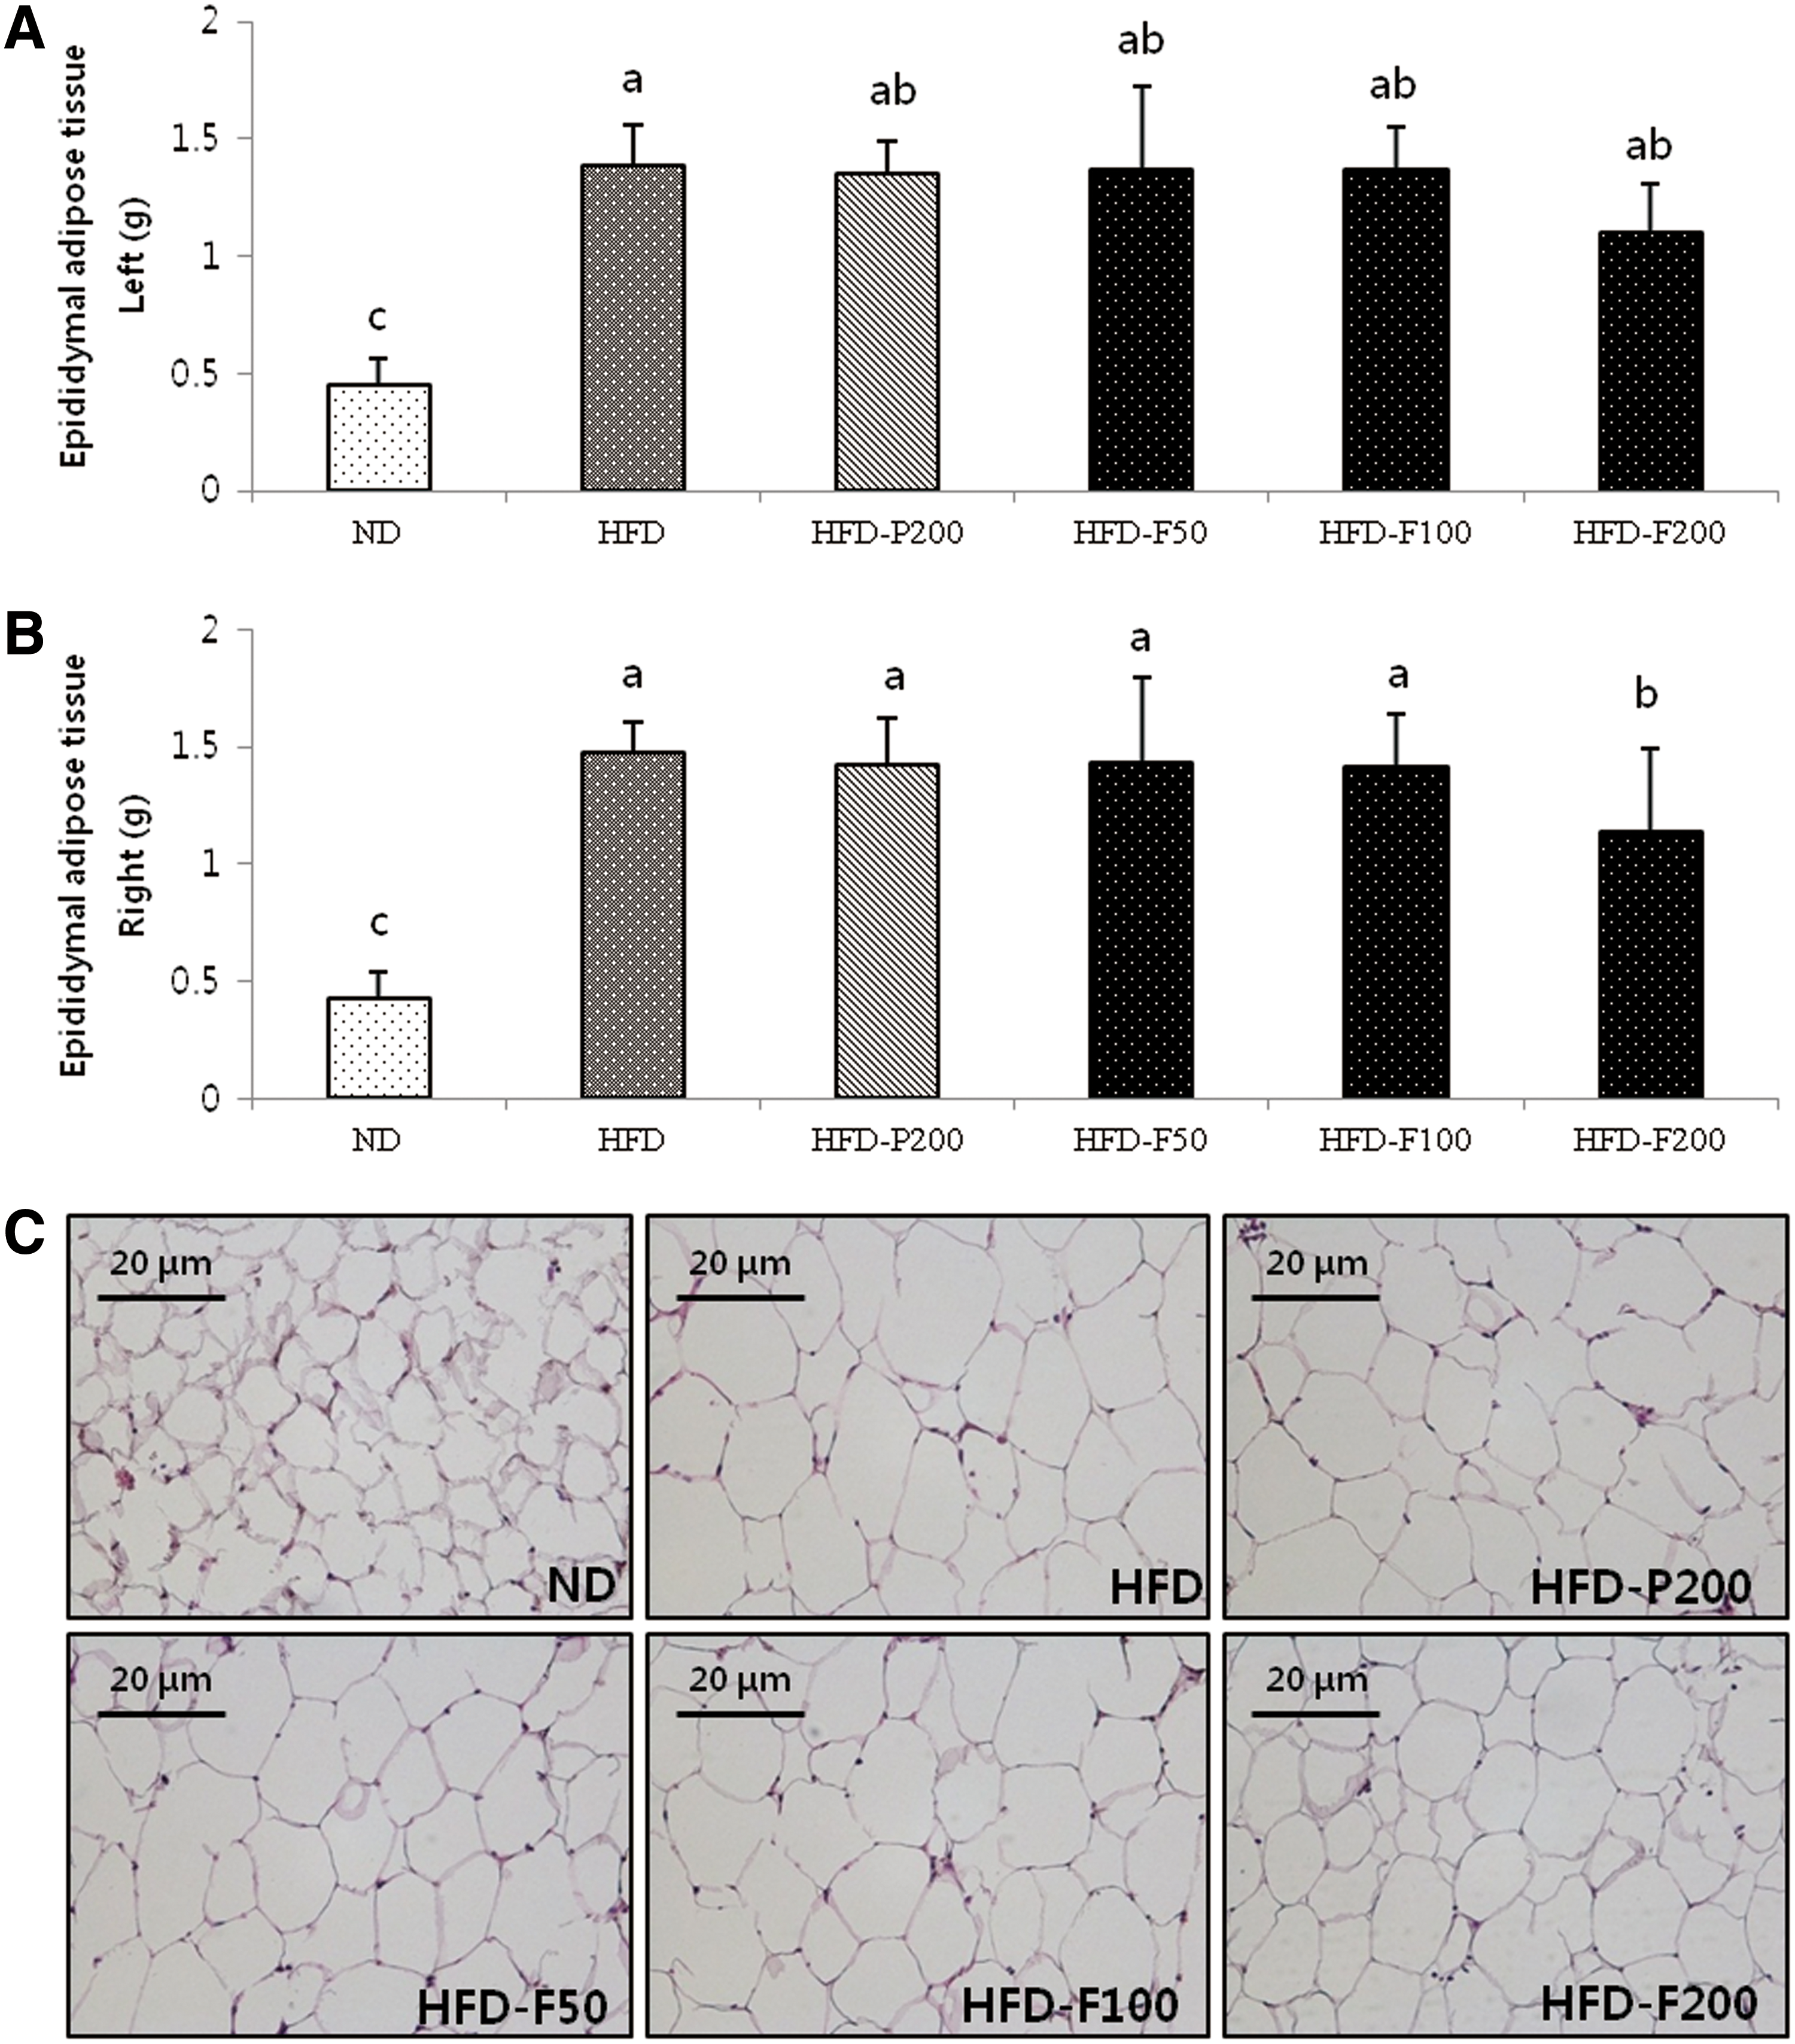
After 10 weeks, the kidney, liver, and epididymal adipocyte weights were measured. The mouse kidney weights did not change among the groups (Table 2). The relative liver weights in the HFD group, which were significantly greater than the ND group, dramatically reduced when the mice were administered FPG (Fig. 6). The relative epididymal adipose tissue weights of the HFD group were significantly greater than the ND group but significantly decreased when the mice were administered 200 mg/kg/day FPG. Consistent with these results, the adipose tissue size decreased in the HFD-P200 and HFD-FPG (50, 100 mg/kg/day, respectively) groups compared with the HFD group. These observations indicate that the PG- and FPG-mediated decreases in body weight can be attributed to a decrease in epididymal adipose tissue mass (Fig. 7A, B). The epididymal adipocyte size for each group is shown in Figure 7C. The HFD group adipocyte size was significantly greater than in the other groups. In addition, the HFD-F200 group adipocyte size was lower compared with the HFD-P200, HFD-F50, and HFD-F100 groups.
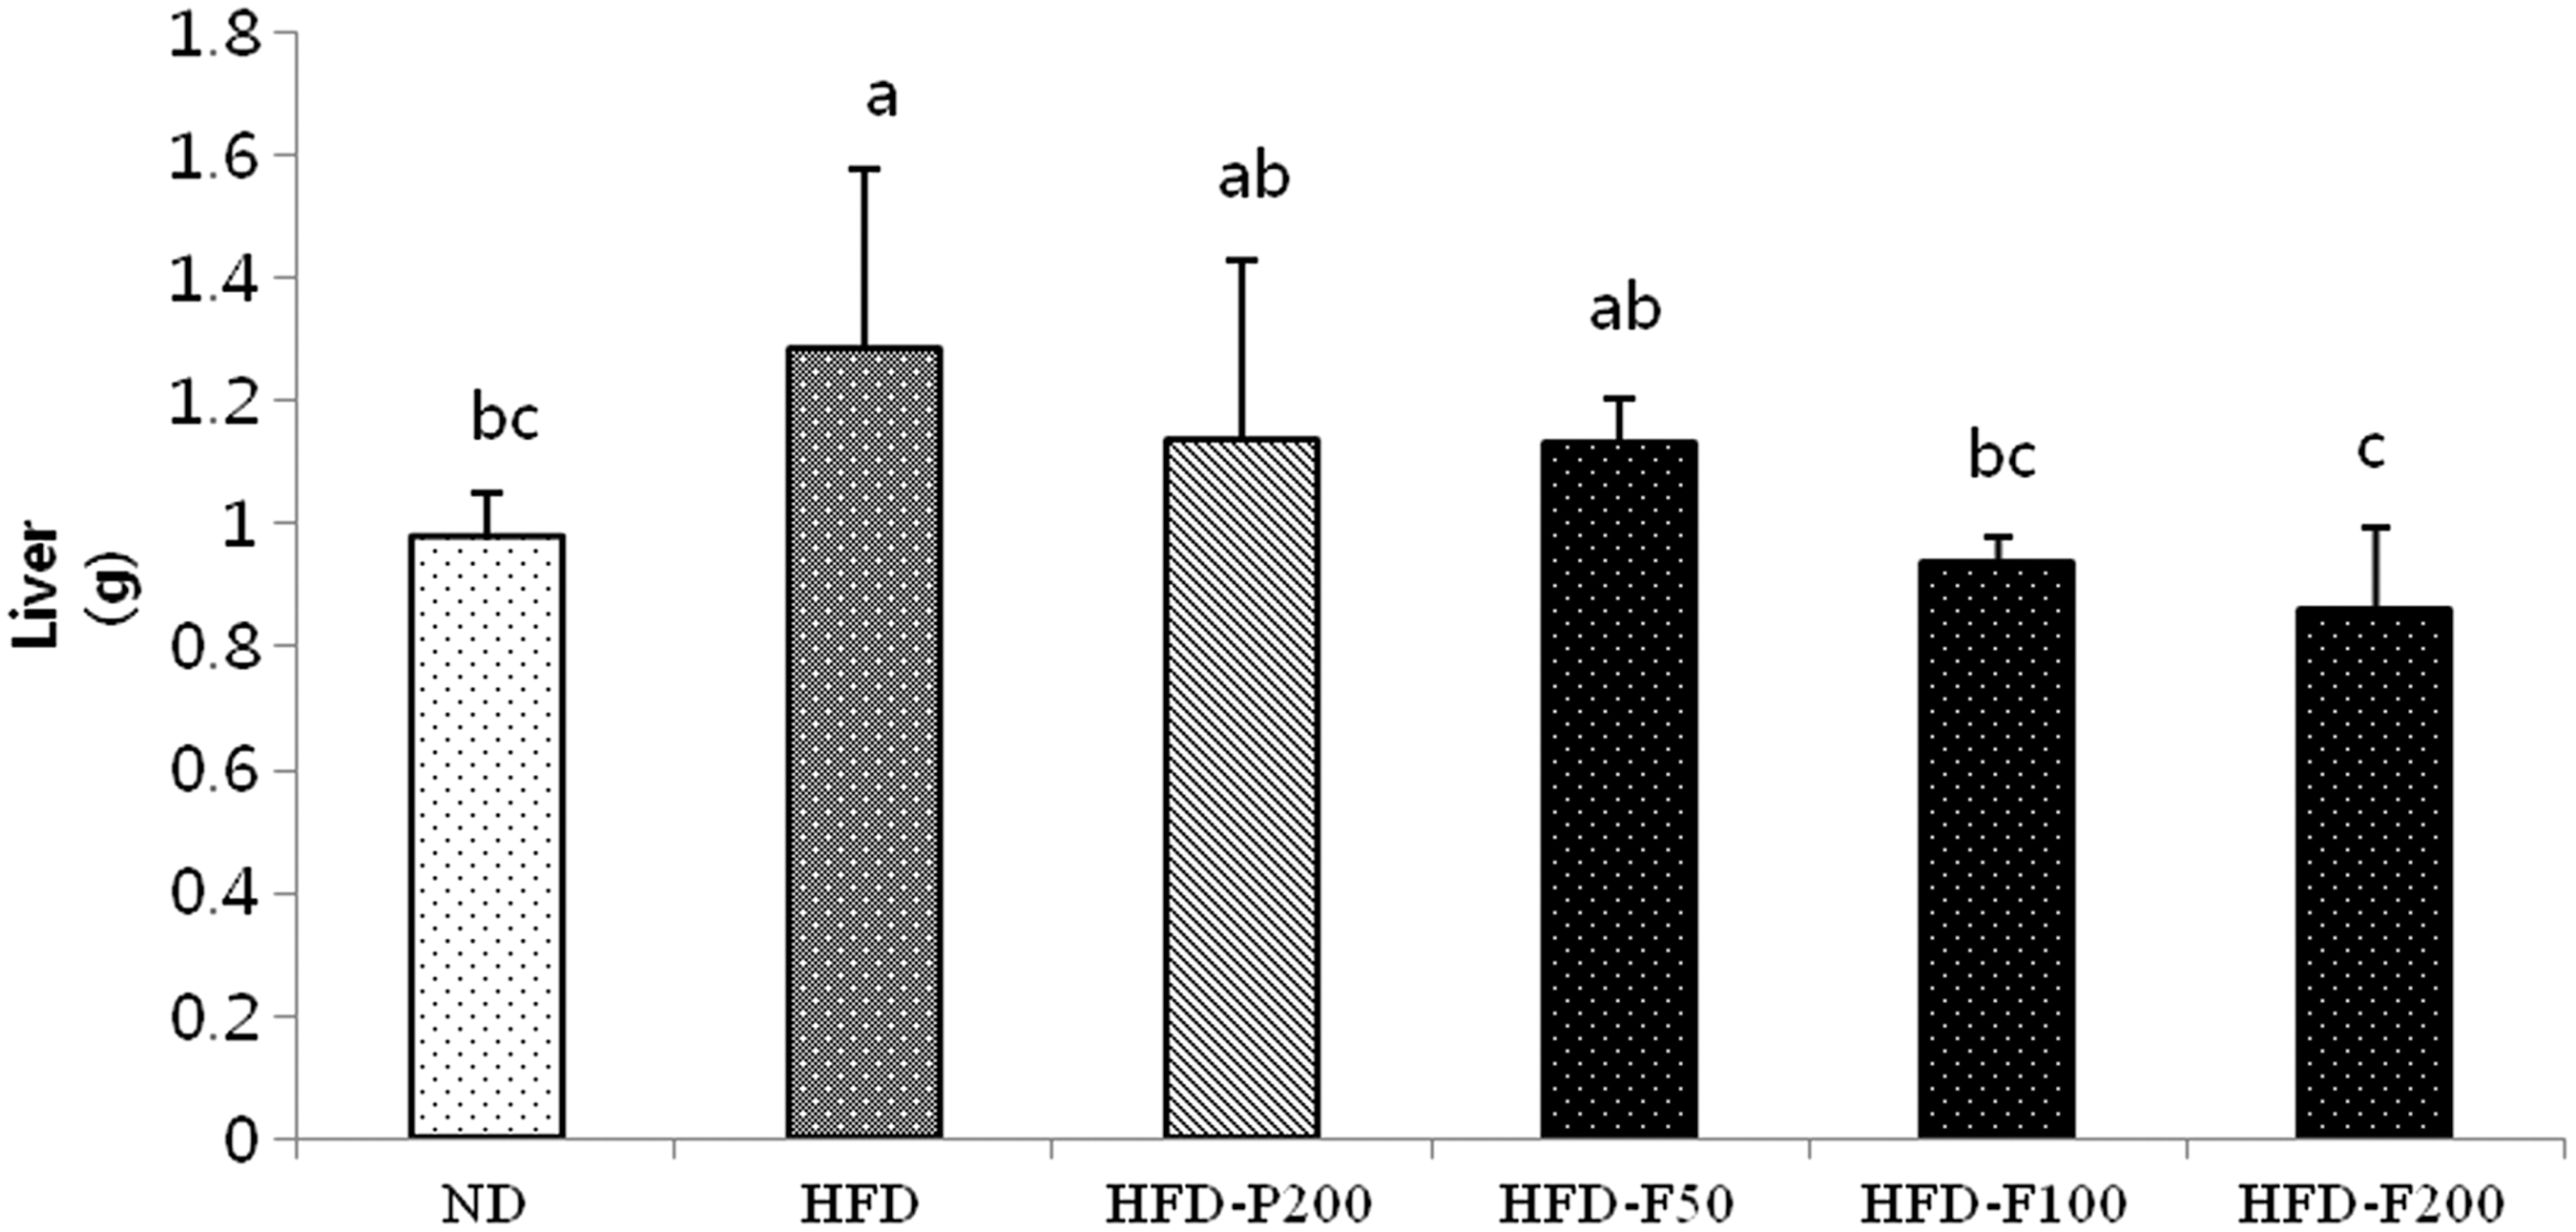
The effects of PG and FPG on relative organ weight in HFD-induced mouse obesity groups. The mouse livers were obtained after the mice fasted for 15 h at the end of the study. The values are expressed as the mean ± SD. a–cThe differences between means were considered statistically significant when P < .05.
The effects of PG and FPG extracts on organ weight and size in HFD-induced mouse obesity groups.
Kidneys were obtained from mice after fasting for 15 h at the end of the study. The values are expressed as the mean ± SD. aThe differences between means were considered statistically significant when P < .05.
SD, standard deviation.
Effects of PG and FPG on the biochemical parameters of plasma
The blood plasma parameter changes are shown in Table 3. The TG, TC, LDL-c, GLU, ALT, and AST levels in mice fed a HFD were significantly higher compared with mice fed ND. The HFD-PG and HFD-FPG (200 mg/kg/day) groups slightly lowered ALT and AST levels, which are hepatic toxicity markers, compared with the ND group. Moreover, the TG, TC, LDL-c, and GLU concentrations were remarkably lower when HFD-FPG (200 mg/kg/day) was administered compared with the HFD group.
The values are expressed as the mean ± SD for each group. a–dThe differences between the means were considered statistically significant when P < .05.
ALT, alanine aminotransferase; AST, aspartate aminotransferase; GLU, glucose; LDL-c, low-density lipoprotein cholesterol; TC, total cholesterol; TG, triglyceride.
Effect of PG and FPG on lipid metabolism-related signaling in epididymal adipose tissue
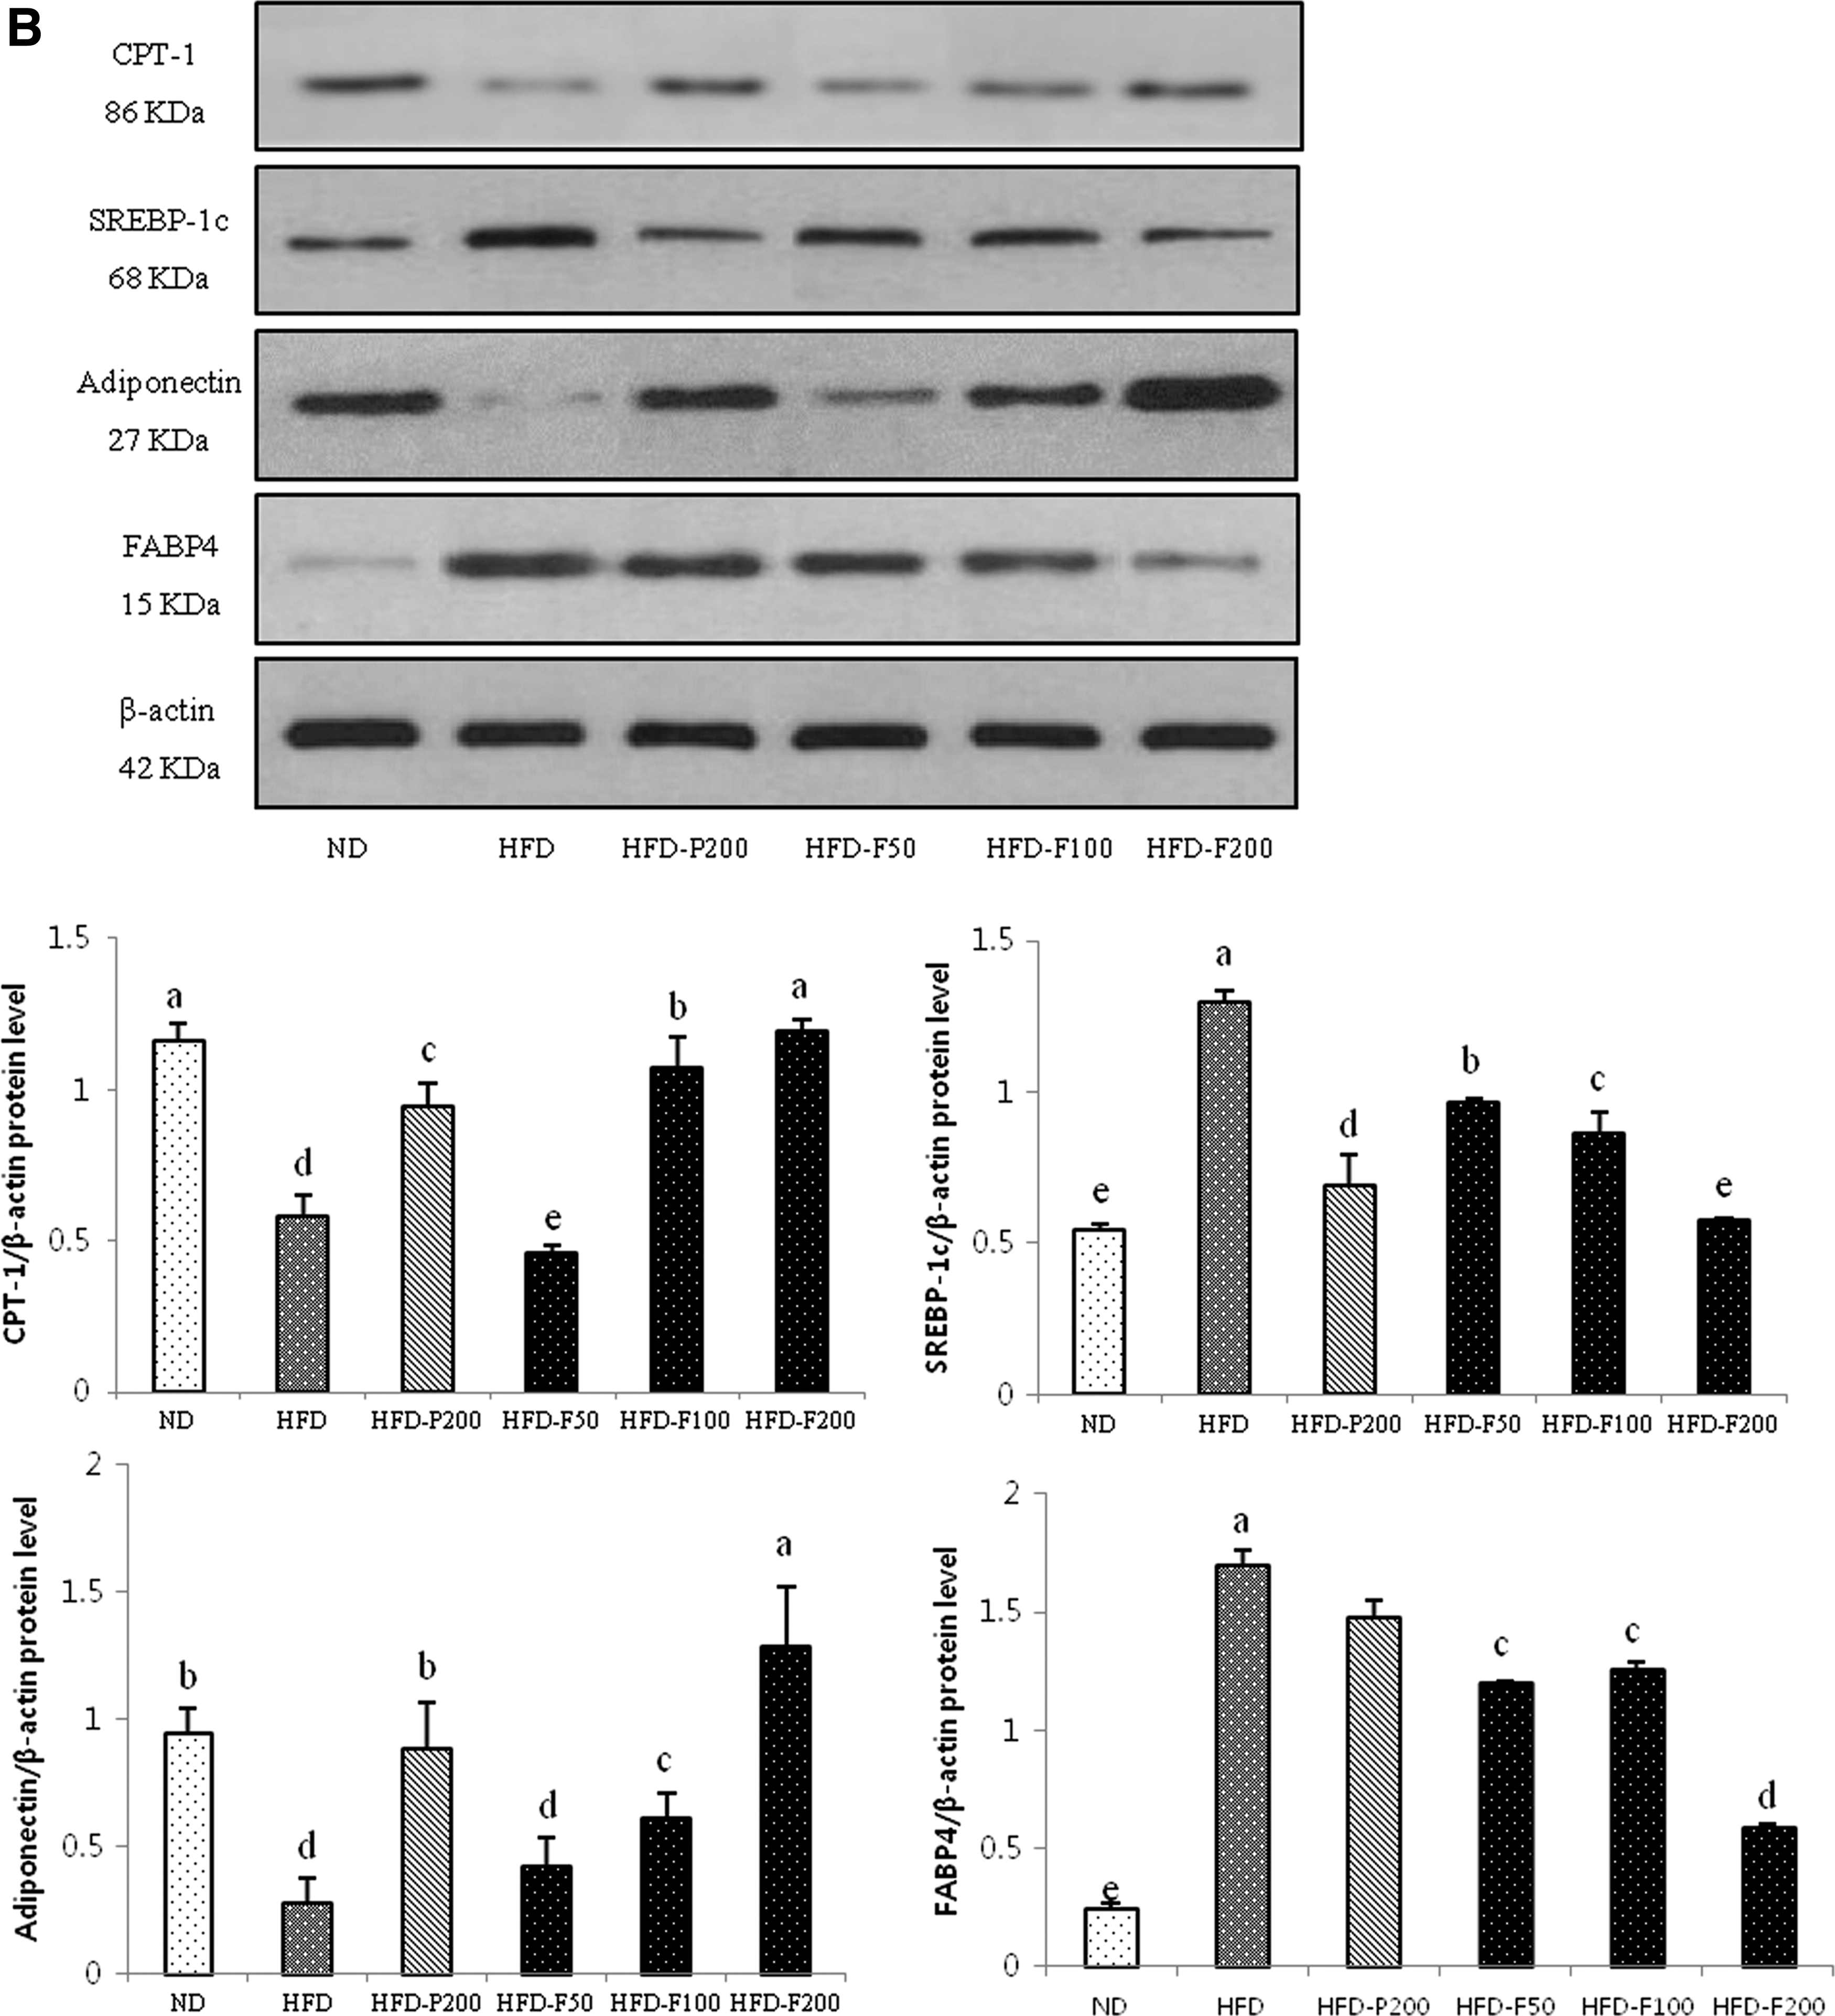
As shown in Figure 8, the PPARγ, C/EBPα, and FAS protein expression levels were significantly greater in the HFD group. However, these proteins were significantly downregulated in the PG- and FPG-treated mice and were markedly suppressed in the HFD-F200 group. In addition, the adiponectin and CPT-1 expression levels were significantly higher in the HFD-F200 groups compared with the HFD group.
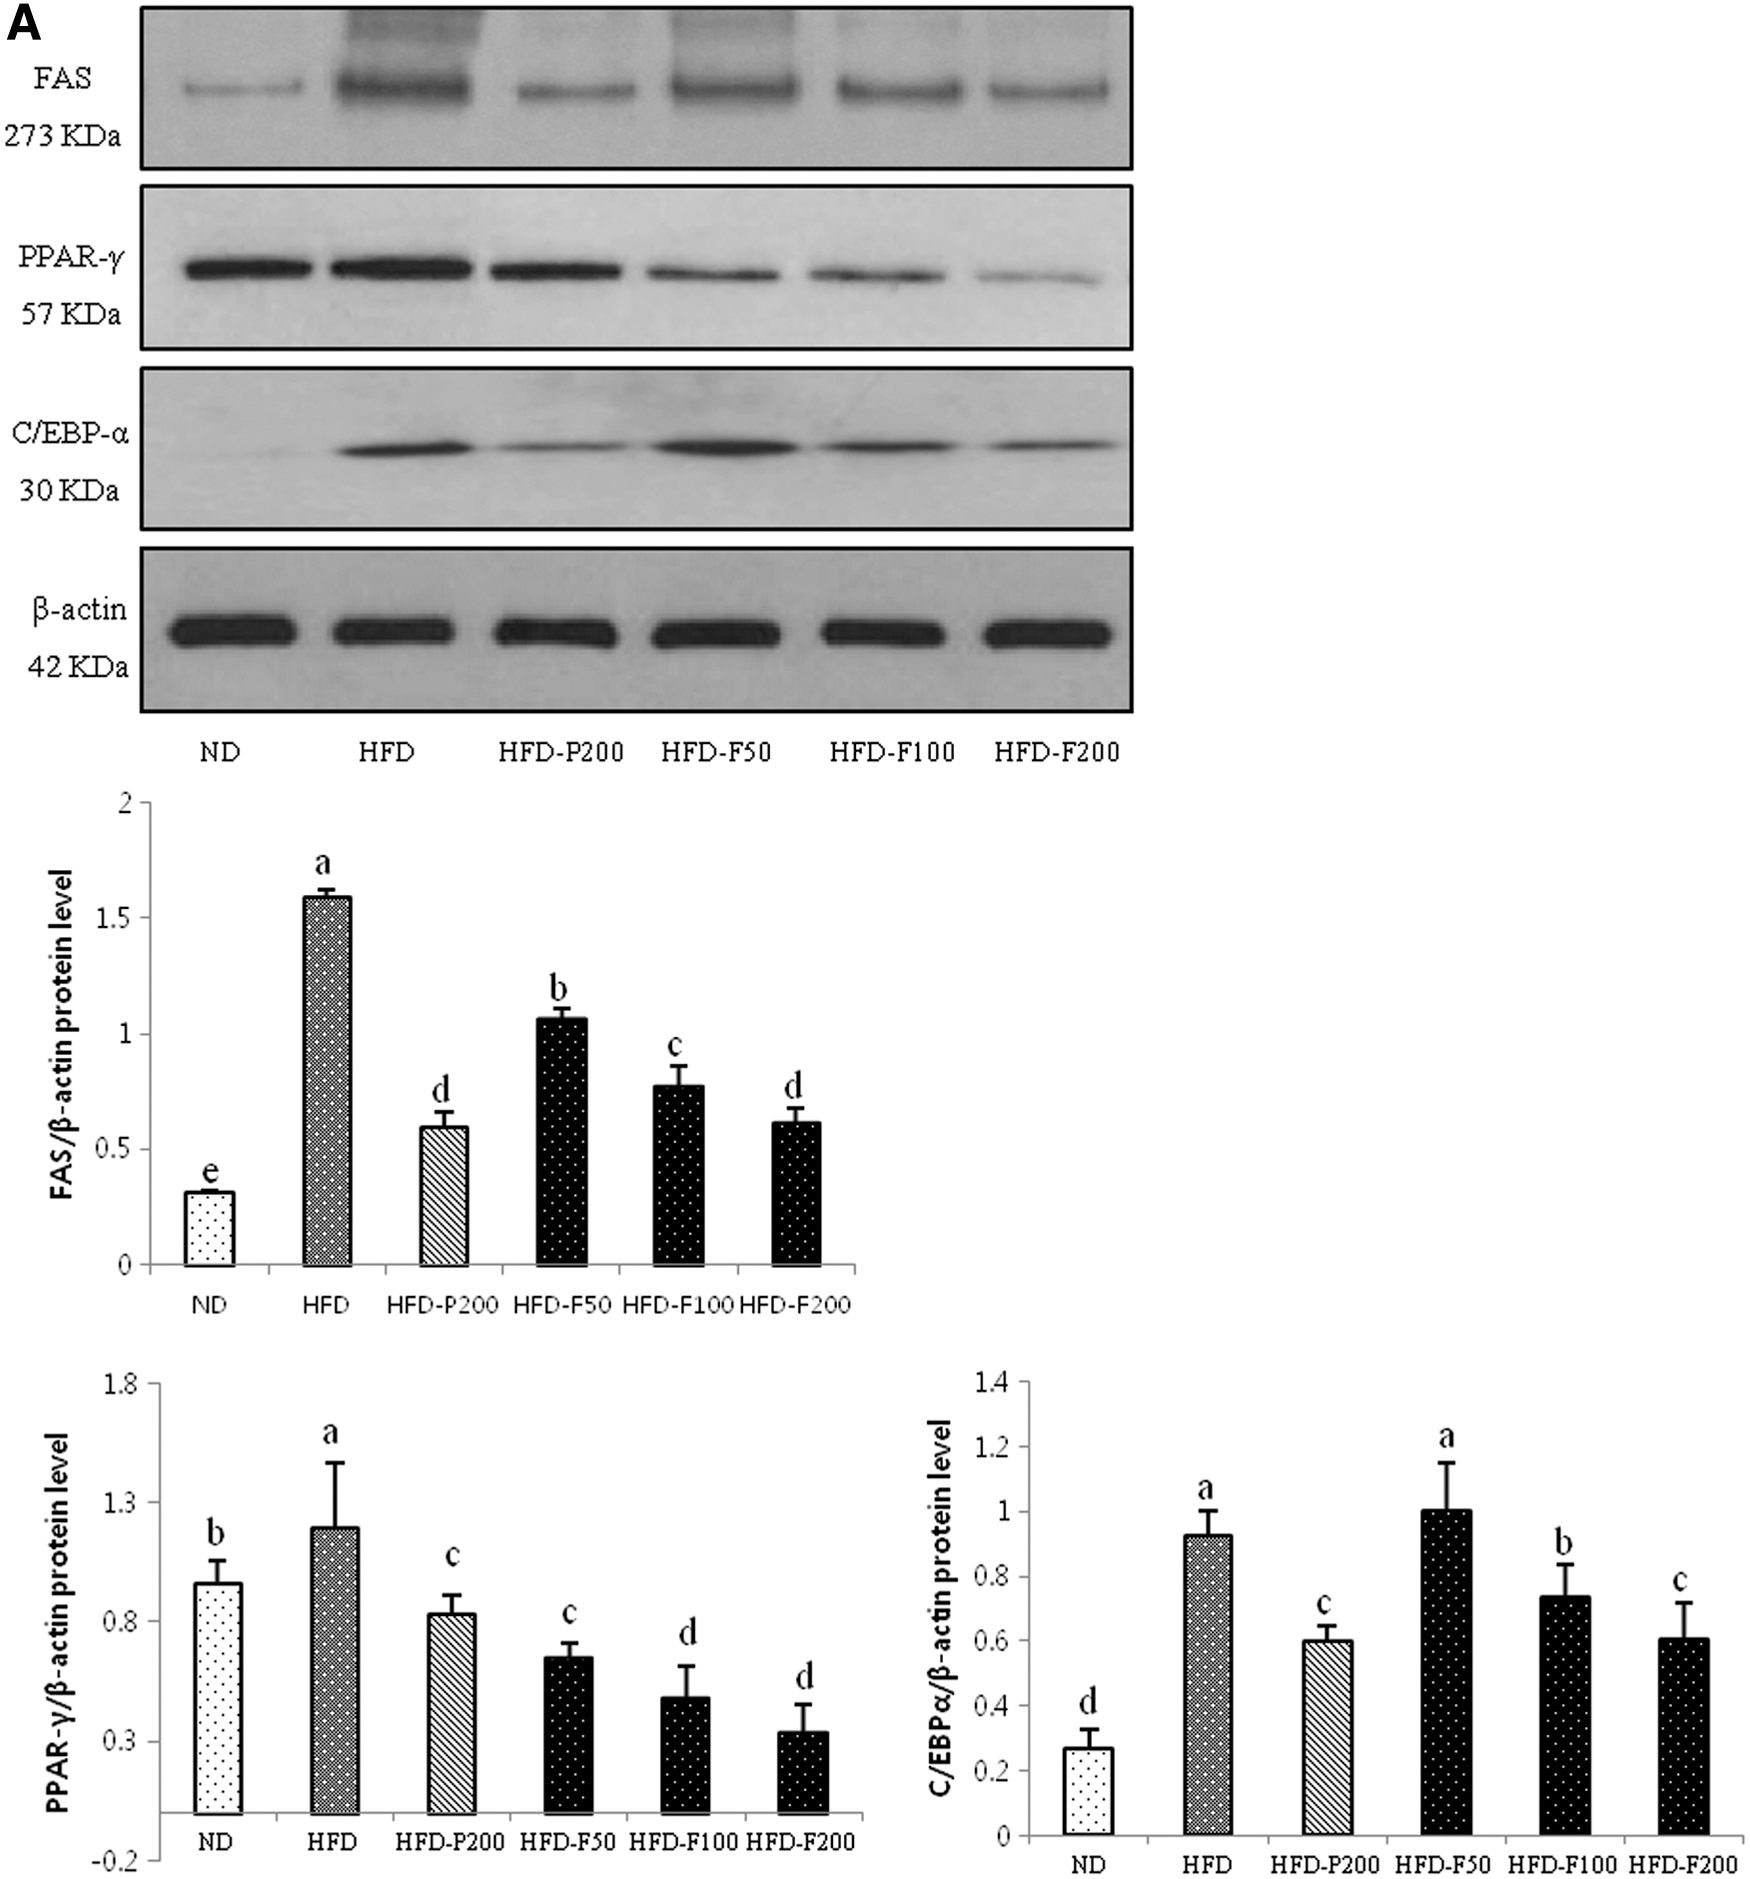
The effects of PG and FPG on the expression levels of adipogenic-, lipogenic-, and fatty acid oxidation-related proteins in epididymal adipose tissue.
Discussion
A major adipogenesis marker, fat accumulation, was measured based on TG content during 3T3-L1 differentiation. 18 ORO staining and the NBT assay are well-established techniques for quantifying cellular lipid content and ROS production. 19 To investigate the effects of PG and FPG on lipid accumulation and ROS production, we used ORO staining and the NBT assay during 3T3-L1 cell adipogenesis. We found that FPG exhibited a greater inhibitory effect on lipid accumulation and ROS production in 3T3-L1 cells compared with PG (Figs. 2 and 3). To evaluate the mechanisms of PG and FPG adipocyte differentiation inhibition, PPARγ, C/EBPα, and FABP4 protein expression levels were analyzed in 3T3-L1 cells using immunoblotting analyses. We measured the adipogenic-specific proteins PPARγ and C/EBPα, as well as their target gene FABP4, which is a terminal differentiation marker for adipocytes and is activated by PPARγ and C/EBPα, in the presence or absence of PG and FPG (200 μg/mL). 20,21 Treatments with FPG (200 μg/mL) significantly downregulated PPARγ and C/EBPα expression levels compared with fully differentiated 3T3-L1 adipocytes. The FPG (200 μg/mL)-mediated downregulation of C/EBPα and PPARγ expression determined activation of downstream target genes, such as FABP4 (Fig. 4). These results suggest that FPG can inhibit adipocyte differentiation through downregulating PPARγ and C/EBPα expressions in 3T3-L1 adipocytes. Furthermore, FPG supplementation in HFD-induced obese mouse groups significantly reduced body weight gain with a lower epididymal adipose tissue mass without hepatotoxicity (Figs. 5 and 7). To elucidate the mechanisms by which PG and FPG decrease the white adipose tissue weight, we measured the protein expression levels of adipogenic- and lipogenic-related proteins in epididymal adipose tissue through immunoblotting analyses. 22 Adipogenesis is controlled by a transcriptional cascade, including PPARγ, C/EBPα, SREBP-1c, and adiponectin, which stimulate expression of several adipogenic marker genes, such as FAS and FABP4. 23 –25 Moreover, we measured the lipogenic-related protein (FAS) and fatty acid oxidation-related protein (CPT-1; Fig. 8). The effects of FPG on HFD-induced obesity were primarily responsible for inhibiting adipogenesis in adipose tissue and regulating lipid metabolism through lipogenesis and fatty acid oxidation. In addition, FPG ameliorated the serum TC, TG, and LDL-c levels (Table 3). Recently, Nyakudya et al. 26 reported that the main bioactive components of PG are platycosides, a major known saponin in PG. Although the bioactivity of FPG may be caused by more than one active component of the extracts, the observed effects are likely induced by platycosides. Further studies are needed to compare the antiobesity effects of major bioactive compounds present in FPG.
Moreover, the enhancement of antiobesity activity of FPG may be attributed to bioconversion of its bioactive compounds. Lactobacillus fermentation of PG resulted in modification of the bioactive compounds, increasing aglycone forms of saponin. As expected from a previous report showing that Lactobacillus has strong glucosidase activity. 27 These chemical changes in the FPG are likely to contribute to the antiobesity activity by increasing the amount of bioavailable saponin compared to those found in PG. Based on these findings, we anticipate that FPG may be a novel therapeutic agent for improving HFD-induced obesity and obesity-related metabolic syndrome.
Footnotes
Acknowledgments
This work was supported by the Bio-Synergy Research Project (NRF-2015M3A9C4076322) of the Ministry of Science, ICT and Future Planning through the National Research Foundation of Korea and by the Hallym University Research Fund (HRF-201606-008).
Author Disclosure Statement
No competing financial interests exist.