




Abstract
Alpha-lipoic acid (LA) is a powerful antioxidant. LA has two enantiomers, R(+)-LA (R-LA) and S(−)-LA (S-LA). Of these, R-LA is naturally occurring and an essential cofactor in energy metabolism. R-LA treatment has been reported to affect glucose metabolism in rat hepatoma cells. This study analyzed the time course of metabolite levels in LA-treated cultured H4IIEC3 rat hepatoma cells, including a specific evaluation of the effect of R-LA and the enantioselectivity of LA. Principal component analysis showed that this experiment was well designed to observe enantioselectivity. R-LA treatment was found to inhibit the glycolysis and Thr-Gly-Ser pathways, as well as lactic acid production, leading to the inhibition of gluconeogenesis in starved H4IIEC3 cells. This study may provide mechanistic insight into how R-LA induces apoptosis in hepatoma cells.
Introduction
A
Many studies on LA have been done in cells 4,5 and animals 2 because of its antioxidant properties, and particularly the prevention and/or treatment of diabetic complications. 6 LA has been shown to stimulate glucose uptake, via both GLUT4 translocation and GLUT4 activation, in 3T3-L1 adipocytes and L6 myotubes. 7 In both cell types, R-LA was more effective than S-LA or the racemic mixture and was comparable to insulin induction. 8 In tumor cell lines, however, R-LA can reduce cell viability/proliferation, uptake of [18F]-fluorodeoxyglucose (FDG) and lactate production and increase apoptosis. 9 LA induces apoptosis by increasing mitochondrial respiration, along with the concomitant generation of superoxide anion free radicals (O2 •−), in human colon cancer, 10 lung cancer, 11 and hepatoma 12 cells. Exposure of primary cultured rat hepatocytes to therapeutically relevant concentrations of R-LA for 3 h was found to increase pyruvate oxidation, apparently by activation of the pyruvate dehydrogenase (PDH) complex, and to decrease gluconeogenesis and free fatty acid oxidation. 13 Another study reported that the antiapoptotic effect of R-LA was due to its activation of the insulin receptor/PI3-kinase/Akt pathway. 14 In that study, R-LA was shown to bind directly to the tyrosine kinase domain of the insulin receptor, blocking the hepatocyte apoptosis induced by actinomycin D/TNF-R. Our investigation of the effects of enantiomeric pure R-LA on signaling pathways and oxidative stress in cancer cell lines showed that R-LA inhibited human lung cancer cell proliferation and inhibited apoptosis of human neuroblastoma cell lines by protecting against buthionine sulfoximine (BSO)-induced glutathione depletion. 15,16
Because R-LA is found in the liver and is an essential cofactor in energy metabolism, it should affect the concentrations of various metabolites in hepatocytes. Our group reported that intercellular reactive oxygen species (ROS) may affect insulin signaling in the H4IIEC rat hepatoma cell line. 17 Although, probably due to the very rapid metabolism of R-LA, the concentrations of some metabolites tended to be higher than in R-LA-treated cells (data not shown). Pharmacokinetic investigations showed that the time to reach maximum concentration (Tmax) of plasma LA concentration was around 30 min after oral administration of LA to humans 18 and around 10 min in rats. 19 Plasma LA concentrations returned to baseline 2 h after LA administration, indicating that LA metabolism is very rapid and that these metabolites are used or stored mainly in the liver. The aims of this study were to assess the time course of metabolite concentrations in LA-treated rat hepatoma cells and especially to compare the effects of pure R-LA with the racemate.
Materials and Methods
Chemicals
R(+)-alpha-lipoic acid (R-LA) was purchased from Toyo Hakko Co., Ltd. (Obu, Japan) and
Cell culture
H4IIEC3 cells (American Type Culture Collection, Manassas, VA, USA) were cultured in DMEM supplemented with 10% FBS, penicillin (100 U/mL), and streptomycin (0.1 mg/mL) at 37°C in a humidified atmosphere containing 5% CO2. The cells (seventh passage cells) were cultured to 80–90% confluence in 10-cm dishes. After removal of the culture medium and washing with PBS, the cells were subjected to serum starvation for 16 h by culturing in DMEM alone. To assess the effects of R-LA and
Analysis of aqueous metabolites
Aqueous metabolites were analyzed using a gas chromatography-mass spectrometry (GC/MS). Metabolites were extracted and derivatized as described, 20 with the following modifications. A 5 μL aliquot of 0.5 mg/mL 2-isopropylmalic acid (internal standard) was added to each defrosted cell sample. The samples were sonicated for 20 s (UR-21P; Tomy Seiko Co., Ltd., Tokyo, Japan) to break the cellular membrane, and the mixtures were incubated for 30 min at 37°C and centrifuged at 15,000 g for 3 min at 4°C. An 800 μL aliquot of each supernatant was transferred to a clean 2.0-mL tube; the residual solid sample was evaporated in a vacuum centrifuge dryer for 1 h. To each tube containing supernatant was added 500 μL of chloroform, followed by vortexing and centrifugation at 15,000 g for 3 min at 4°C. Each supernatant (800 μL) was transferred to clear 1.5-mL tubes, to which was added 200 μL of Milli-Q water. The tubes were vortexed and centrifuged at 15,000 g for 3 min at 4°C. Each supernatant (1000 μL) was transferred to a clear 1.5-mL tube and evaporated in a vacuum centrifuge dryer for 1 h. These samples were subsequently freeze-dried overnight.
For oximation, 50 μL of methoxyamine hydrochloride in pyridine (20 mg/mL) was added to each sample, followed by vortexing, sonication in a water bath for 20 min, and incubation for 90 min at 30°C. For trimethylsilylation, 25 μL of MSTFA was added to each sample, followed by incubation at 37°C for 30 min and centrifugation at 15,000 g for 5 min. The resulting supernatant was transferred to an amber GC/MS vial, followed by analysis on a GCMS-QP 2010 Ultra (Shimadzu, Kyoto, Japan), using the following parameters. The column was a 30 m × 0.25 mm i.d. fused silica capillary column coated with 0.25 μm CP-SIL 8 CB low bleed/MS (Agilent Technologies, CA, USA). The front inlet temperature was 230°C. The helium gas flow rate through the column was 1.12 mL/min. The column temperature was held at 80°C for 2 min isothermally, increased 15°C/min to 330°C, and held at 330°C for 6 min isothermally. The interface and ion source temperatures were 250°C and 200°C, respectively. The MS scan started at 3.55 min and ended at 24.00 min, with scans recorded over a mass range 85–500 m/z at a scan speed of 10,000 amu/sec. Injection volume was 1 μL and split mode was 25/1 (v/v).
GC/MS data analysis
Data were preprocessed using MetAlign (RIKILT, Wageningen University and Research Centre, Netherland). 21 AIoutput was used for peak identification, prediction, and data integration from results exported from MetAlign, user defined retention times, and a library of spectra. 22 AIoutput is an analysis tool for GC/MS-based metabolomics written in visual basic for application (VBA, excel macro) and available in Microsoft Excel Windows. Peak intensity data were calculated by AIoutput based on the results of protein assays.
Protein assay
Cellular proteins were assayed using the Pierce® BCA protein assay kit (Thermo Fisher Scientific K.K.). Briefly, each residual solid sample following extraction was resuspended in 1 mL of 20 mM HEPES (pH 7.4), 20 mM NaCl, 1% NP40, and 1% SDS. After 1 min of sonication, 10 μL of sample was mixed with 200 μL of reaction solution (a mixture of reagents A and B prepared as described in the user guide) in 96-well plates. The sample mixtures and standard solutions (0, 250, 500, 1000, and 2000 μg/mL) were incubated at 37°C for 30 min, and the absorbance at 570 nm was measured using a Microplate Reader (Multiskan FC; Thermo Fisher Scientific K.K.). GC/MS peak intensities were adjusted based on calculated protein concentrations.
Statistics
Data are expressed as mean ± SD. Dunnett's test was used to compare findings in R-LA- and
Results
After excluding metabolites over the upper limit of detection (e.g., phosphate), a total of 59 metabolites were detected (Table 1). Starvation of the H4IIEC3 hepatoma cell line can result in the generation of glucose through gluconeogenesis. In this study, H4IIEC3 cells were starved for 16 h before treatment with LA. Control cells, which were not treated with LA, should carry out gluconeogenesis and glucose consumption at the same time. (The metabolic pathway of glucose is depicted in Appendix Fig. A1c.)
Values are expressed as mean of relative abundance (n = 3).
P < .05.
P < .01 versus control.
P < .05.
P < .01 versus
LA-induced hepatic central carbon profile
Glycolysis pathway
LA has been reported to stimulate glucose uptake via both GLUT4 translocation and GLUT4 activation in hepatocytes, adipocytes, and myotubes.
7
Because protein-bound R-LA is a cofactor of the enzyme, pyruvate dehydrogenase, LA may affect both the beginning and end of glycolysis. We therefore evaluated the effects of R-LA and
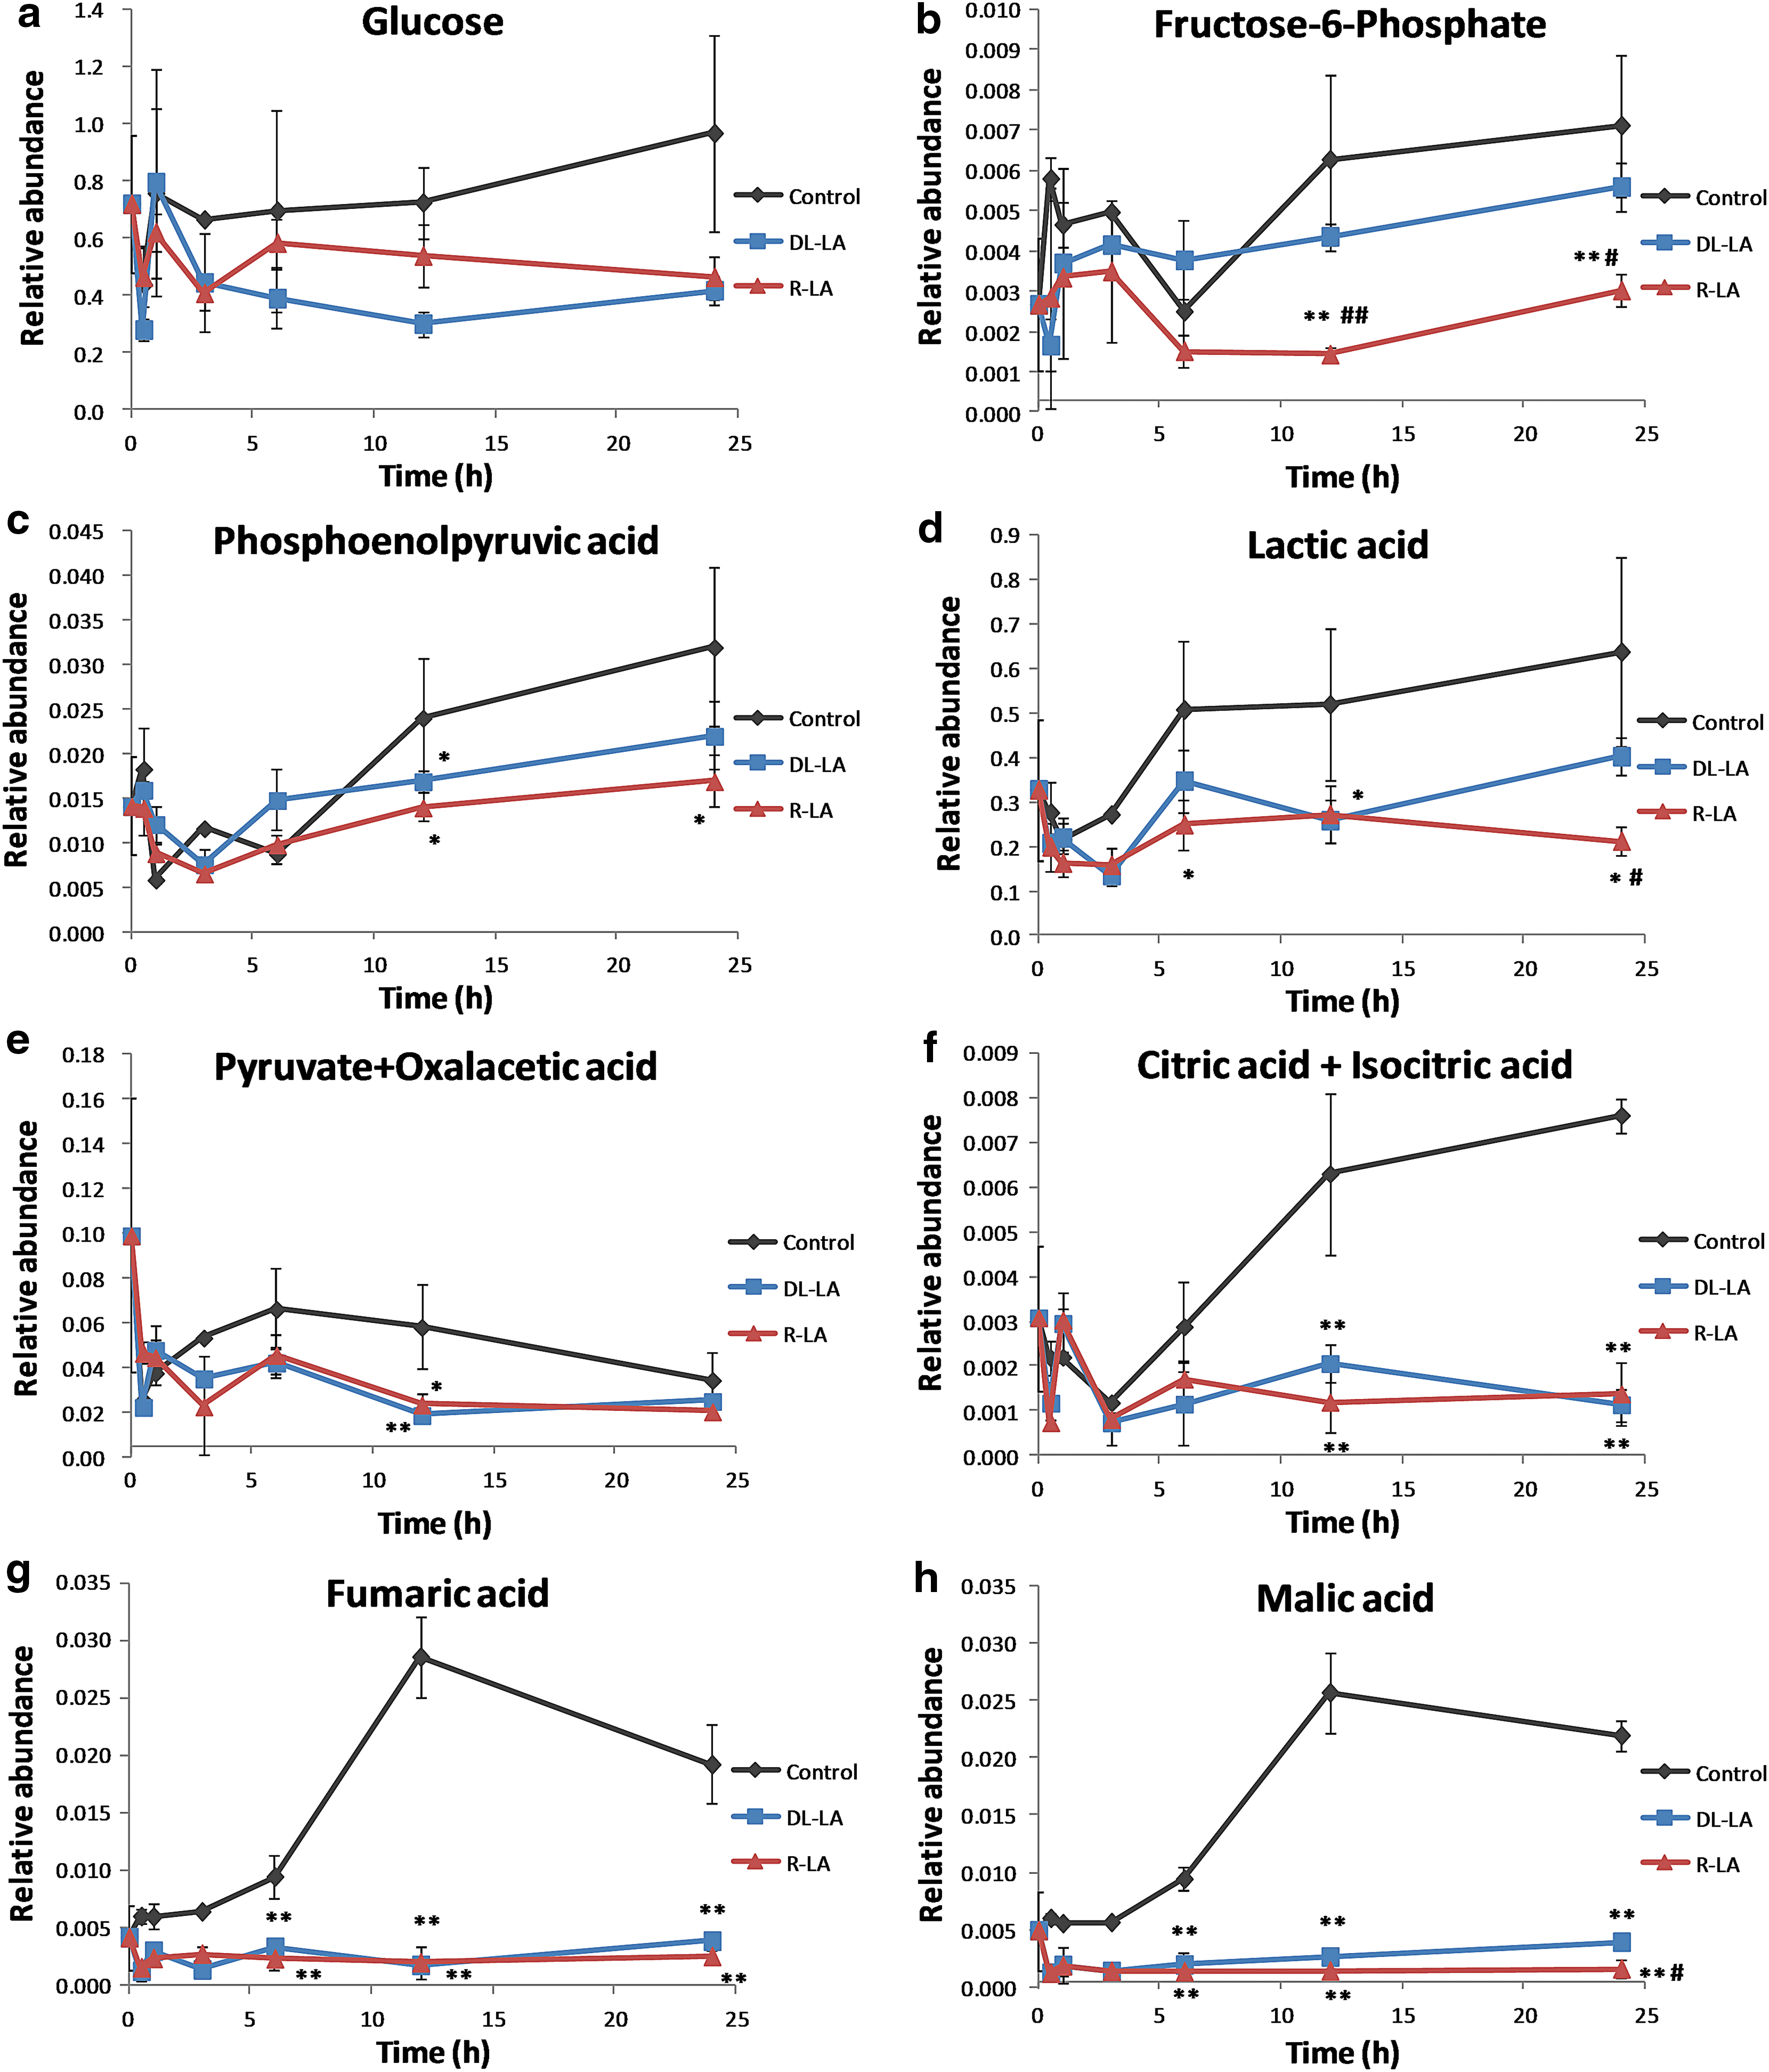
Time course of the relative abundance of the glycolysis metabolites
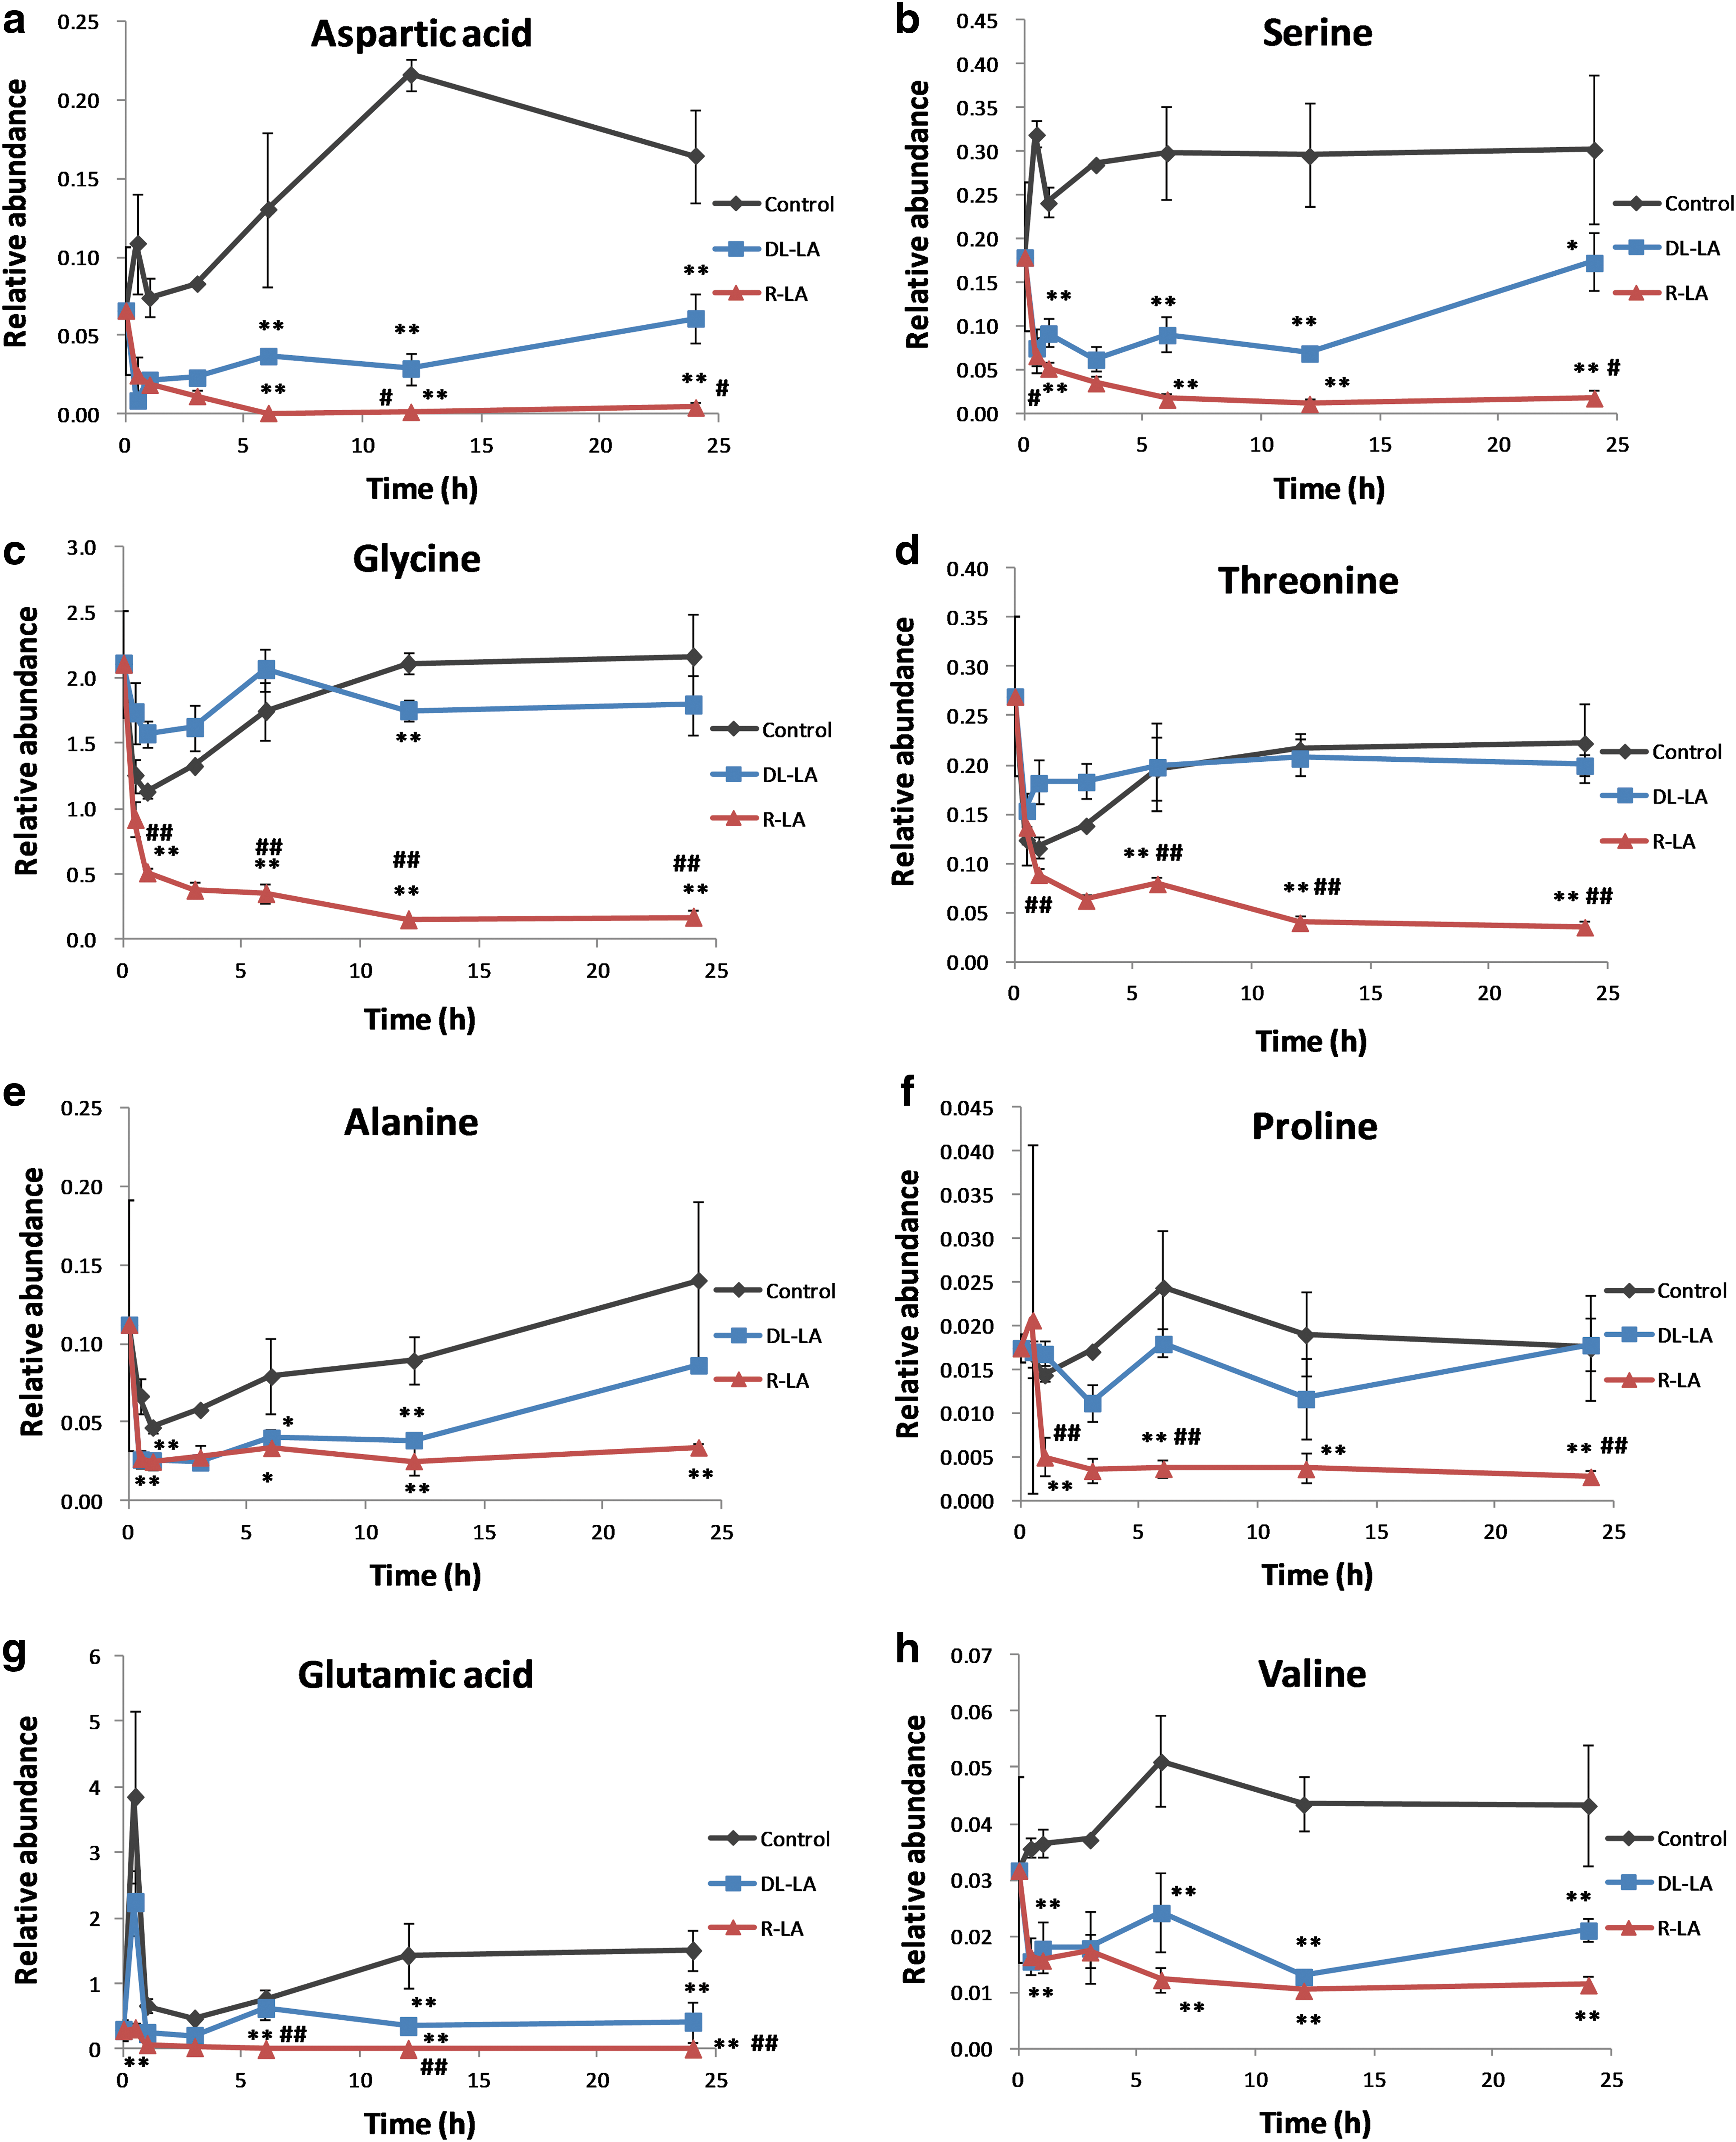
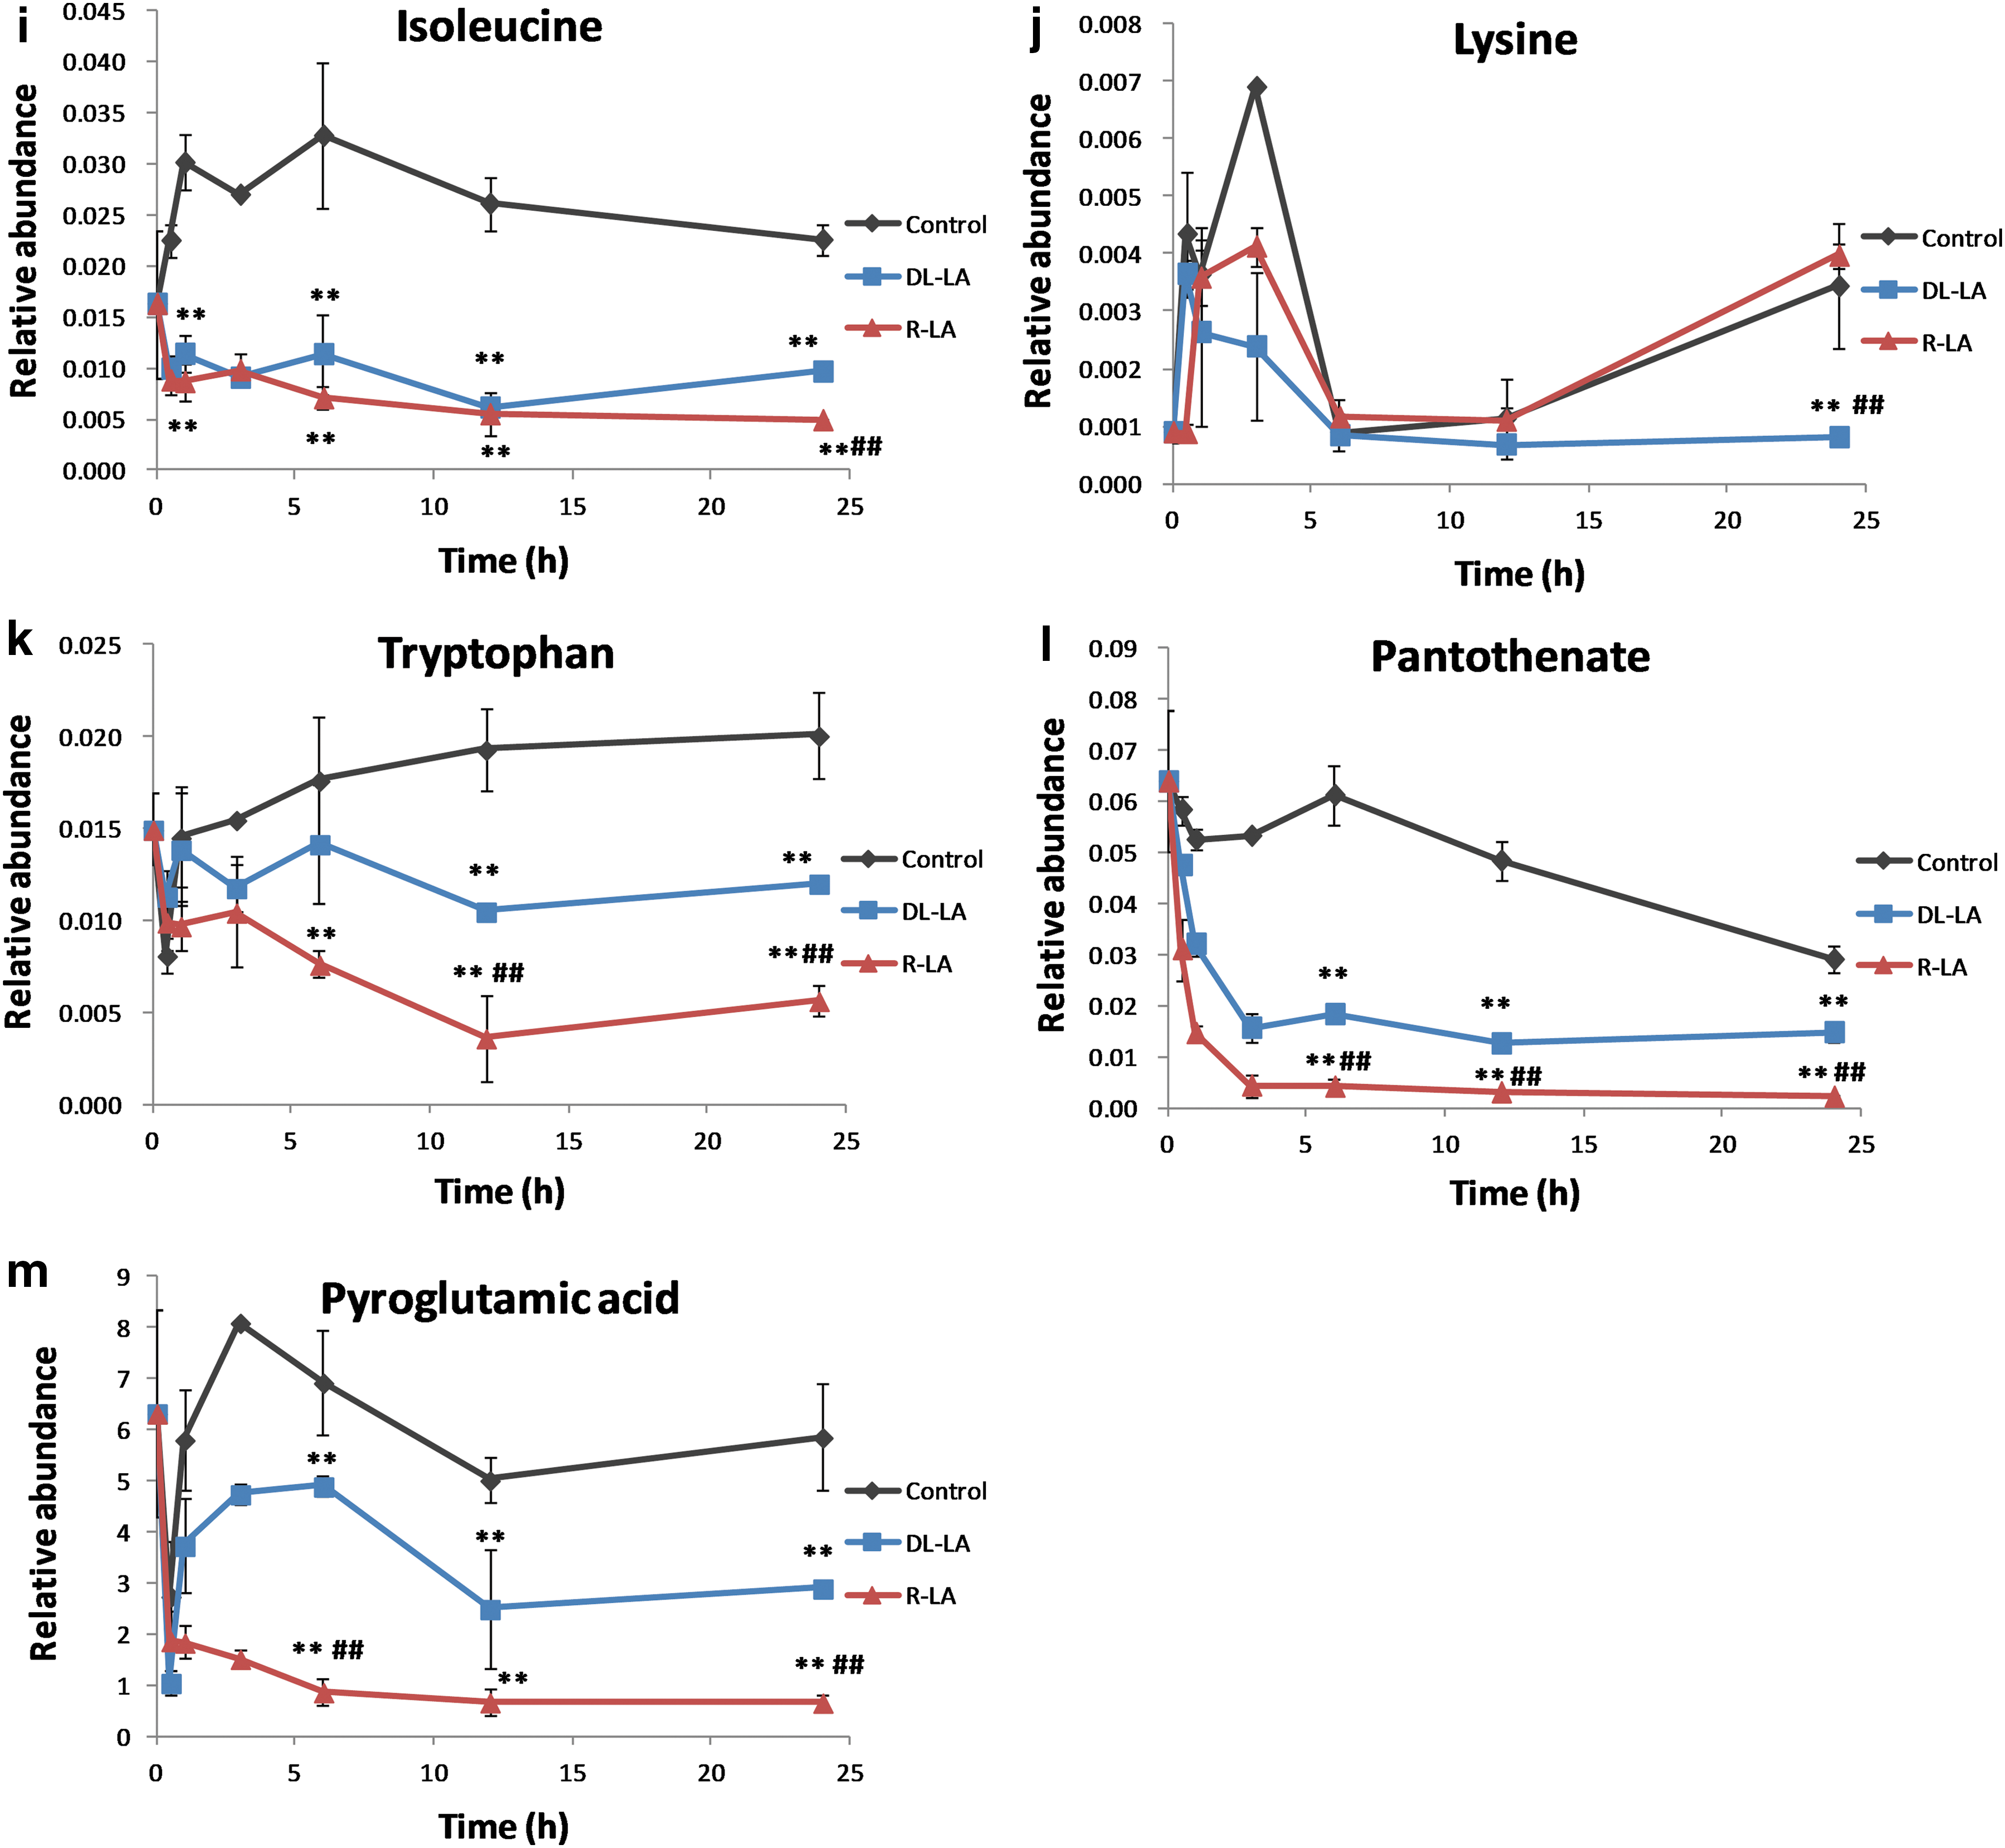
Time course of the relative abundance of the amino acids
LA also affected the profile of lactic acid, which is produced from pyruvate under anaerobic conditions. Lactic acid levels were significantly lower in R-LA-treated than in control cells at 6 and 24 h and were significantly lower in
Tricarboxylic acid cycle
Protein-bound R-LA is a cofactor of the enzymes pyruvate dehydrogenase and α-ketoacid dehydrogenase, thereby affecting the initiation and middle of the tricarboxylic acid (TCA) cycle (Appendix Fig. A1c). Four metabolites of the TCA cycle were detected (Fig. 1e–h), the combination of citric acid and isocitric acid, fumaric acid, malic acid, and the combination of pyruvate and oxaloacetic acid. Cellular citric acid and isocitric acid levels were significantly lower in cells treated with LA than in control cells at 12 and 24 h. In control cells, citric and isocitric acid levels were significantly higher after 3 h than at baseline (0 h), whereas in LA-treated cells, citric acid and isocitric acid levels did not increase. Fumaric acid levels showed a similar pattern, increasing gradually but significantly in the control group after 0 h and decreasing slightly at 24 h. Fumaric acid levels in LA-treated cells were unchanged and were significantly lower than in control cells at 6, 12, and 24 h. Cellular malic acid levels showed a similar pattern, except that malic acid level at 24 h was significantly lower in R-LA- than in
Enantioselective influence on amino acid profile
Asn and Asp (converted to oxaloacetic acid)
Aspartic acid (Asp) is a metabolite in the urea cycle and participates in gluconeogenesis. It carries reducing equivalents in the malate-aspartate shuttle, involving the ready interconversion between aspartate and oxaloacetate, the oxidized (dehydrogenated) derivative of malic acid. Aspartate provides one nitrogen atom in the biosynthesis of inosine, the precursor to the purine bases. In addition to its uses in the synthesis of pyrimidine and purine, aspartic acid acts as a hydrogen acceptor in adenosine triphosphate (ATP) synthase. LA treatment reduced Asp level at 0.5 h, whereas control, untreated cells showed a slight increase at 0.5 h. At every measurement point in this experiment, cellular Asp level was lower in LA-treated than in control cells (Fig. 2a). At 12 and 24 h, the cellular Asp level was significantly lower in R-LA-treated than in
Ala, Gly, Ser, Thr, and Cys (utilized by pyruvate)
Amino acids such as alanine (Ala) and glycine (Gly), which are components of skeletal muscle proteins, are transported to the liver and stored or used there. A part of the amino acid threonine (Thr) is transformed to succinyl-CoA via propionyl-CoA. Enzymes mediate the transformations of threonine to glycine and to serine (Ser). Ser is biosynthesized from 3-phosphoglycerate, one of the intermediate products in the glycolysis pathway, and is transformed enzymatically into pyruvate during gluconeogenesis. The serine levels of LA-treated cells decreased at 0.5 h, whereas those of control cells did not. Throughout treatment, serine levels remained higher in the control than in LA-treated cells. Levels of glycine and threonine, which are upstream in gluconeogenesis, decreased at 0.5 h in all tested groups, but were significantly lower in R-LA-treated than in control and
Pro, Arg, His, Glu, and Gln (transformed to α-ketoglutaric acid)
Proline (Pro), arginine (Arg), histidine (His), and glutamic acid (Glu) are transformed to glutamine (Gln) and then enzymatically converted to α-ketoglutaric acid, which enters the TCA cycle of gluconeogenesis. Proline concentrations after 1 h were significantly lower in R-LA-treated than in control and
Val, Ile, and Met (converted to succinyl-CoA)
Valine (Val), isoleucine (Ile), and methionine (Met) are converted to propionate-CoA, transformed to succinyl-CoA, and enter the TCA cycle; through oxaloacetic acid, they are used in gluconeogenesis. Beginning after 0.5 h, and throughout the duration of exposure, valine and isoleucine levels were lower in cells treated with R-LA and
Leu, Lys, and Trp
Leucine (Leu) and lysine (Lys) are ketogenic amino acids that can be degraded directly to acetyl-CoA. In contrast to the glucogenic amino acids, which are converted to glucose, these ketogenic amino acids are not converted to glucose. In humans, Leu and Lys are exclusively ketogenic. Tryptophan (Trp) is an essential α-amino acid in humans. Trp is metabolized in the cytoplasm and converted to alanine, a glucogenic amino acid. In the mitochondria, Trp, like Lys, is metabolized to acetyl-CoA. Trp levels were significantly lower in R-LA-treated than in
Principal component analysis
Principal component analysis (PCA) is a statistical procedure, which is currently one of the most widely used methodologies to analyze metabolomic data. PCA of metabolomic data using SIMCA (Umetrics, Malmö, Sweden) software showed that the cells treated with
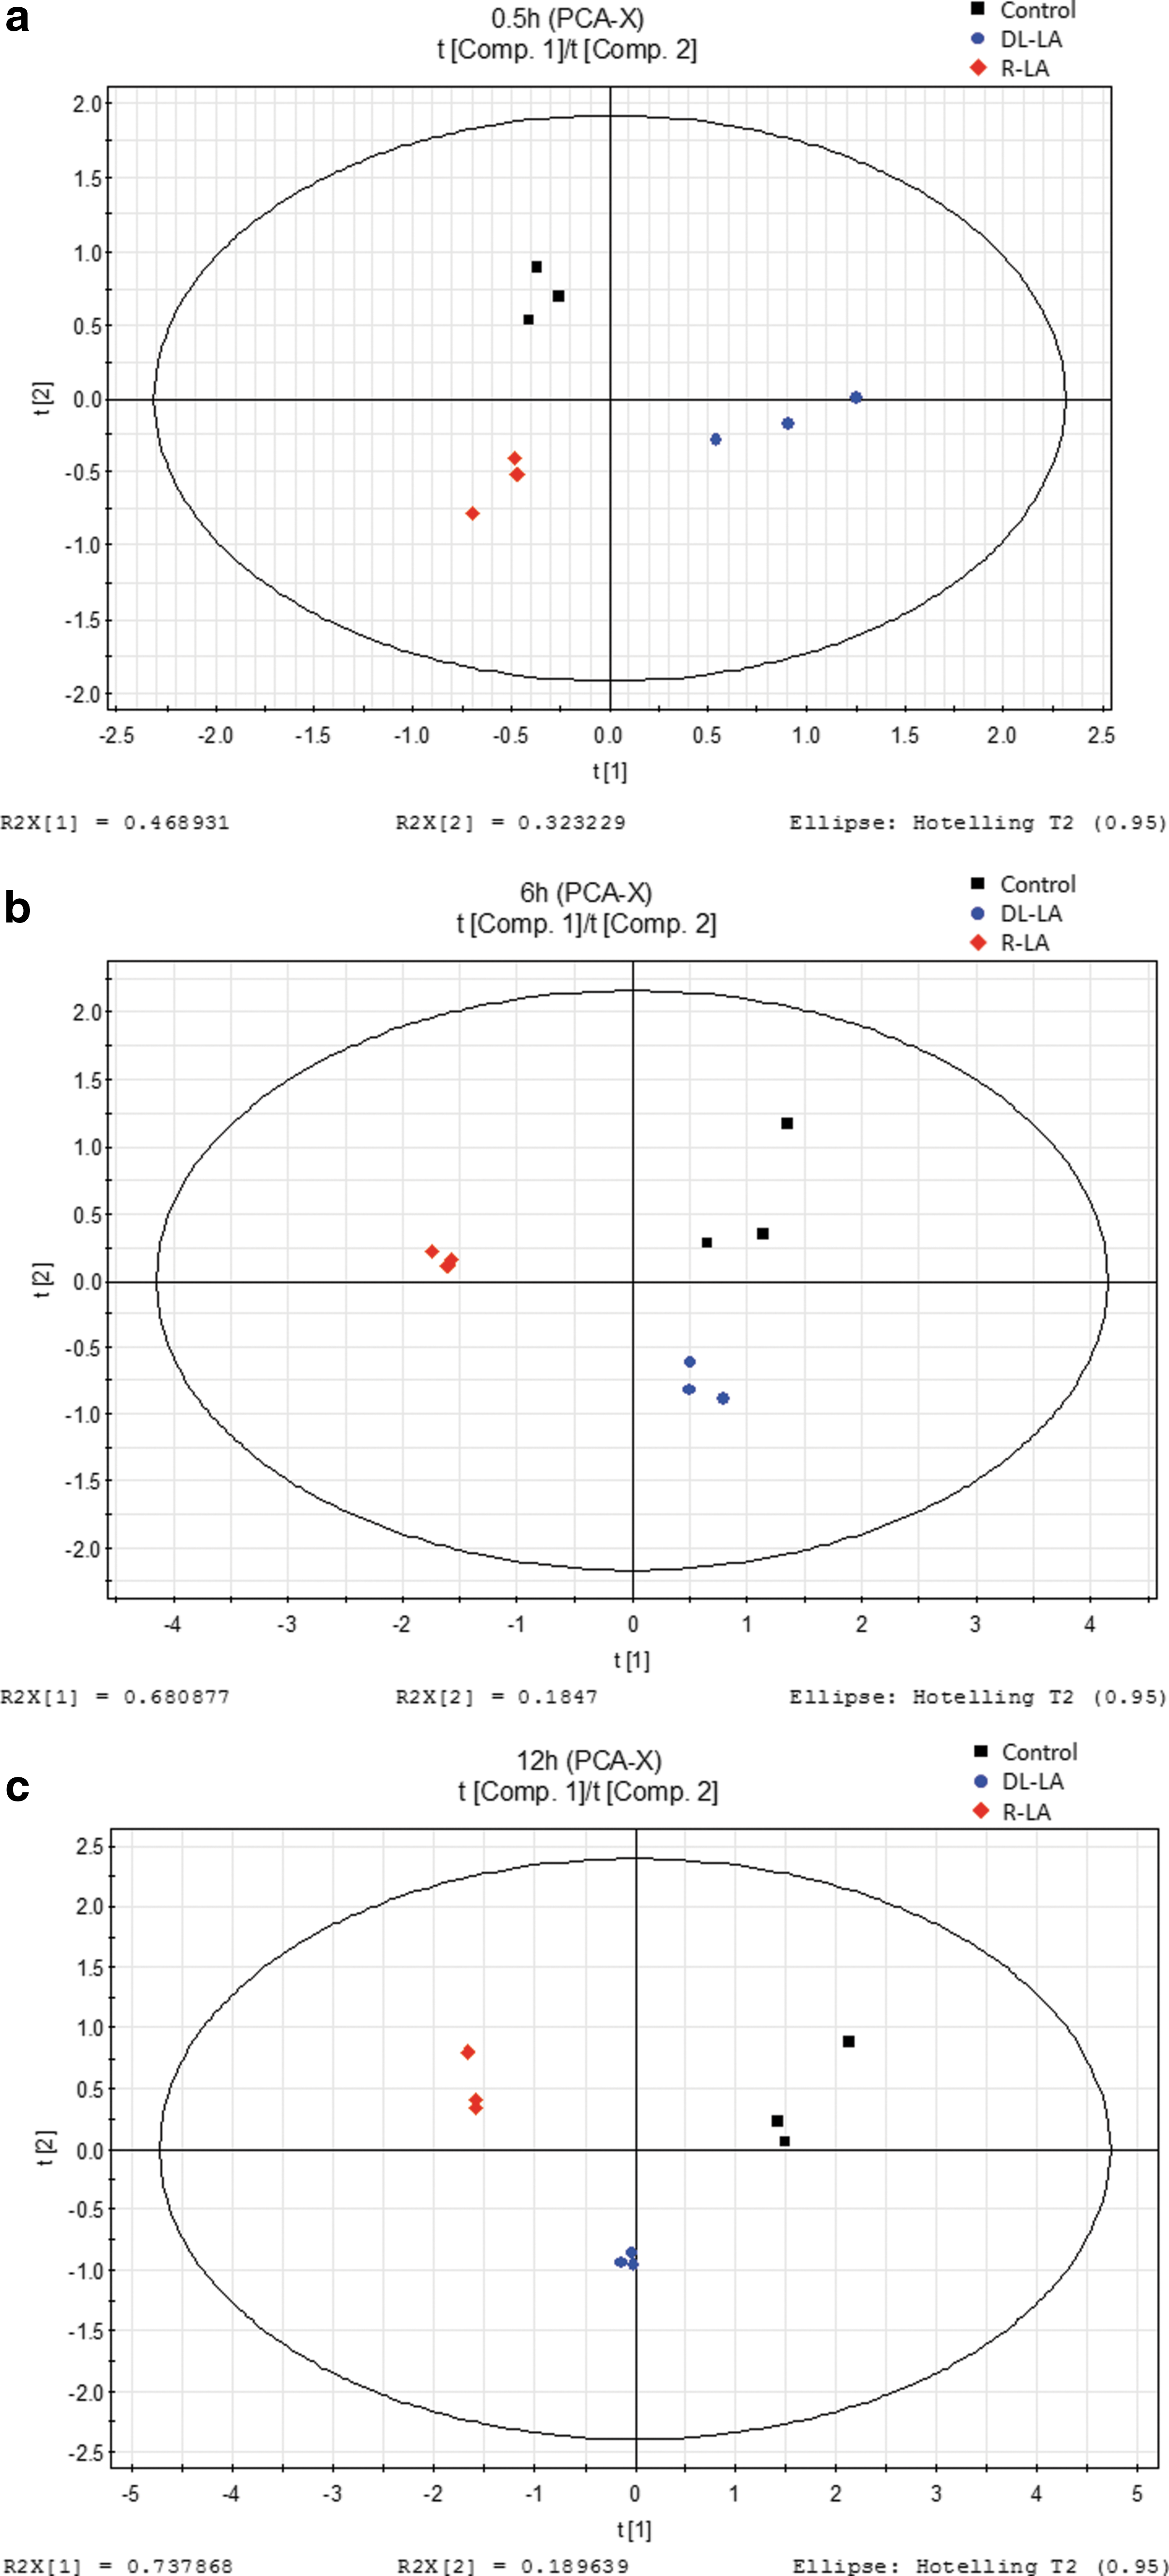
PCA scoring plots of the control (black squares),
Discussion
Intracellular glucose is phosphorylated to glucose 6-phosphate; isomerization of glucose 6-phosphate yields fructose 6-phosphate (F6P), which lies within the glycolysis metabolic pathway. In untreated (control) H4IIEC3 cells, F6P levels were higher at 0.5 h than at baseline, decreasing at 6 h, and increasing at 12 and 24 h. R-LA treatment kept the cellular F6P level significantly lower than in control cells at 12 and 24 h. Phosphoenolpyruvate (PEP) is another intermediate metabolite in the glycolysis metabolic pathway. Metabolism of PEP to pyruvate by pyruvate kinase generates one molecule of ATP via substrate-level phosphorylation. In contrast to most normal cells, in which energy is produced by a comparatively low rate of glycolysis followed by oxidation of pyruvate in mitochondria, energy in most cancer cells results from the Warburg effect, in which energy is produced predominantly by a high rate of glycolysis followed by lactic acid fermentation in the cytosol. 23 –26 The metabolic profiles of F6P, PEP, and lactic acid in these H4IIEC3 cells are consistent with the Warburg effect. Although the profile of pyruvate should be similar to that of lactic acid, the methodology we used could not distinguish between pyruvate and oxaloacetic acid. LA has been reported to reduce cell viability/proliferation, glucose uptake and lactate production, and to increase apoptosis, in tumor cell lines. 9 We found that R-LA treatment of H4IIEC3 cells reduced glucose uptake, ultimately reducing the production of lactic acid. These results indicate that R-LA inhibits the glycolysis metabolic pathway in H4IIEC3 cells.
The intermediate metabolites of the TCA cycle, including pyruvate and oxaloacetic acid, citric acid and isocitric acid, fumaric acid, and malic acid, showed lower relative abundance than the metabolites of the glycolysis pathway, such as lactic acid, in H4IIEC3 cells. These results indicate that a greater amount of pyruvate was converted to lactic acid than taken up by the mitochondria. This was due to the Warburg effect, which resulted in a change from the oxidative (pyruvate/acetylCoA) to the nonoxidative (pyruvate/lactate) metabolic pathway. Next, we focused our attention on the level of pantothenate. Pantothenate is well known to be involved in the synthesis of coenzyme A (CoA), and CoA is also a cofactor of pyruvate dehydrogenase and α-ketoglutaric acid in the TCA cycle. The pantothenate concentrations were also consistent with this observation. Pantothenate concentrations in R-LA-treated cells were significantly lower than those of control and
Assessment of amino acid metabolism showed that LA treatment reduced the amounts of amino acids in these cells, beginning at 0.5 h. Serine and alanine, which are biosynthesized in the body and converted to pyruvate, were significantly decreased by LA treatment. Glycerate 3-phosphate (GP), one of the intermediate metabolites in the glycolysis pathway, is a precursor of serine. Because LA treatment inhibited the glycolysis pathway, the GP level was low, reducing the serine level in these cells. Gly and Thr lie upstream of serine in the Thr-Gly-Ser pathway. Cellular concentrations of Gly, Thr, and Ser were significantly lower in R-LA-treated than in untreated (control) and
In both untreated and
Many metabolites in H4IIEC3 cells showed rapid responses to LA treatment. Measurements of cellular metabolite levels 0.5 and 1 h after LA treatment were important in determining initial responses, whereas measurements at 6–24 h were important in determining the overall effect of LA treatment. We therefore classified the detected metabolites into the four major and four minor types (Appendix Table A1). Most of the metabolites that classified into the Control >
Conclusions
PCA was able to differentiate among the three groups of H4IIEC3 cells, those treated with R-LA and
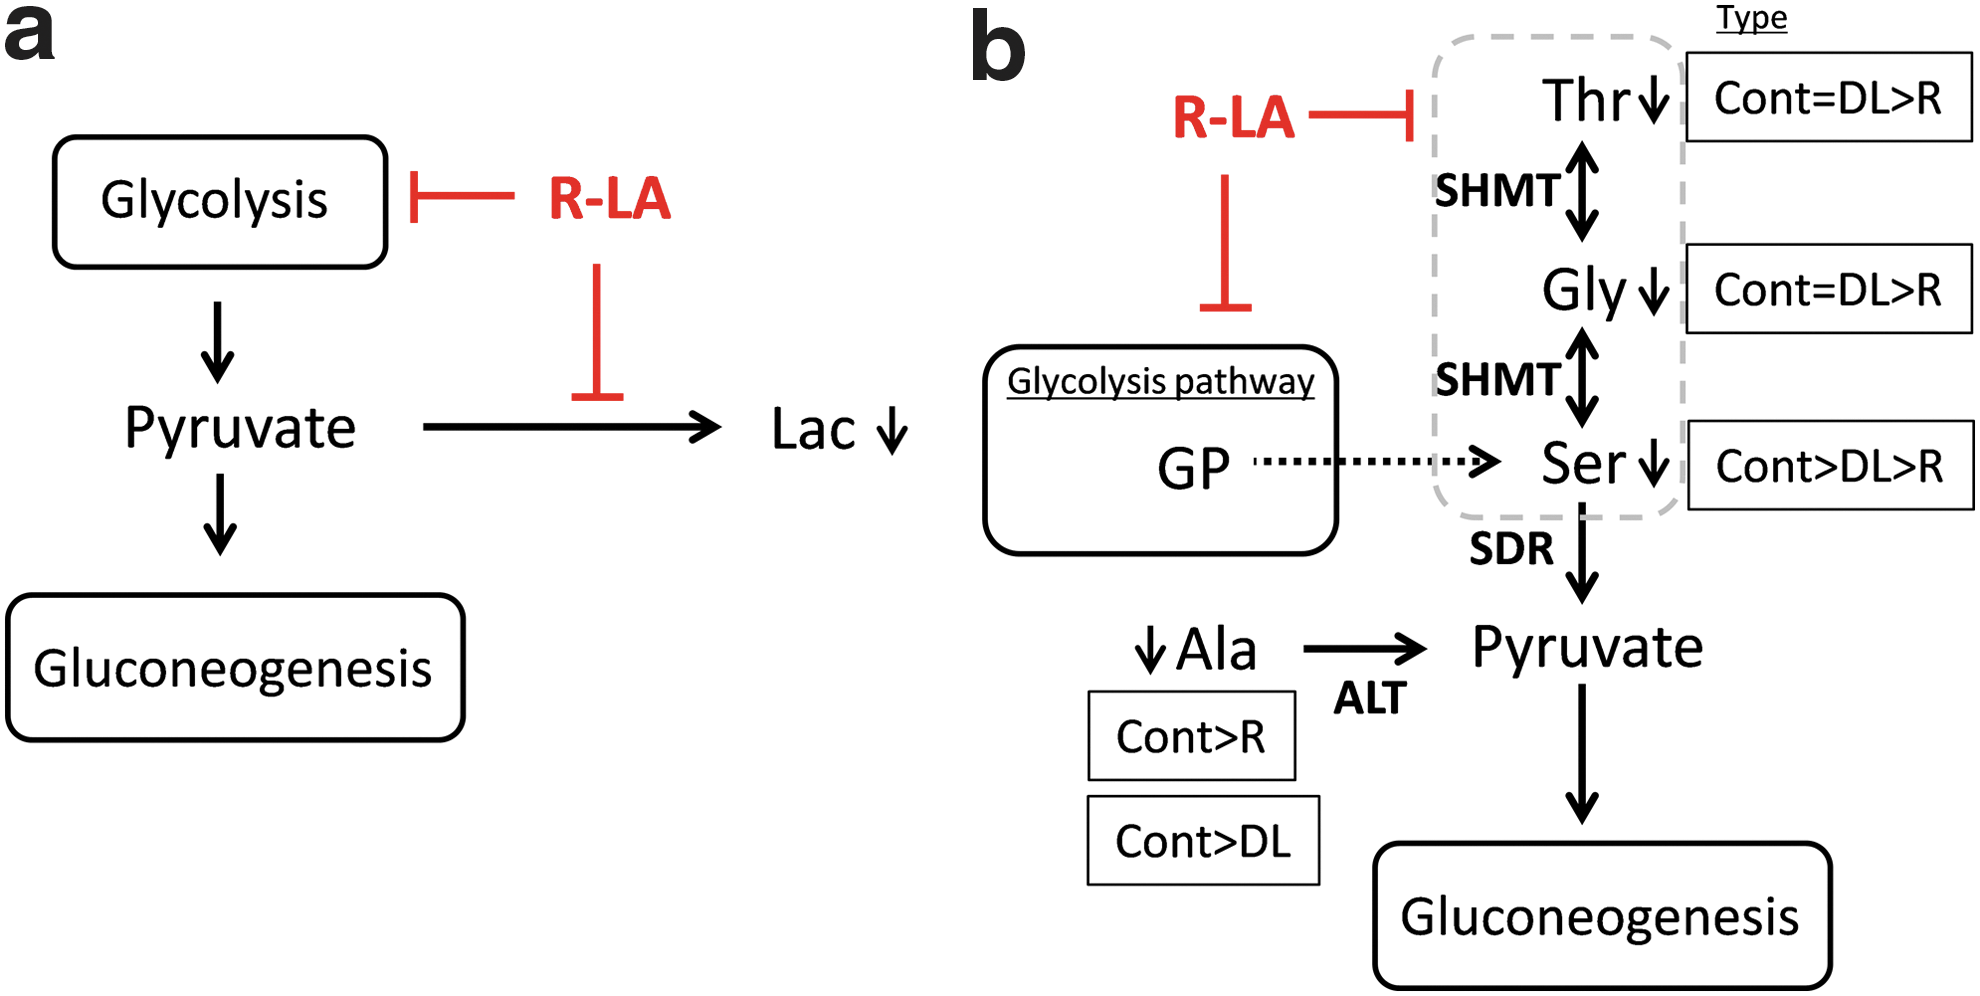
Proposed metabolic pathways by which R-LA inhibits gluconeogenesis.
Footnotes
Acknowledgments
We thank Changshu Fushilai Medicine & Chemical Co., Ltd. and Toyo Hakko for their donation of R(+)-alpha-lipoic acid. This work (S.M.) was partially supported by a Grant-in-Aid for Exploratory Research from Japan Society for the Promotion of Science.
Author Disclosure Statement
N.I., K.T., G.R., and S.M. designed the study and contributed to preparation of the manuscript; N.I., K.C., Y.A., Y.Y., and H.Y. prepared the cells and conducted GC/MS analysis; N.I., K.C., Y.A., and S.M. performed the PCA and calculated the data. All of the authors have read and approved the final manuscript. CycloChem Bio Co, Ltd. (president K.T.) provided funding for a part of this study. The authors have no conflicts of interest that could inappropriately influence this research or be directly relevant to the content of this article.
Appendix
| Quickly responding metabolites | |
|---|---|
| 2-Hydroxypyridine Alanine (2TMS) Arabinose-5-phosphate a-Sorbopyranose (or fructose) Aspartic acid Citric acid+Isocitric acid Dihydroxyacetone Fructose Fructose-6-phosphate Fumaric acid Galactosamine Galacturonic acid Glucarate Glucuronate Glutamic acid Glyceric acid Glycine (3TMS) Inositol Isoleucine Lauric acid Lysine (3TMS) |
Malic acid Mannose N-Formylglycine Nicotinamide Nonanoic acid(C9) Pantothenate p-Coumaric acid Phenylalanine Phosphoenolpyruvic acid Proline Pyroglutamic acid Pyruvate+Oxaloacetic acid Ribose Ribulose Serine (3TMS) Sucrose Tagatose Threonine (2TMS) Tryptophan Valine (2TMS) Xylitol |