
Abstract
Consumption of highly colored fruits and vegetables rich in anthocyanins has been associated with numerous health benefits. Purple carrots (PC) and purple potatoes (PP) have higher anthocyanin concentrations and higher biological activities compared with less pigmented cultivars. We hypothesized that substitution of the majority of carbohydrate in a high fat diet with PP or PC, for 8 weeks, would improve insulin resistance and hypertension, major components of metabolic syndrome, compared with orange carrots (OC), white potatoes (WP) or a control, high fat, sucrose-rich diet (HFD) in obese Zucker rats. After 8 weeks of feeding, intraperitoneal glucose tolerance test, intraperitoneal insulin tolerance test (ipITT), and invasive hemodynamic tests were performed. The PP group had better glucose tolerance compared with the WP and the HFD groups and higher insulin sensitivity as measured by the ipITT and homeostatic model assessment of insulin resistance (P = .018) compared with the HFD without having any effect on blood pressure. The PC reduced left ventricular pressure compared with both the HFD (P = .01) and the OC (P = .049) groups and reduced systolic and diastolic blood pressures compared with the HFD group (P = .01 and <.0001, respectively) without having any effect on glucose homeostasis. The PC animals consumed more and were more obese than other groups, possibly obscuring any benefit of this vegetable on glucose tolerance. The bioactives in the vegetables responsible for blood pressure and glucose homeostasis could be different, and their effects could be independent of each other. The specific bioactives of each vegetable and their molecular targets remain to be identified. Nonetheless, incorporation of purple vegetables in functional food products may provide metabolic/cardiovascular benefits in the background of a high-fat diet that promotes obesity.
Introduction
M
Epidemiologic evidence supports an inverse association between consumption of diets rich in fruits and vegetables and the prevalence of MetS. 4 Plants often contain several bioactive phytochemicals that have multiple biological activities, giving them many mechanisms by which to delay or reverse MetS associated pathologies. 5
Anthocyanins are water soluble pigments that give fruits and vegetables their red, blue, and purple colours 6 and are commonly found in the human diet. 7,8 In several recent animal and human studies, anthocyanin-rich plants were shown to positively modify MetS biomarkers. Whole tart cherry, 9,10 purple corn, 11 mulberry water extract, 12 blueberry powder, 13 bilberry extract, 14 blood orange juice, 15 blueberry beverage, 16 strawberry beverage, 17 black rice, 18 black soy bean, 19 and anthocyanin supplementation 20 were reported to decrease and/or improve one or more of the metabolic risk factors such as body weight, adipose tissue weight, dyslipidemia, hyperinsulinemia, hyperglycemia, glucose intolerance, insulin resistance, hepatic steatosis, and/or blood pressure. Several mechanisms were suggested to explain these favorable effects of anthocyanins on MetS. In these studies, anthocyanins were mainly shown to modulate the expression of genes that regulate lipid metabolism, inflammation, and energy homeostasis, all of which are thought to be critical to the pathogenesis of obesity and insulin resistance.
The color in purple carrots is attributed to their high content of anthocyanins. 21,22 Purple carrot juice was shown to have higher antioxidant, anti-inflammatory, and hypolipidemic effects compared with beta-carotene in high-carbohydrate high-fat diet-fed rats. 23 Higher concentrations of antioxidants in purple potato cultivars compared with white potato cultivars are mainly attributed to their anthocyanin content. 24 Purple potatoes were shown to have antiobesity and hypolipidemic effects in high-fat diet-fed rats 25 and antioxidative and anti-inflammatory effects in men. 26
Given the reported favorable effects of anthocyanin-rich plants on MetS, the high concentration of anthocyanins in purple carrots and purple potatoes and their reported higher biological activity compared with their less pigmented counterparts, we hypothesize that (1) the substitution of the majority of carbohydrate in a high-fat diet, with purple carrots or purple potatoes, for 8 weeks, would improve insulin resistance and hypertension, (2) more highly colored varieties would be superior to lighter cultivars, and (3) all vegetable diets would perform better than the typical sucrose-rich, high-fat diet known to produce the MetS in animals.
Materials and Methods
Experimental design
Seventy-five obese susceptible Zucker male rats were obtained from Charles River Laboratories at 4 weeks of age and housed, two rats per cage, at 23°C ± 3°C under an automatic lighting schedule (08.00–20.00 h light). They were acclimated on regular chow for 1 week and then randomized to five experimental diets (15 rats/group): control (high-fat diet, HFD), white potato-supplemented high-fat diet (WP), orange carrot-supplemented high-fat diet (OC), purple potato-supplemented high-fat diet (PP), or purple carrot-supplemented high-fat diet (PC) for 8 weeks. The five experimental diets were prepared by Research Diets, Inc. (New Brunswick, NJ, USA), using a modified high-fat AIN-93M diet as the base. Each diet was the same except for the type of carbohydrates. The control group had sucrose, whereas the other four groups had one of each vegetable, as the main sources of carbohydrates. The composition of the pelleted experimental diets is shown in Table 1. Body weight and food intake were measured twice a week throughout the study. This protocol was approved by the Animal Care Committee of the University of Guelph (Animal Utilization Protocol #12R012) in accordance with the guidelines from the Canadian Council on Animal Care (CCAC).
WP, high-fat diet supplemented with white potatoes; PP, high-fat diet supplemented with purple potatoes; OC, high-fat diet supplemented with orange carrots; PC, high-fat diet supplemented with purple carrots.
Quantification of phenolic and carotenoid content of the experimental vegetables
Polyphenol and carotenoid extracts were prepared from freeze-dried vegetable powder as previously described. 27 Total phenolic content was determined using Folin–Ciocalteu's phenol reagent method and expressed as milligram gallic acid equivalent per gram dry weight. 27 Total anthocyanin content was quantified using the pH differential method and expressed as milligram cyanide-3-glucoside equivalent per gram dry weight. 27 Total flavonoid and carotenoid contents were also estimated 28,29 and expressed as milligram catechin equivalent and microgram β carotene equivalent per gram dry weight, respectively (Table 2).
Values are means ± SD, n = 3. Means within a column not sharing a letter are significantly different, P < .05.
Values are expressed as milligram gallic acid equivalent per gram of dry weight (mg GAE/g DW).
Values are expressed as milligram catechin equivalent per gram of dry weight.
Values are expressed as milligram cyanidin-3-glucoside equivalent per gram of dry weight (mg C3G/g DW).
Values are expressed as microgram β carotene equivalent per gram of dry weight.
TAC, total anthocyanin content; TCC, total carotenoid content; TFC, total flavonoid content; TPC, total phenolic content.
Glucose tolerance test
After 8 weeks of feeding, an intraperitoneal glucose tolerance test (ipGTT) was performed on overnight fasted rats. The glucose level was measured from the whole tail blood at 0, 10, 20, 30, 60, 90, and 120 min following the ip injection of 40% glucose solution (2 g/kg BW), using a glucometer. 30 Glucose area under the curve (AUC) above the baseline measurement was calculated using these values. 31
Insulin tolerance test
Three days after the ipGTT, blood glucose measures were obtained from the tail at 0, 5, 10, 15, 30, and 45 min following ip injection of human insulin (1 U/kg BW). 13 The values obtained were used to calculate glucose area above the curve (AAC) that is below the baseline measurement. 31
Plasma insulin levels
Blood samples were obtained by cardiac puncture on anesthetized rats after hemodynamic measurements were taken (see Hemodynamic function). Fasting plasma insulin levels were determined by enzyme-linked immunosorbent assay (ELISA) using a commercial assay kit (Rat insulin ELISA kit; EMD Millipore, USA).
Homeostatic model assessment of insulin resistance
The following formula was used to calculate HOMA IR: fasting plasma glucose (mmol/L) × fasting plasma insulin (mIU/L)/22.5. 32
Hemodynamic function
The rats were anesthetized with an isoflurane/oxygen mix (2.25%/100%) and maintained at 37°C throughout the procedure. A 1.2F catheter (FTS-1211B-0018; Scisense, Inc.) was inserted through the right carotid artery and into the left ventricle. Blood pressure readings were digitized at a sampling rate of 2000 Hz and recorded by computer using iWorx® analytic software (Labscribe2, Dover, NH, USA). Values were obtained during a period of ∼5 min of stable function and averaged from a 10 sec sample.
Western blotting
Liver and adipose tissue samples were homogenized (Fast Prep®24; MP Biomedical, Santa Ana, CA) using NP40 cell lysis buffer (Invitrogen, CA) (3 volumes for adipose and 30 volumes for liver samples) supplemented with protease inhibitor cocktail and phenylmethylsulfonyl fluoride (Sigma-Aldrich). The lysates were centrifuged at 5000 g for 10 min at 4°C. 33,34 Total protein content of the infranatant was determined using BCA Protein Assay Kit (Thermo Fisher Scientific). Twenty micrograms protein samples were separated on 4–10% gradient sodium dodecyl sulfate polyacrylamide gel electrophoresis (SDS-PAGE) gels and then transferred onto a nitrocellulose membrane using a wet transfer technique at 100 V for 1 h. Membranes were blocked with 5% BSA in 0.05% TBST for 1 h and then incubated with the appropriate primary antibody overnight at 4°C. The membranes were washed several times with TBST and then incubated with the appropriate horseradish perioxidase-conjugated secondary antibody for 1 h at room temperature. The signals were visualized using enhanced chemiluminescence. Densitometry was used for band quantification using Alpha View software of the FluorChem HD imaging system (Alpha Innotech, Santa Clara, CA). Phosphorylated proteins were normalized to the corresponding total. All other proteins were normalized to GAPDH. Primary antibodies were from Cell Signaling. ACC (#3676), phospho ACC (#11818), AMPK alpha (#5831), phospho AMPK alpha (#2535), AMPK beta (#4150), phospho AMPK beta (#4181), adiponectin (#2789), fatty acid synthase (FAS) (#3180), peroxisome proliferator-activated receptor gamma (PPAR gamma) (#2435), perillipin (#9349), and secondary antirabbit (#7074).
Statistical analysis
Data were analyzed using the PROC MIXED of SAS 9.4 software. 35 Two-tailed t-tests on all pairs (i.e., pairwise contrast) after analysis of variance (ANOVA) were used. ipGTT and intraperitoneal insulin tolerance test (ipITT) data were analyzed using repeated measures ANOVA. The differences among the means with P-values ≤.05 were considered significant.
Results
Food intake and body weight gain
Rats fed the WP diet had significantly higher body weight gain (P = .04) and higher food intake (P < .0001) compared with the rats fed the PP or control HFD diets (Table 3). Both carrot groups ate more (P = .0005) and had higher body weights (P = .001) than the HFD group, but there were no differences between cultivars (Table 4).
Values are least square means ± standard errors, n = 14–15. Means within column not sharing a letter are significantly different. P < .05.
HFD, high-fat diet; PP, purple potato-supplemented high-fat diet; WP, white potato-supplemented high-fat diet.
Values are least square means ± standard errors, n = 14–15. Means within a column not sharing a letter are significantly different, P < .05.
OC, orange carrot-supplemented high-fat diet; PC, purple carrot-supplemented high-fat diet.
Blood glucose levels during ipGTT
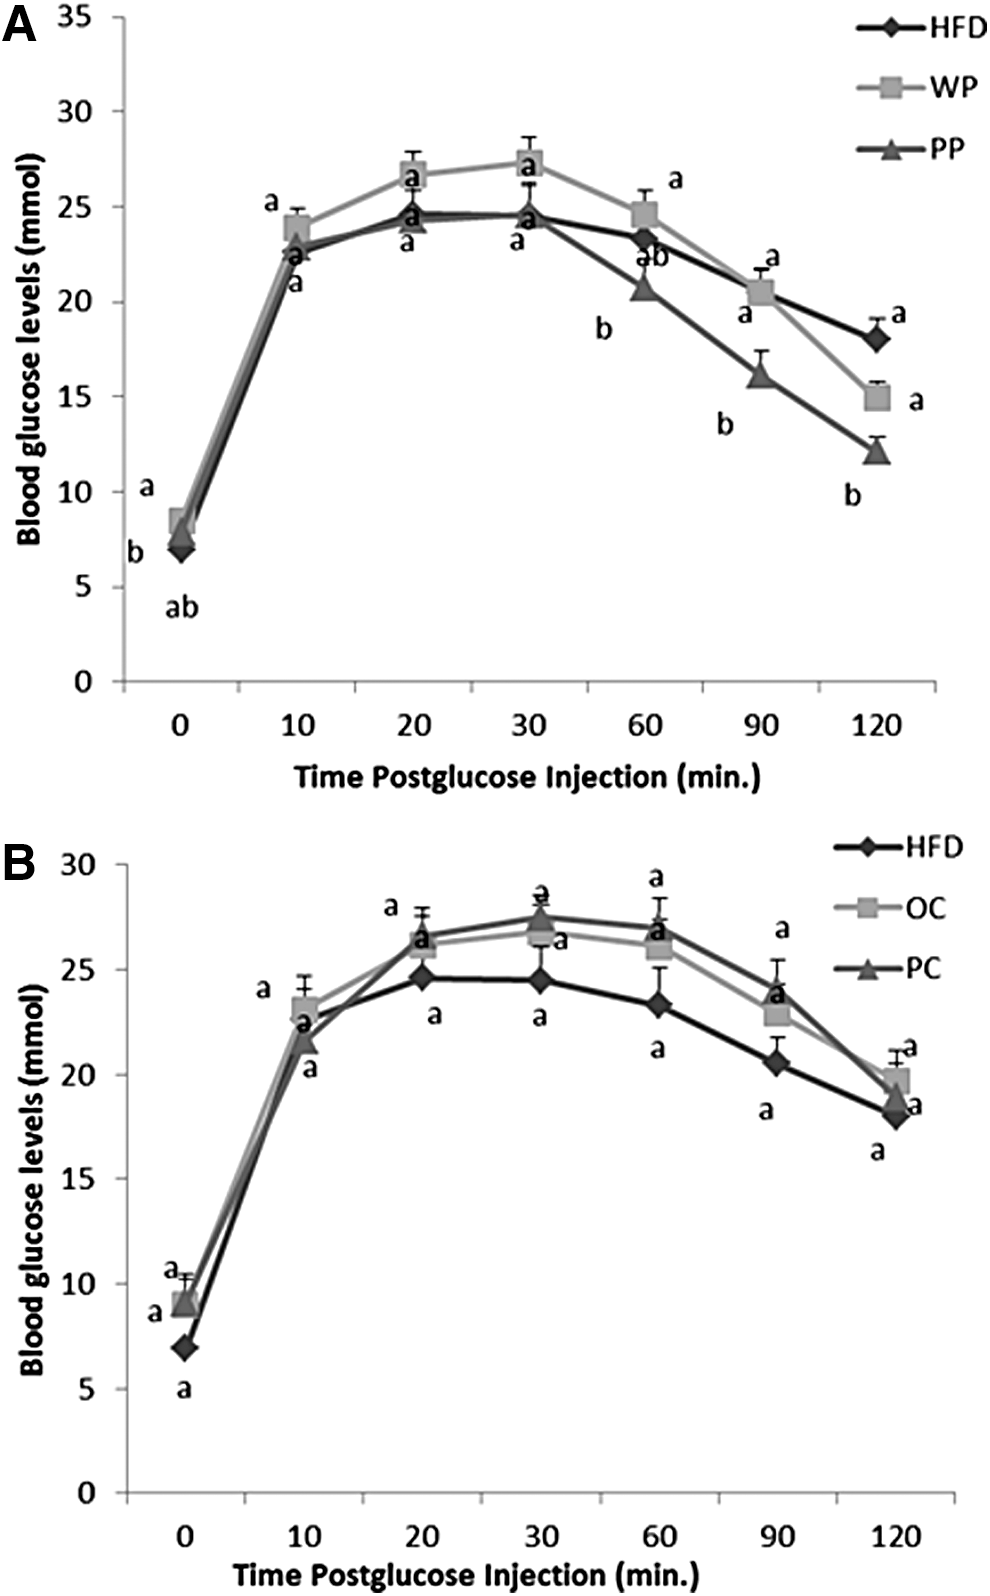
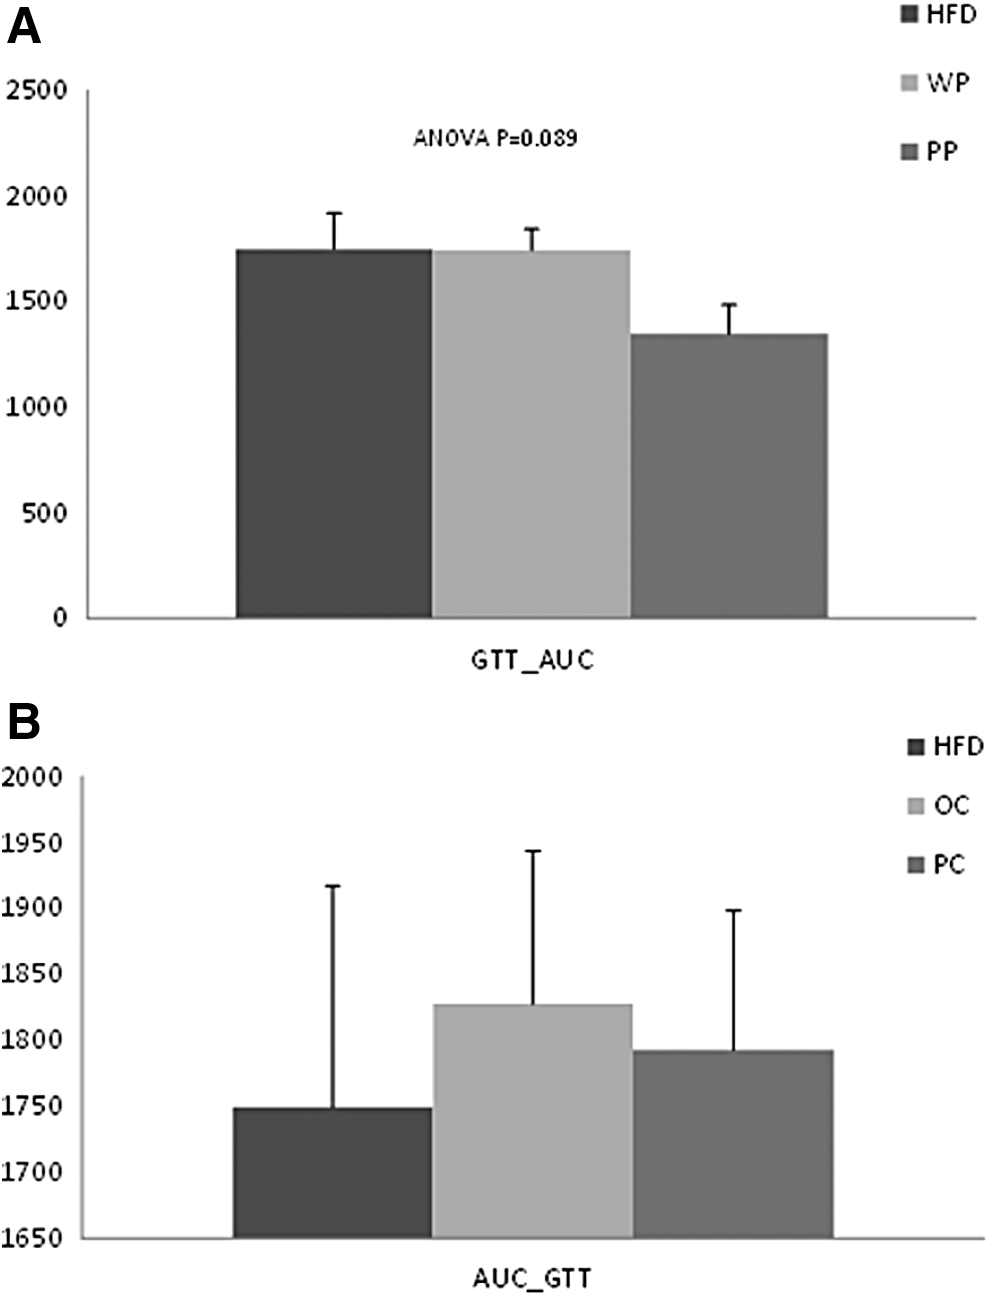
Blood glucose concentrations of the PP group were not significantly different from those of the WP or the HFD group at min 0, 10, 20, and 30 during the ipGTT. However, at 60 min, glucose levels of the PP group were significantly lower than the WP group (P = .049) and at the last two time points of the test, 90 and 120 min, the PP group had significantly lower blood glucose concentrations compared with both the HFD and the WP groups (at min 90, P = .009 and P = .0066, at min 120, P < .0001 and P = .04, respectively) (Fig. 1A). The PP group had numerically smaller AUC compared with both the HFD and the WP groups, but it did not reach significance (P = .089) (Fig. 2A).
Changes in blood glucose levels during GTT of rats: fed
Total plasma glucose concentration during GTT expressed by glucose AUC of rats fed
There were no differences in the blood glucose levels between the PC group and the HFD or the OC groups at any time point of the test (Fig. 1B). Also, there were no differences in glucose AUC among the three groups (Fig. 2B).
Blood glucose levels during ipITT
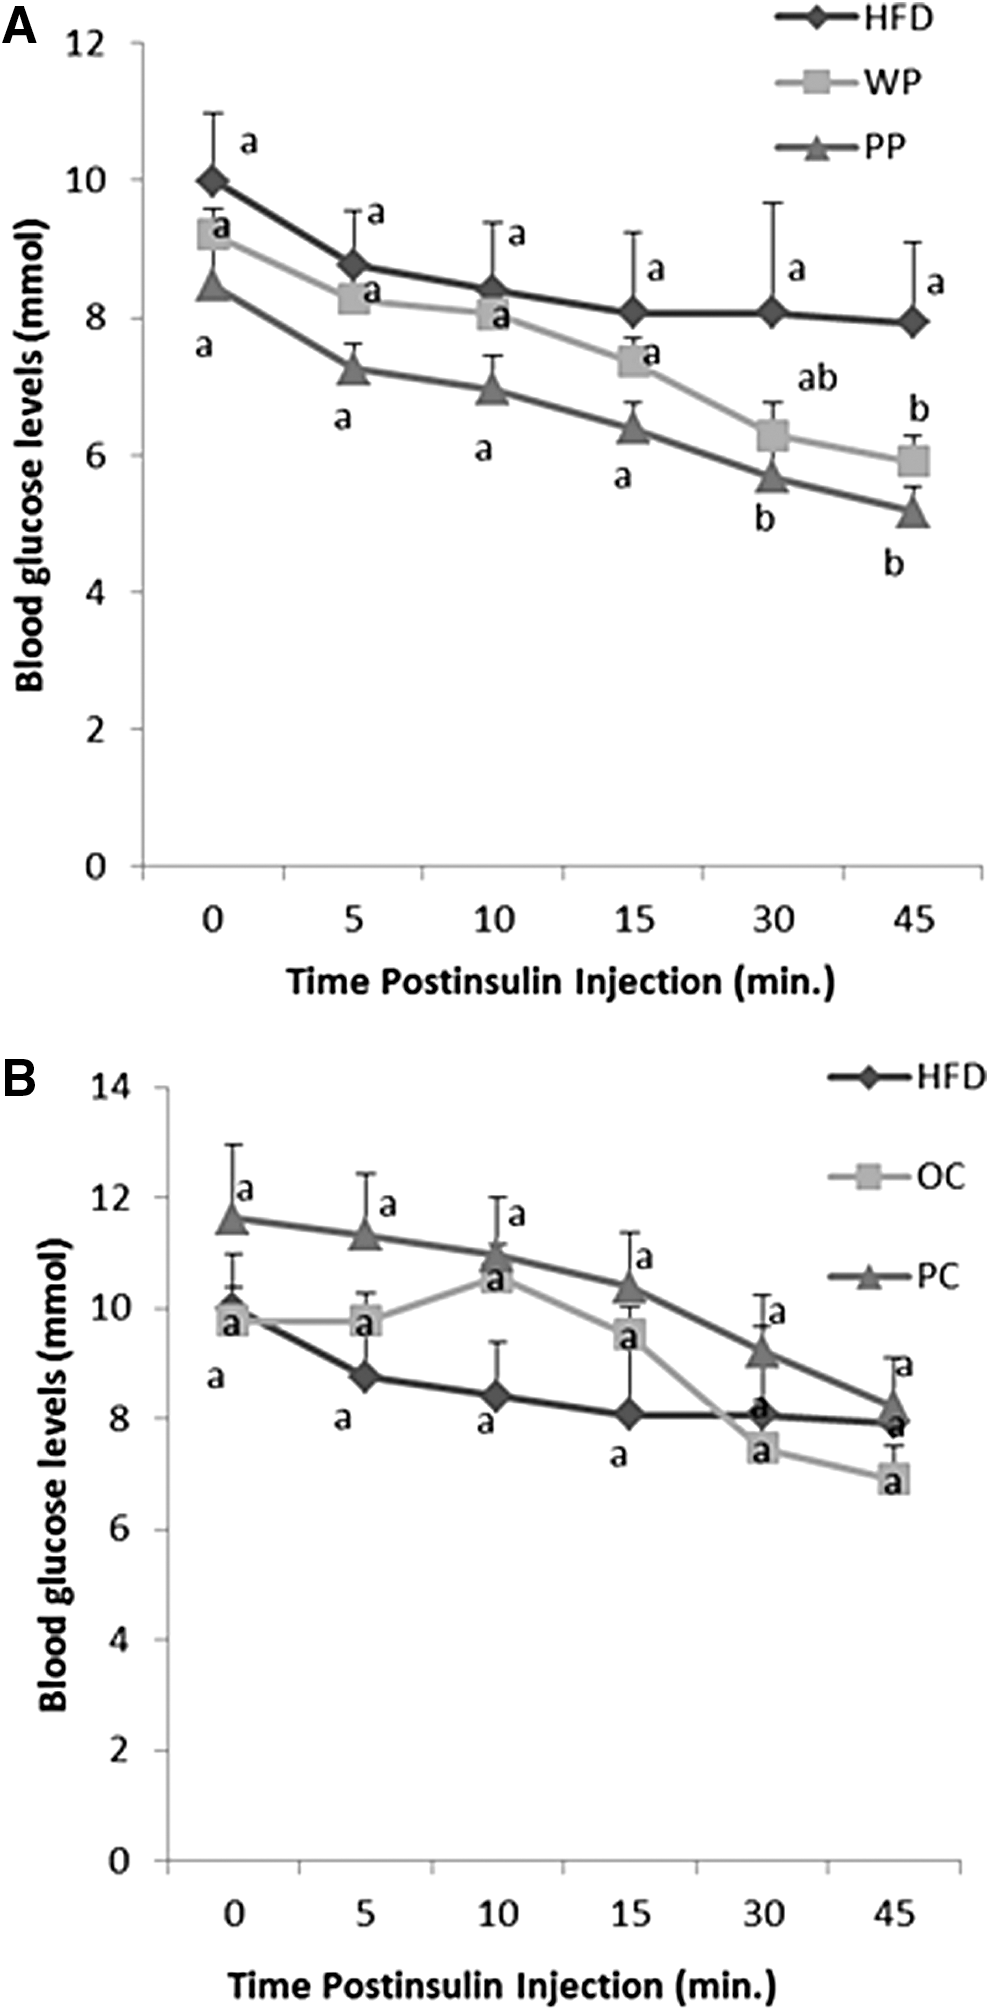
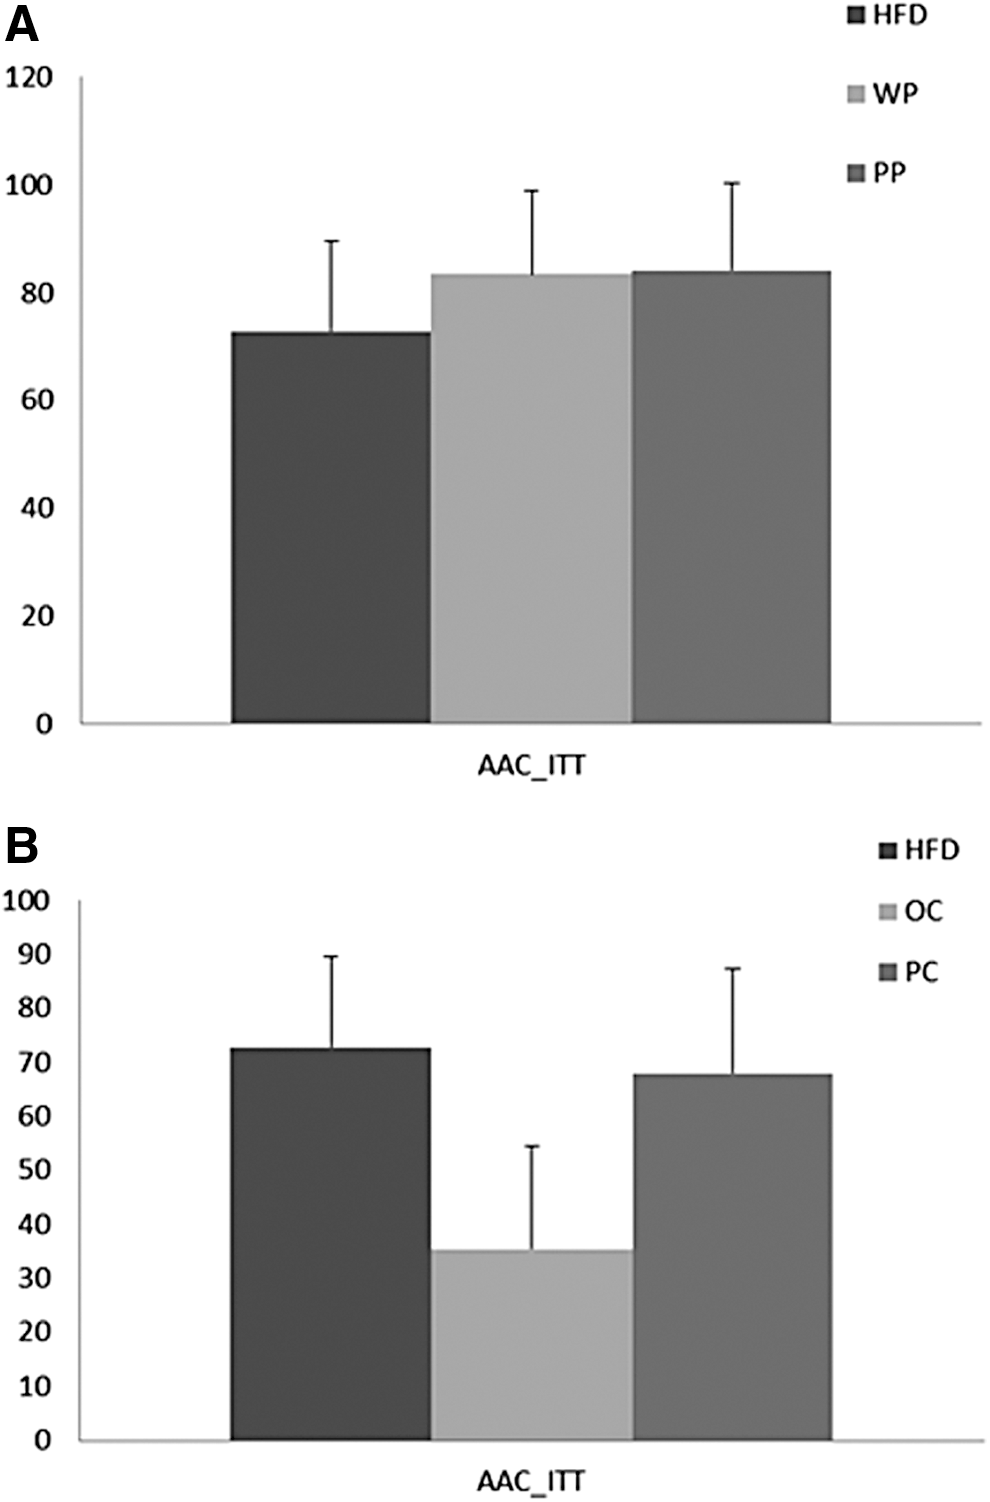
Blood glucose concentrations of the PP group were not significantly different from that of the WP or the HFD group at min 0, 5, 10, and 15 during the ipITT. However, at 30 and 45 min, the PP group showed significantly lower blood glucose concentrations compared with the HFD group (P = .02 and P = .006, respectively) and the WP group was also significantly lower than the HFD at 45 min postinsulin injection (Fig. 3A). Glucose AAC did not significantly differ among the three groups (Fig. 4A).
Changes in blood glucose levels during ITT of rats fed
Plasma glucose disposal during ITT expressed by glucose AAC of rats fed
There were no significant differences in the blood glucose levels of the PC group compared with the HFD or the OC groups at any time point of the test (Fig. 3B), nor were there differences in glucose AAC among the HFD or either carrot cultivar group (Fig. 4B).
Plasma insulin levels
Rats fed both potato cultivars had significantly lower fasting plasma insulin levels compared with the HFD group (Fig. 5A). For the carrot cultivars, the trend was similar, in that the more highly colored variety appeared to have lower insulin values than the more highly colored and both carrot cultivars were lower than the HFD, however, this did not reach statistical significance (Fig. 5C).
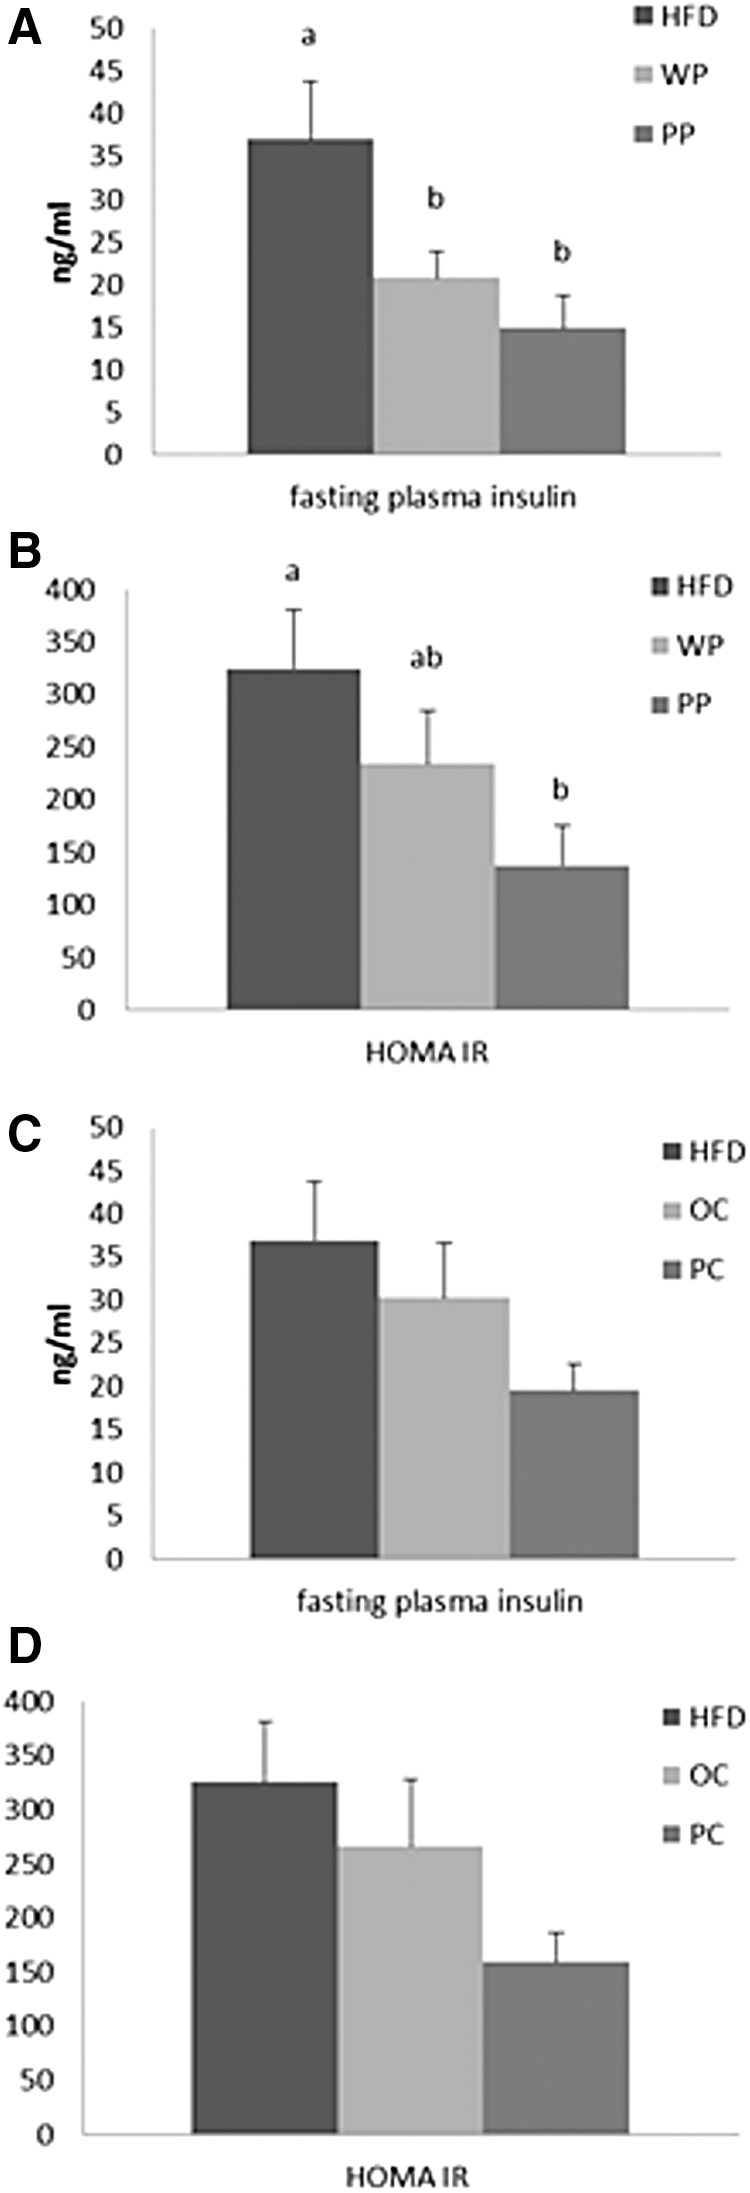
Fasting insulin levels (ng/mL) and HOMA IR of rats fed
Homeostatic model assessment of insulin resistance
The PP group had significantly lower HOMA IR values compared with the HFD group (P = .018) (Fig. 5B). For the WP, the HOMA IR was intermediate between the HFD and PP groups and not significantly different from either. For the carrots, again the trends were similar to the potatoes, but again these differences were not statistically significant (Fig. 5D).
Blood pressure measurements
The systolic and diastolic blood pressures of the WP group were significantly lower than the HFD. In this case, the PP pressures were intermediate between the WP and HFD groups and not statistically different from either (Fig. 6A). In contrast to the results of absolute blood pressures, the PP had significantly lower arterialvenous (AV) differences than that of the HFD (P = .02) and the WP group was intermediate and not different from HFD or PP (Fig. 6B). Left ventricular pressure (LVP) was not significantly different among the three groups (Fig. 6A).

Systolic, diastolic, left ventricular pressures, and AV difference of rats fed
In the carrot arms of the study, the group fed PC demonstrated significantly lower systolic, diastolic, and peak LVP compared with the HFD group (P = .01, <.0001 and .01, respectively). For the OC group, the reduction in systolic blood pressure was not as large as for the PC and not significantly different from either the HFD or PC groups. However, for diastolic blood pressure, the reduction was more marked and resulted in a significantly lower blood pressure than the HFD that was similar to the PC (Fig. 6C). Again, although the AV differences appeared lower for both carrot groups compared with the HFD, this too did not reach statistical significance (Fig. 6D).
Organs weight
Organs weights, expressed as a percentage of body weight, were compared between the groups (Fig. 7). All vegetable groups had significantly lower liver weights than the HFD, however, the light and highly colored cultivars behaved equally well. All other organs weights did not differ among groups.
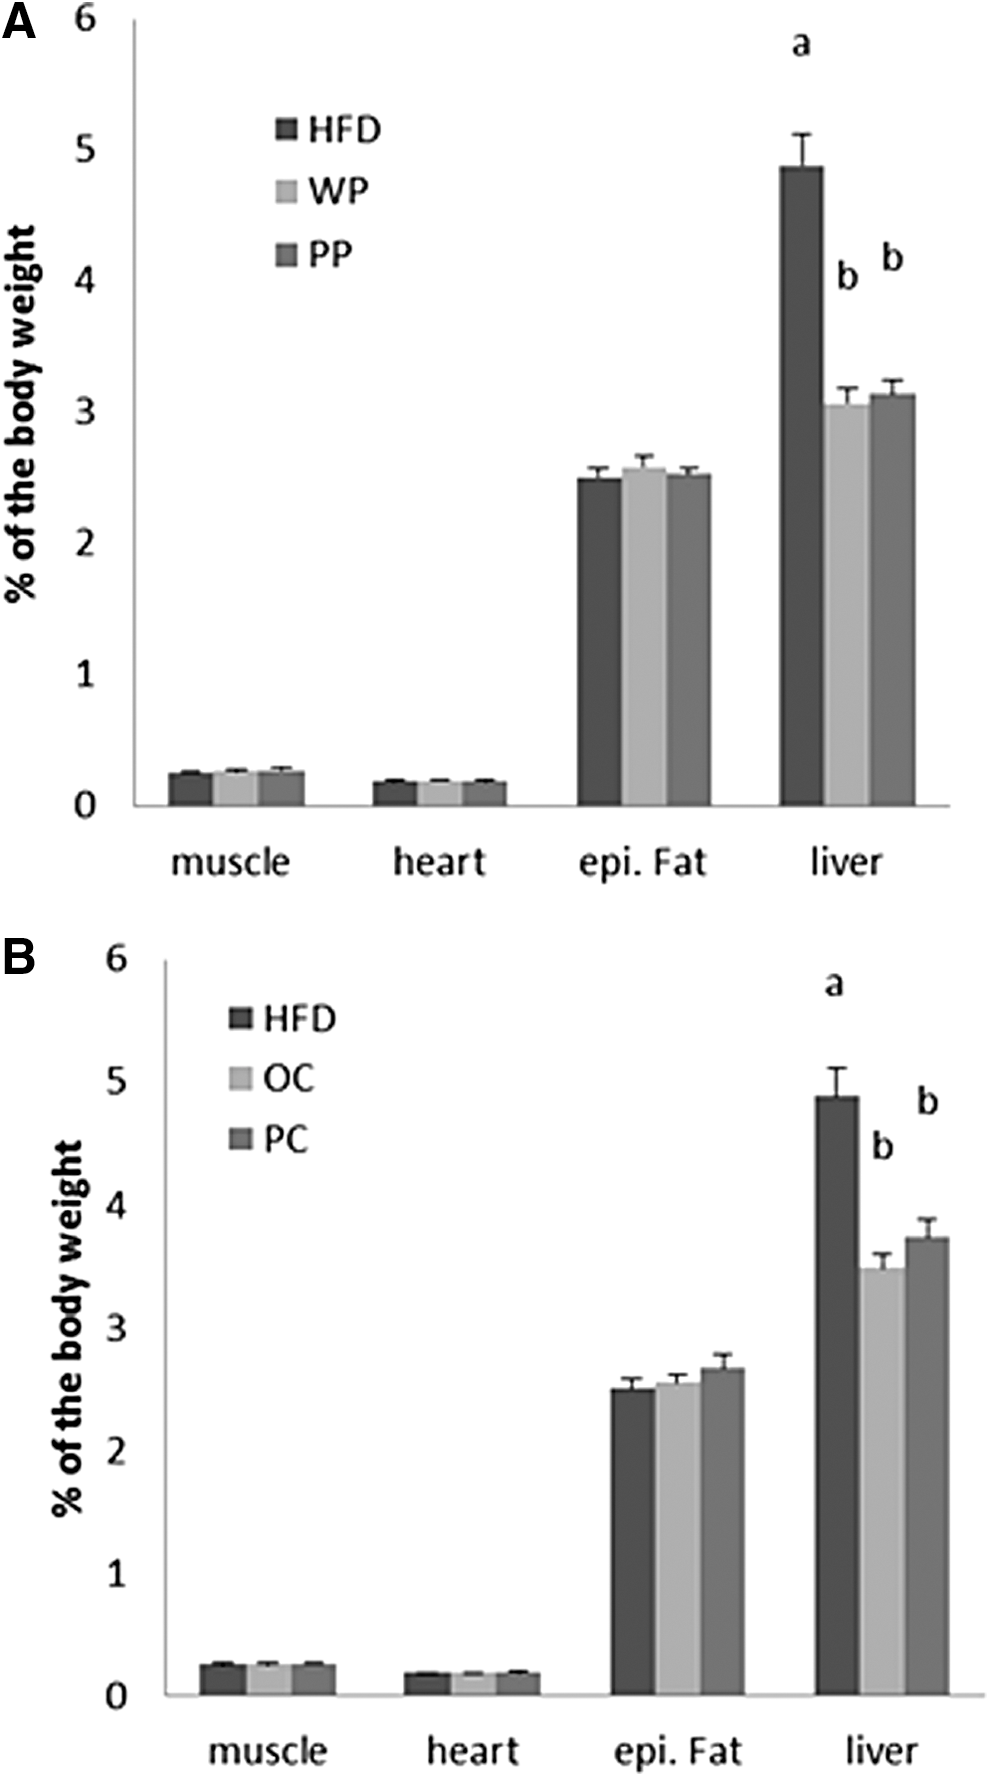
Organ weights' percentage of the body weight of rats fed
Protein expression
No significant differences were seen among the carrot or the potato groups in the expression of the studied proteins in either the adipose or the liver tissues (Figs. 8 and 9).
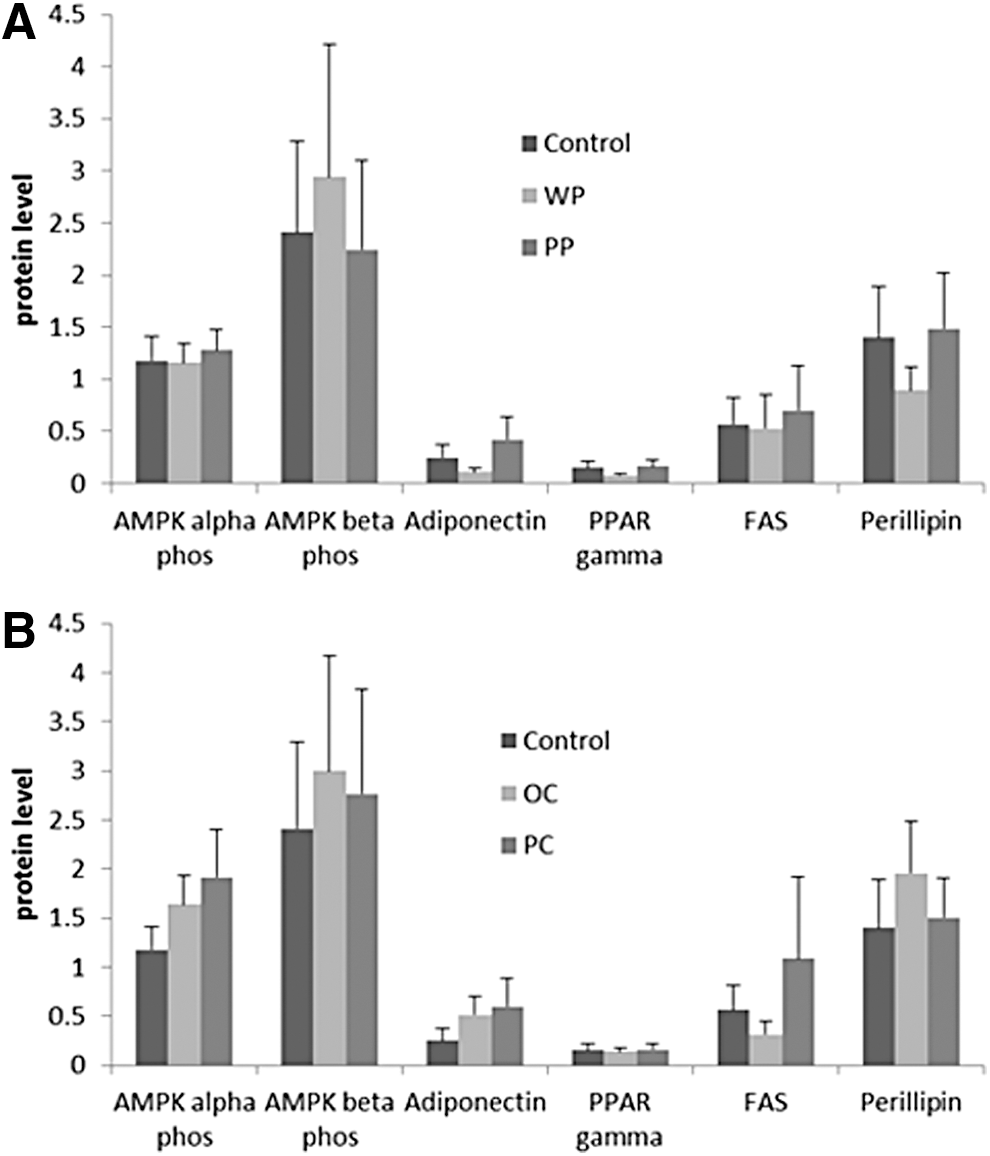
Expression of the proteins of interest in the adipose tissue in rats fed
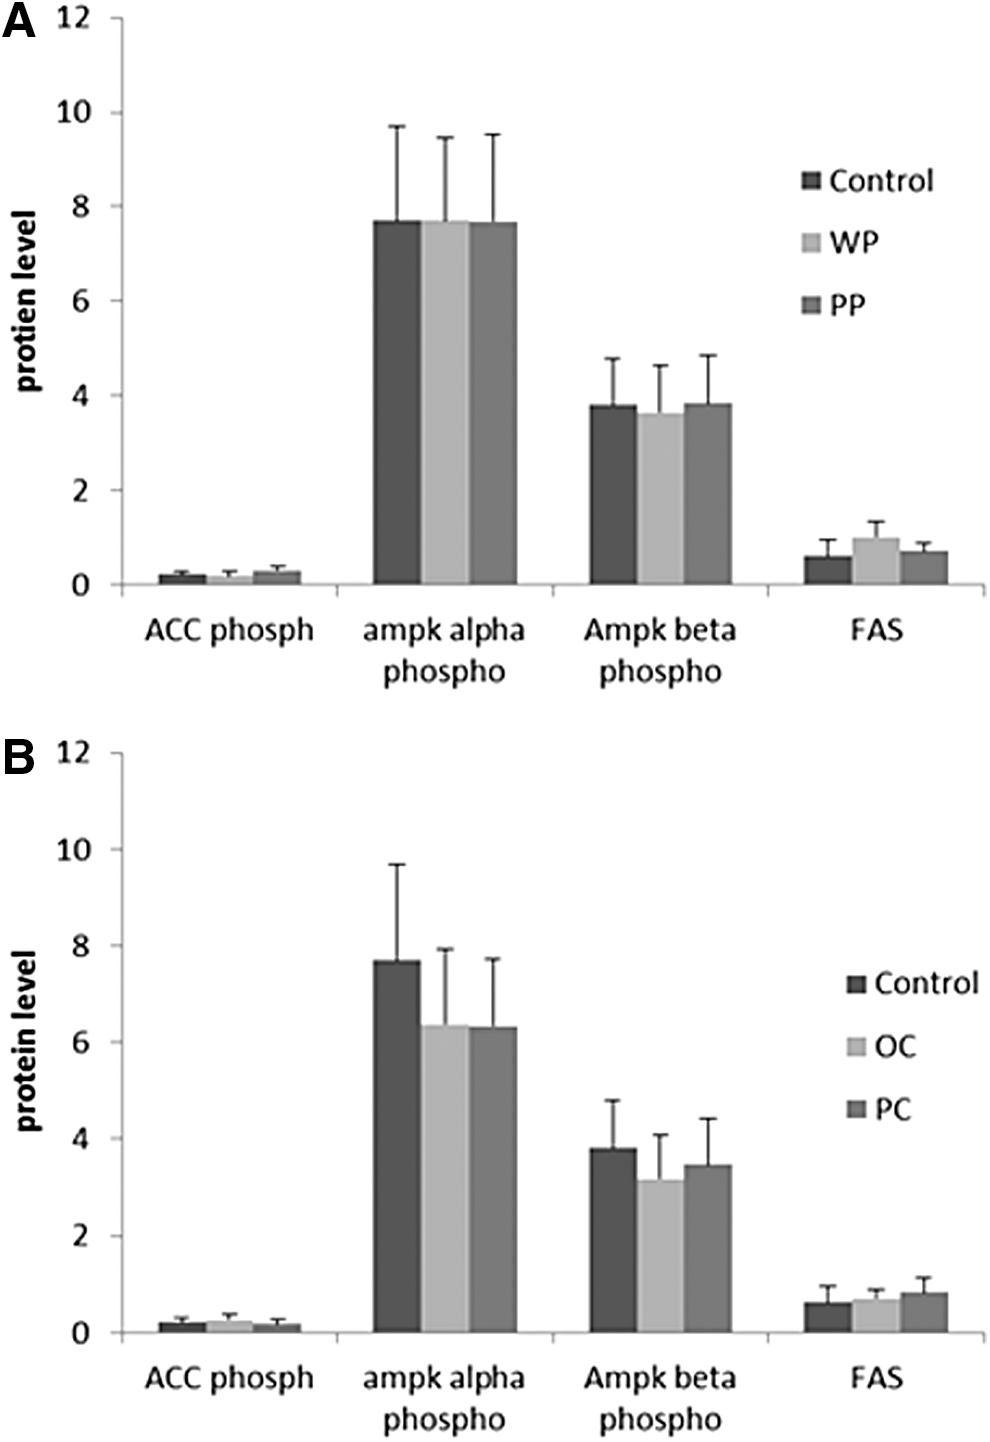
Expression of the proteins of interest in the liver tissue in rats fed
Discussion
The purpose of this study was to examine the potential benefits of substituting vegetables for sucrose in a high-fat diet that produces profound obesity and MetS in susceptible animals. Obese Zucker rats develop obesity rapidly, even on a moderate diet, and quickly develop hypertension and symptoms of T2D. In this study, we showed that substituting purple or white potatoes for sucrose as the major source of carbohydrate, improved glucose tolerance, with purple potatoes being superior to white potatoes. Comparing the impaired glucose tolerance among the groups can be done by either using “the time course of the blood glucose measurements” or the glucose AUC. 36 In our study, we used both ways to express ipGTT and ipITT results. During ipGTT, blood glucose levels of the PP group were significantly lower at the last two time points of the test, while lower only at the last time point for the WP, compared with the HFD group. This indicated that the glucose clearance from the circulation was faster with the PP compared with the other two groups. Glucose tolerance is a reflection of two factors: (1) insulin sensitivity of the target tissues and (2) insulin secretion from the pancreatic β cells in response to glucose. 36 Therefore, the ipGTT does not determine the underlying mechanisms for the observed changes in the glucose tolerance (i.e., the causative mechanism can be changes in insulin sensitivity, insulin secretion, or a combination of both). In our experiment, we did not measure insulin levels at each time point during the ipGTT, so we are unable to discriminate between these possibilities. The lower glucose tolerance of the WP, compared with the PP could be due to impaired insulin secretion rather than impaired insulin sensitivity. However, impaired pancreatic function is typically seen as a late event in this pathologic condition that occurs after the pancreas gets exhausted trying to compensate for insulin resistance. 37 These animals were still relatively young and so pancreatic exhaustion seems unlikely.
We also used fasting plasma insulin levels and HOMA IR to assess insulin resistance. HOMA IR is an accepted, reliable, surrogate measure of insulin resistance in rodents 38 that correlates well with results from the hyperinsulinemic euglycemic clamp. 39 According to both assays, the PP group were more insulin sensitive compared with the control group, and this is also consistent with the findings of the ipITT. However, having impaired glucose tolerance can make the use of the fasting sample indices less reliable. 40,41 Fasting plasma insulin levels will not mirror the degree of insulin resistance if there is defective insulin secretion. In subjects with impaired glucose tolerance or T2D, fasting insulin was not an accurate indicator of insulin resistance. 42 This means that we are unable to conclude that the insulin sensitivity of the WP group did not truly differ from that of the PP since the WP group had poorer glucose tolerance than the PP according to the ipGTT results. This finding is in agreement with several studies that reported an insulin sensitizing effect of other anthocyanin-rich plants. 9 –11,13,14,18
In contrast to the potatoes, carrots substituted for sucrose in a high-fat diet did not exert a statistically significant positive effect on glucose homeostasis or insulin sensitivity, although the trends were very similar for carrots and potatoes. The effect of obesity on insulin resistance could be the explanation for the lack of a positive effect on insulin resistance with the carrot groups. The PC group had significantly higher food intake and body weight gain compared with the HFD group (i.e., they ate more and were more obese, Table 4). The additional obesity could have counteracted any possible benefit of carrots on glucose homeostasis. This hypothesis is further supported by the potato arms of the study. WP was less effective at improving glucose tolerance than PP and the WP group, just like the carrots, also had higher food intake and body weight gain over the course of the study (Table 3).
High blood pressure is one of the major components of MetS and a significant risk factor for the development of CVD. 1,43 In a recent SPRINT study, lowering blood pressure in nondiabetic, high-risk CVD patients reduced major CVD events and overall mortality. 44 Obesity and insulin resistance are recognized as the main factors contributing to the development of hypertension in MetS by inducing endothelial dysfunction, sympathetic nervous and renin–angiotensin system over activity, as well as high levels of inflammatory cytokines. 45 –47 In our study, despite the lack of a significant positive effect of the PC on insulin variables, PC did show significantly lower LVP compared with both the HFD and the OC groups and lower systolic and diastolic pressure than the HFD group. The OC group did have improvements in diastolic blood pressure that were similar to PC, but the effects on systolic blood pressure and LV pressure were less obvious than for the PC. A selective improvement of blood pressure without affecting insulin sensitivity was previously reported with blueberry beverage supplementation in obese humans. 16 Despite the marked obesity and insulin resistance, PC were still able to reduce blood pressure. This means that lowering blood pressure can be achieved independently from processes that impact insulin resistance. Although in our study, the underlying mechanism is still unknown, in other in vitro and ex vivo studies, anthocyanins increased NO synthase levels in both human and bovine cells while decreasing endothelin 1 production. 48,49 Also, blueberry diets decreased the vasoconstrictor response in the aortic rings of rats via a NO synthase-dependent mechanism. 50
Unlike the significant favorable effect on glucose tolerance, The PP diet did not affect blood pressure as dramatically as the WP. In fact, it was intermediate between the HFD and WP groups. This suggests that the bioactives responsible for improvements in glucose homeostasis may be different from those that affect hemodynamic parameters. Clearly anthocyanins are not the only important phytochemicals in these vegetables. It is worth mentioning that the reduction of the AV difference by the PP could be a sign of healthier aortic valves. Aortic valve stenosis or calcification results in LVP overload and a high pressure gradient across the valve. 51
Both purple vegetables and their lightly colored counterparts significantly decreased liver weight compared with the HFD. This could be a sign of normalizing the hepatic enlargement induced by fat deposition. Fatty liver or hepatic steatosis is a condition that is positively correlated with obesity and MetS. 52 An improvement in hepatic steatosis, inflammation, and enzyme activity was reported with tart cherries 10 and purple carrot juice 23 in animal studies. We did not histologically examine the livers to examine lipid deposition or other evidence of steatosis, although this would be something interesting to do in the future.
To begin an investigation of possible mechanisms for the observed effects on glucose homeostasis and blood pressure, we chose a few candidate genes to explore. These included proteins known to affect lipid homeostasis and inflammation; for example, PPAR gamma, adiponectin, perillipin, FAS, phosphorylated Acetyl-CoA carboxylase (phosphor ACC), and phosphorylated AMP-activated protein kinase (phospho AMPK). PPAR gamma is a master regulator of lipid metabolism that promotes adipocyte differentiation and the fat storage ability of the adipose tissue, thereby enhancing insulin sensitivity. 53 Adiponectin is an anti-inflammatory adipose derived cytokine that also has insulin sensitizing effects, 54 whereas ACC is a key enzyme in fatty acid synthesis. Its phosphorylation (i.e., inactivation) by phospho AMPK increases fatty acid oxidation by affecting carnitine palmitoyltransferase I (CPT1) activity. 55,56 However, none of the studied proteins expression was modulated by the experimental vegetables. This probably means that the vegetables, in our experiment, exerted the observed effects through other mechanisms that still need to be explored. We are currently undertaking a proteomic analysis to examine potential mechanisms further.
In conclusion, feeding diets containing white or purple potatoes as replacements for sucrose (simple sugars) can reduce the severity of risk factors associated with MetS in an animal model. Both potato cultivars improved blood pressure and improved glucose tolerance with the purple potatoes being slightly better at improving glucose tolerance and the white potatoes were better at improving hemodynamic variables. On the contrary, carrots as substitutes for sucrose have lesser effects on glucose tolerance while retaining the benefits of vegetable consumption on blood pressure. The reduced benefit of white potatoes on glucose tolerance compared with purple potatoes could be an effect of anthocyanins (Table 2) (higher in purple cultivar) or a result of the higher obesity in WP compared with PP fed animals. The lack of benefit of carrots on glucose tolerance is most likely confounded by their significantly higher obesity than either HFD or potato fed animals. In contrast to the possible role of anthocyanins in glucose regulation, they are unlikely to be the bioactives in these vegetables responsible for the blood pressure lowering activity of both vegetable types and both high and low anthocyanin varieties. The examination of total phenolic, flavonoid, anthocyanin, and carotenoid content do not point to any particular class of compound and thus a more thorough characterization of the individual species and their bioactivities will be necessary to identify the critical bioactives. It is also highly likely that the compounds are acting in additive or synergistic ways that cannot be achieved by feeding purified compounds or extracts. Nonetheless, our study supports the inclusion of whole cooked potatoes or raw carrots in the human diet as part of a strategy to decrease obesity-related disorders, including hypertension and T2D.
Footnotes
Acknowledgments
This work was supported by Ontario Ministry of Agriculture, Food and Rural Affairs (OMAFRA). H.M.A. was supported by OMAFRA-U of G Highly Qualified Personnel (HQP) Scholarship. We gratefully acknowledge the help of Cheryl Cragg and Dr. Heba Salim with the animal care and tissue collection.
Author Disclosure Statement
No competing financial interests exist.