
Abstract
As the use of beverages in diets is increasing, several studies have examined the effect of beverage consumption in human health. Thus, we aimed at identifying specific beverage patterns and determining their associations with obesity and metabolic syndrome (MetS) risk factors in Korean adults. Based on the Korea National Health and Nutrition Examination Survey (KNHANES) 2008–2012 data, 19,800 Korean adults (≥20 years) with a single 24-h dietary recall and health examination data were investigated. All beverage items consumed by participants were categorized into 15 beverage groups based on the KNHANES coding system. Three major beverage consumption patterns were identified according to factor analysis: (1) the “healthy beverage” (high intake of dairy products, 100% fruit/vegetable juices and low intake of alcoholic beverages); (2) the “sugar-sweetened beverage” (high intake of soda, sweetened coffee/tea, and fruit drink); and (3) the “unsweetened beverage” (high intake of unsweetened coffee) patterns. Multivariable logistic regression analyses were conducted to determine the odds of obesity (body mass index ≥25 kg/m2) and MetS (defined by National Cholesterol Education Program III [NCEP III]) for each beverage pattern after controlling for covariates. Adjusted odds ratios (AORs) and 95% confidence intervals (CIs) for associations of the “healthy beverage” pattern with risks of obesity, abdominal obesity, and elevated triglycerides, fasting blood glucose (FBG), and blood pressure (BP) were 0.88 (0.79–0.98), 0.83 (0.74–0.92), 0.88 (0.78–0.99), 0.85 (0.79–0.98), and 0.81 (0.72–0.92), respectively. AORs (95% CIs) of associations of the “sugar-sweetened beverage” pattern with risks of abdominal obesity, elevated FBG and BP were 1.15 (1.03–1.30), 1.14 (1.01–1.29), and 1.18 (1.04–1.33), respectively. However, no associations were found between the “unsweetened beverage” pattern and any parameters examined. Intake of healthy beverages should be encouraged to reduce risks of obesity and metabolic abnormalities; however, individuals who consume sugar-sweetened beverages should be advised on the adverse effects of those beverages on the risk of obesity and MetS.
Introduction
O
Since obesity and MetS are preventable and controllable diseases, various risk factors have been identified. As a result, diet emerged as a modifiable important factor of obesity and MetS. 8,9 In addition, the relations of the consumption of beverages and foods with various health outcomes have been examined. Many investigators have examined the beneficial or deleterious effect of specific beverage consumption on health outcomes among Korean adults. In a recent cross-sectional study, the consumption of dairy products was associated with decreased risk of obesity and MetS. 10 Chung et al. reported that consumption of soft drinks more than four times/week was associated with higher risk of MetS in women. 11 Another study has reported that the risks of abdominal obesity, hypertension, and elevated fasting blood glucose (FBG) decreased as the consumption of the black/brewed coffee increased in Korean adults. 12 Two prospective studies using the Korean Genome and Epidemiology Study demonstrated an inverse association of milk consumption 13 and a positive association of sugar-sweetened beverage consumption 14 with MetS. Of note, most studies focused only on a specific beverage item rather than on the comprehensive consumption pattern of beverages to evaluate the risk of obesity and MetS components.
Moreover, no comprehensive study has yet examined the relationship of any diseases with the beverage consumption pattern independent of other food consumption. Beverage consumption has been generally increasing in Korea. 15 The beverage industry has become an important sector of the food industry. In addition, consumption of various beverages has emerged as a common phenomenon in Korean's dietary habits. 16 Therefore, additional studies should examine the beverage consumption patterns rather than consumption of individual beverages in relation to specific health outcomes. 17 However, little is known about the major beverage consumption patterns of Korean adults and their relation to the risk of obesity and MetS components.
Therefore, our study aimed to identify beverage consumption patterns and determine the associations of adherence to certain beverage consumption patterns with the risks of obesity and MetS with the goal to identify healthy ways for the Korean adult population to consume beverages.
Materials and Methods
Data source and study population
The data used in this study came from the Korea National Health and Nutrition Examination Survey (KNHANES), which is an ongoing survey designed using a complex, stratified, multistage, probability cluster sampling to obtain nationally representative estimates. It consists of three survey components including health interview, health examination, and nutrition survey to assess the health and nutritional status of noninstitutionalized, civilian population of Korea. All participants provided written informed consent and all the survey protocols and procedures were approved by the Korea Centers for Disease Control and Prevention (KCDC) Institutional Review Board. 18,19
A total of 26,634 Korean adults aged 19–64 years from the KNHANES 2008–2012 completed the nutrition survey. Those who had total daily energy intakes of <500 kcal/day or >5000 kcal/day (n = 3876), pregnant and lactating women (n = 309), and had taken medications for diabetes, hypertension, and dyslipidemia (n = 4386) were excluded. Additionally, we excluded individuals who had missing data on socio-demographic characteristics (n = 1762), health-related behaviors (n = 102), and biomarkers (n = 486). Of the remaining 15,713 (6523 men and 9190 women) Korean adults were included in the final analyses.
Beverage consumption pattern analysis
The KNHANES provides 24-h dietary recall data about consumption of various foods and beverages through nutrition survey conducted using open-ended questionnaire by trained interviewers. 20 In this study, a single 24-h dietary recall data were used to identify the beverage consumption patterns and to estimate nutrient and food intakes across the beverage consumption patterns. All beverages consumed by each participant were aggregated into 15 beverage groups (soda; sugar added fruit juice; fruit-flavored fruit drink; sports/energy drink; other sugar-sweetened beverage; sweetened tea; sweetened coffee; unsweetened tea; unsweetened coffee; milk; milk alternatives including soy milk; yogurt; unsweetened 100% fruit juice; and unsweetened 100% vegetable juice; alcoholic beverage) based on the KNHANES coding system 18 and previous studies 21 –26 as shown in Figure 1.
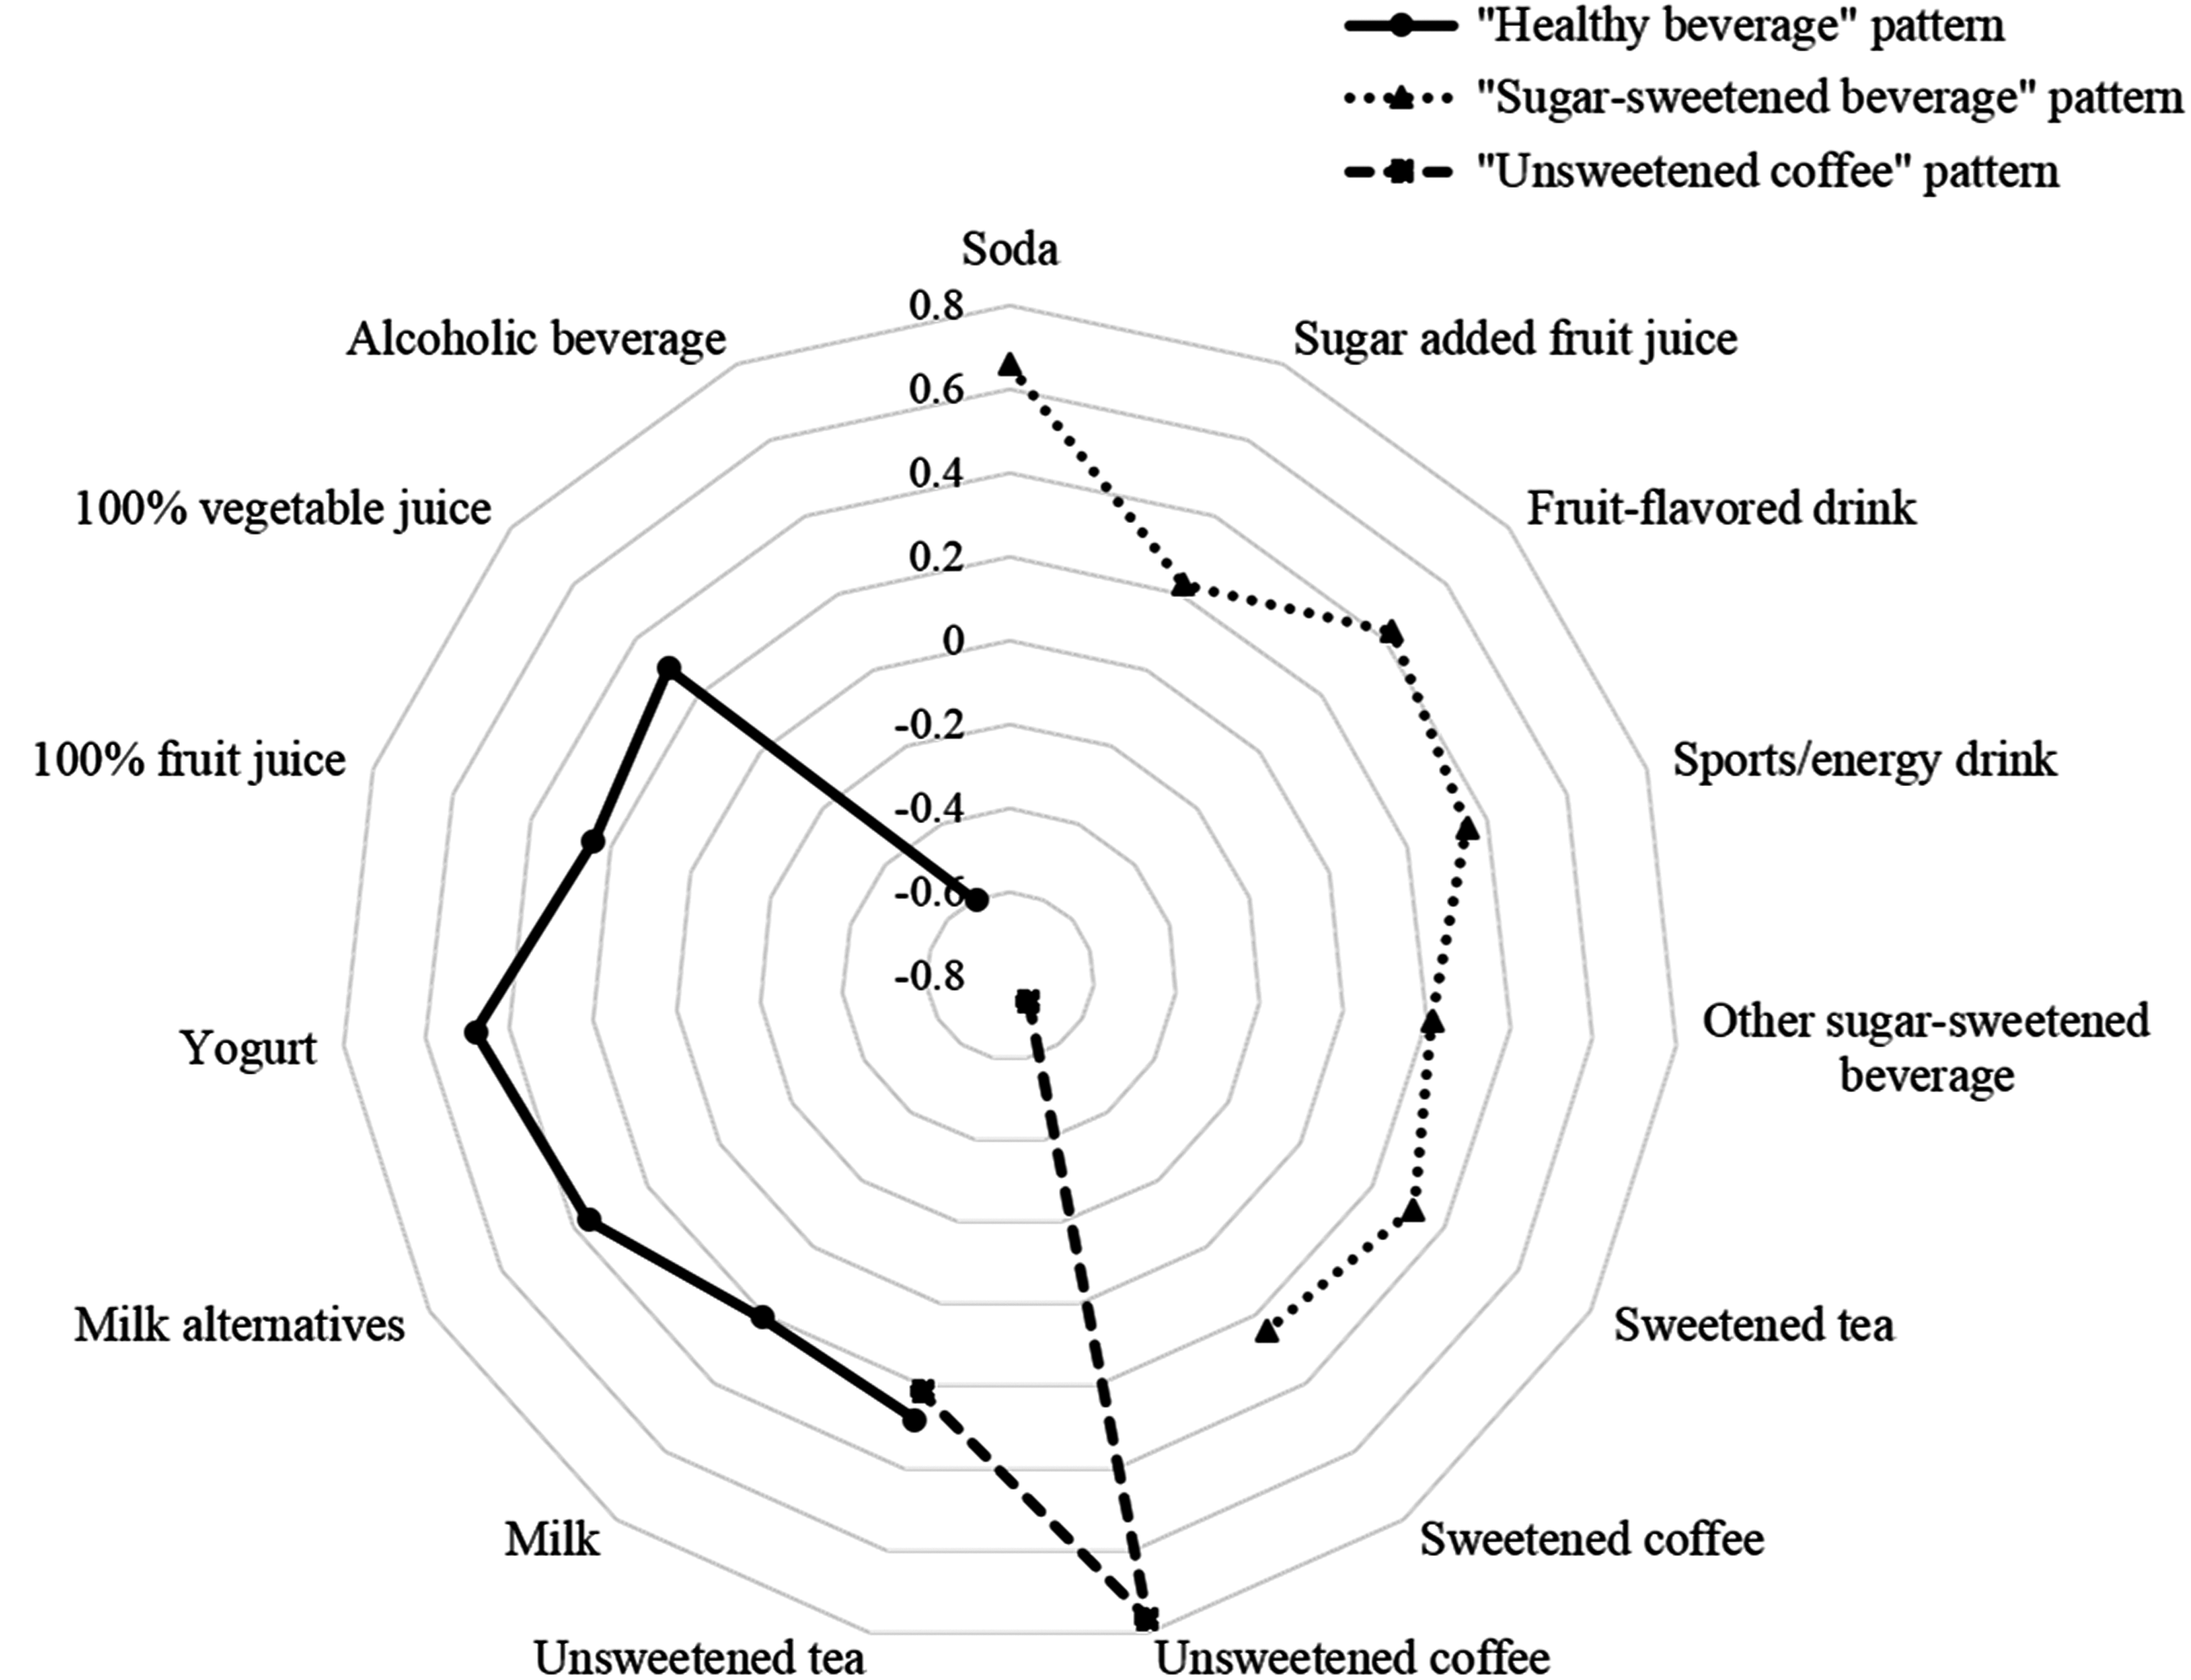
Factor loadings for the three beverage consumption patterns were identified according to a factor analysis. Factor loading values of <|0.20| were not shown for simplicity; the “healthy beverage,” “sugar-sweetened beverage,” and “unsweetened coffee” patterns accounted for the 7.4%, 7.3%, and 8.0% of the variance, respectively, and the total variance explained by three beverage consumption patterns was 22.6%. The “healthy beverage” pattern (solid black line) was characterized by a high consumption of milk, yogurt, unsweetened tea, 100% fruit and vegetable juices with a relatively low consumption of alcoholic beverages. The “sugar-sweetened beverage” pattern (dotted black line) was characterized by high intakes of sugar-sweetened beverages such as sodas, sugar added fruit juice, fruit drinks, and sweetened tea/coffee. The “unsweetened coffee” pattern (dashed black line) was characterized by a high intake of unsweetened coffee with a very low intake of sweetened coffee and tea.
Beverage consumption patterns were extracted based on total amount of each beverage group intake by using factor analysis (PROC FACTOR). Principle component analysis with varimax rotation was used to achieve simpler structure of beverage consumption patterns and higher interpretability. 27 Beverage groups with factor loading values ≥|0.20| were defined strong association and used to characterize each pattern. On the basis of eigenvalue (>1.08), scree plot, and interpretability of each pattern, we extracted three beverage consumption patterns. Extracted major beverage consumption patterns were labeled based on high and/or low loading on certain beverage groups. Each participant received factor scores of each identified beverage consumption pattern and was categorized according to tertile cut-points. These factor scores were used to assess the adherence of specific beverage consumption pattern and included in the further analyses.
Definition of obesity and MetS
Body mass index (BMI) was calculated as body weight (kg) divided by squared height (m2) in kg/m2. Obesity was determined as BMI ≥25 kg/m2 using the World Health Organization criteria for the Asia-Pacific populations. 28 According to the National Cholesterol Education Program Adult Treatment Panel III (NCEP ATP III) 29 and International Diabetes Federation, 30 individuals with three or more of the following risk factors were defined as having MetS: (1) abdominal obesity (waist circumference ≥90 cm for men and ≥80 cm for women); (2) elevated triglyceride (TG; fasting TG ≥150 mg/dL); (3) low high-density lipoprotein cholesterol (HDL-C) levels (fasting HDL-C <40 mg/dL for men and <50 mg/dL for women); (4) elevated FBG levels (FBG ≥100 mg/dL); and (5) elevated blood pressure (BP; systolic BP ≥130 mmHg or diastolic BP ≥85 mmHg).
Potential covariates
Information on socio-demographic characteristics such as sex, age, income, education level, and on health-related variables including smoking status, physical activity, and day of week of dietary intake was collected by a structured questionnaire for Korean adults aged 19–64 years. All socio-demographic and health-related variables were included as covariates in the analysis model after reclassification as follows: sex (men or women); age (19–29, 30–49, 50–64 years of age); income (lowest, lower middle, upper middle, or highest; income level was divided into four categories with the equalized household income calculated from the total household income divided by the square root of the number of household members); education level (elementary school graduates or less, middle school graduates, high school graduates, or more than college graduate); smoking status (nonsmoker, former smoker, or current smoker); regular physical activity (yes or no; participants who were walking ≥5 time a week for ≥30 min each time were assigned to the regular physical activity group), and day of recalled intake (Monday to Thursday or Friday to Sunday).
Statistical analysis
All statistical analyses were conducted using SAS (version 9.4; SAS Institute, Inc., Cary, NC, USA). According to the KNHANES analytic guidelines, the PROC SURVEY procedures with sample weights, strata, and primary sampling units were used to account for the complex KNHANES survey design. 18 A two-tailed P value <.05 was considered statistically significant in all analyses. Categorical variables were expressed as frequencies with weighted percentages. Continuous variables were reported as means ± standard errors.
Chi-square test was performed to compare socio-demographic and health-related behavior characteristics across the tertiles of beverage consumption pattern scores (Table 1). Multiple linear regressions adjusting for covariates were conducted to explore whether there are differences in energy, nutrient, and food group intakes across the tertiles of beverage consumption pattern scores (Tables 2 and 3). Multivariable logistic regressions with three models were performed to determine the associations of beverage consumption patterns with risk of obesity and MetS risk factors (Table 4). Model 1 was unadjusted; Model 2 included sex, age, income, education level, smoking status, physical activity, and day of recalled intake; Model 3 included all of these in addition to total daily energy intake. Subgroup analyses were further conducted to assess sex and age differences in the associations of beverage consumption patterns with obesity and MetS risks (Supplementary Tables S1 and S2; Supplementary Data are available online at
Data were from the KNHANES. All data except for sample size were weighted accounting for the complex study design according to the directions of the KNHANES analytical guidelines.
Values represented frequency (Wt'd %).
Having physical activity was defined as walking ≥5 time a week for ≥30 min each time.
P < .01.
KNHANES, Korea National Health and Nutrition Examination Survey; Wt'd %, weighted percentage.
Data were from the KNHANES. All data except for sample size were weighted accounting for the complex study design according to the directions of the KNHANES analytical guidelines. The multiple linear regression models included covariates such as sex, age (continuous), income (lowest, lower middle, upper middle, or highest), education level (elementary school graduates or less, middle school graduates, high school graduates, or more than college graduate), smoking status (nonsmoker, former smoker, or current smoker), and physical activity (yes or no).
Values represented mean ± SEs.
The models also included total daily energy (continuous) intake as an independent variable.
P-trends obtained from the linear regression analysis, * P < .05; ** P < .01.
KDRI, Dietary Reference Intakes for Koreans; SE, standard error.
Data were from the KNHANES. All data except for sample size were weighted accounting for the complex study design according to the directions of the KNHANES analytical guidelines. The multiple linear regression models included covariates such as sex, age (continuous), income (lowest, lower middle, upper middle, or highest), education level (elementary school graduates or less, middle school graduates, high school graduates, or more than college graduate), smoking status (nonsmoker, former smoker, or current smoker), and physical activity (yes or no).
Values represented mean ± SEs.
P-trends obtained from the linear regression analysis, * P < .05; ** P < .01.
SE, standard error.
Data were from the KNHANES. All data except for sample size were weighted accounting for the complex study design according to the directions of the KNHANES analytical guidelines. Multivariable logistic regression analysis was performed to estimate odds ratio for obesity, MetS, and its components for study subjects from the KNHANES 2008–2012 in three models: Crude model (Model 1) was unadjusted; Model 2 was adjusted for sex, age, education level, income, smoking status, physical activity, BMI (except for obesity and abdominal obesity), day of recalled intake; Model 3 was additionally adjusted for total daily energy intake.
Definitions: obesity, BMI ≥25 kg/m2; MetS, three or more of following risk factors: (1) abdominal obesity, WC ≥90 cm (men) or WC ≥80 cm (women); (2) lowered HDL-C, fasting HDL-C <40 mg/dL (men) or <50 mg/dL (women); (3) elevated TG, fasting TG ≥150 mg/dL; (4) elevated FBG, FBG ≥100 mg/dL; (5) elevated BP, systolic BP ≥130 mmHg or diastolic BP ≥85 mmHg.
P-trends obtained from the multiple logistic regression model with diagnosis of obesity or MetS risk factors as the outcome variable, * P < .05; ** P < .01.
AOR, adjusted odds ratio; BMI, body mass index; BP, blood pressure; CI, confidence interval; FBG, fasting blood glucose; HDL-C, high-density lipoprotein cholesterol; MetS, metabolic syndrome; TG, triglyceride; WC, waist circumference.
Results
Factor analysis and beverage consumption patterns
A factor loading matrix for each beverage consumption pattern of Korean adults is presented in Figure 1. The extracted three beverage consumption patterns accounted for the 22.61% of the total variance. The first pattern, which we named “healthy beverage” pattern, has been characterized by high consumption of milk, yogurt, unsweetened tea, and 100% fruit and vegetable juices (no sugar added) with relatively low consumption of alcoholic beverages. The second pattern was named the “sugar-sweetened beverage” pattern, because of the high consumption of sugar-sweetened beverages such as sodas, sugar added fruit juice, fruit drinks, and sweetened tea/coffee. The third pattern was characterized by high intake of unsweetened coffee with a very low intake of sweetened coffee. We defined this pattern as “unsweetened coffee” pattern.
General characteristics of participants by beverage consumption patterns
The characteristics of study participants according to the tertiles of each beverage consumption pattern are shown in Table 1. Most of the socio-demographic and health-related characteristics including sex, age, income and education levels, smoking, physical activity, and day of recalled intake differed significantly across the tertiles of each beverage consumption pattern (all, P < .01). Only the income level was not associated with a tertile of the “sugar-sweetened beverage” pattern score. Individuals that followed the “healthy beverage” pattern were more likely to be women, middle-aged adults, college graduates, and nonsmokers (Table 1). Compared with individuals in the lowest tertile of the “sugar-sweetened beverage” pattern, those in the highest tertile were more likely to be men, younger, and with a higher degree. Individuals that followed the “unsweetened coffee” pattern were more likely to be women, individuals with higher income, highly educated, nonsmokers, and have regular physical activity.
Associations of beverage consumption patterns with nutrient and food group intakes
Energy and nutrient intakes across the tertiles of beverage consumption pattern score are shown in Table 2. Total daily energy intake and energy from beverages and alcoholic beverages increased, but energy intake from foods and percent energy from foods increased significantly with increasing beverage consumption pattern scores in both the “healthy beverage” and “unsweetened coffee” patterns (all, P < .01). In contrast, the “sugar-sweetened beverage” pattern was positively associated with high total daily energy intake and increased energy from beverages and alcoholic beverages, but negatively associated with percent energy from foods. Participants that adhered to the “healthy beverage” pattern had a greater intake of dietary fiber and calcium and lower intake of sodium (all, P < .01) (Table 2). Energy intake from fat significantly increased, but dietary fiber and calcium decreased across the tertiles of the “sugar-sweetened beverage” pattern scores. In the “unsweetened coffee” pattern, percent energy intakes from protein and fat and calcium intake increased as the beverage consumption pattern scores increased.
Food group intakes according to the tertiles of beverage consumption pattern score are presented in Table 3. Consumption of food groups differed significantly across tertiles of beverage consumption patterns. Consumption of all types of grains (whole grains and white rice/refined grains), fruits, and eggs was positively associated with, whereas consumption of meat/poultry, fish/shellfish, oils/fats was negatively associated with a tertile of the “healthy beverage” pattern scores. However, the daily consumption of whole grains, vegetables, fruits, and eggs decreased, while the daily consumption of meat/poultry, fish/shellfish, and oils/fats increased in the “sugar-sweetened beverage” pattern. Individuals that followed the “unsweetened coffee” pattern showed the highest consumption of whole grains and vegetables, and the lowest consumption of white rice/refined grains (Table 3). Participants that showed the highest scores of the “unsweetened coffee” pattern consumed fewer sugar sweetened coffee; however, the consumption of sugars/sweets and breads increased among individuals that adhered to the “unsweetened coffee” pattern.
Risk of obesity and MetS according to beverage consumption patterns
Multivariable-adjusted ORs for obesity and risk factors of MetS according to the tertiles of beverage consumption patterns are listed in Table 4. When sex, age, income, education level, smoking status, physical activity, day of recalled intake, and total daily energy intake were controlled, individuals in the highest tertile of the “healthy beverage” pattern scores showed reduced risks of obesity (adjusted odds ratio [AOR], 0.88; 95% confidence interval [CI], 0.79–0.98; P for trend = .0173), abdominal obesity (AOR, 0.83; 95% CI, 0.74–0.92; P for trend = .0007), elevated TG (AOR, 0.88; 95% CI, 0.78–0.99; P for trend = .0410), elevated FBG (AOR, 0.85; 95% CI, 0.75–0.96; P for trend = .0058), elevated BP (AOR, 0.81; 95% CI, 0.72–0.92; P for trend = .0005), and increased probability of low HDL-C (AOR, 1.23; 95% CI, 1.11–1,36; P for trend = .0645) than those in the lowest tertile (Table 4). In the same model, individuals who followed the “sweetened beverage” pattern showed the higher odds of elevated FBG (AOR, 1.14; 95% CI, 1.01–1.29; P for trend = .2455) and elevated BP (AOR, 1.18; 95% CI, 1.04–1.33; P for trend = .0103) compared with individuals who did not. In contrast to the other two beverage patterns, the “unsweetened coffee” pattern did not show any significant association with obesity and MetS.
A range of subgroup analyses by sex and age groups are presented in Supplementary Tables S1 and S2. An increase in the “healthy beverage” pattern score was associated with decreased risk of elevated TG, FBG, and BP in men and general obesity and abdominal obesity in women (Supplementary Table S1). There was a slight variation regarding the relationship between specific beverage consumption patterns and the risk of obesity and MetS by age groups (Supplementary Table S2). Among young adults aged 19–29 years, there was no significant association between beverage consumption patterns and the risk of obesity and MetS. However, in adults between 30–49 and 50–64 years, adherence to the “healthy beverage” pattern was associated with a decreased risk of obesity and metabolic abnormalities. In contrast, adherence to the “sugar-sweetened beverage” pattern was associated with an increased risk of metabolic abnormalities.
Discussion
In this study, we identified three prominent beverage consumption patterns within the Korean population. The “healthy beverage” pattern was associated with reduced risks of obesity and most of MetS components. In contrast, the “sugar-sweetened beverage” pattern was associated with the increased probability of abdominal obesity, elevated FBG and BP. The “unsweetened coffee” pattern showed no association with the odds of obesity and MetS components.
Our results showed that the “healthy beverage” pattern was a unique beverage consumption pattern. Individuals that adhered to the “healthy beverage” pattern consumed higher amounts of healthy beverages such as dairy products, unsweetened tea, and 100% fruit and vegetable juices than individuals adhering to the “sugar-sweetened beverage” or “unsweetened coffee” patterns; however, they consumed considerably lower amount of alcoholic beverages. In accordance with our findings, a cross-sectional study, which identified beverage intake patterns by cluster analysis, found that Canadian children and adolescents having healthy beverage cluster consumed more healthy beverages (e.g., fruit juices or milks) and less unhealthy beverages (e.g., soft drinks and fruit drinks) than individuals in other beverage clusters. 31 We also found that the “healthy beverage” pattern was highly loaded with beverages, such as milk, 10 yogurt, 32 tea, 33,34 fruit and vegetable juices, 35,36 which are known to ameliorate obesity and MetS. Furthermore, individuals who adhere to the “healthy beverage” pattern were prone to consume more whole grains, fruits, eggs, dietary fiber, calcium, and less oils/fats and sodium. Our findings are in line with epidemiological studies in U.S. adults indicating that individuals with healthier food patterns tend to have healthier beverage patterns. 37
The “sugar-sweetened beverage” pattern was prevalent in younger and highly educated adults. Our findings are consistent with previous findings showing that the consumption of soda was increased in young Korean adults aged 20–34 years and in individuals with higher education, in the last decade. 38 A rapidly growing body of evidence indicated that increased consumption of sugar-sweetened beverages was positively associated with the risks of obesity and MetS components. Particularly, the levels of blood glucose and insulin increased rapidly immediately after ingestion of sugar-sweetened beverages. 39 This is due to the presence of sucrose or high-fructose corn syrup, which are generally used to flavor sugar-sweetened beverages and show a high dietary glycemic load. Since these substances provide low levels of satiety, people tend to consume extra calories, and therefore resulting in weight gain and obesity. 40 Additionally, it has been reported that the high added sugar contents in sugar-sweetened beverages could directly lead to insulin resistance or glucose intolerance, which in turn increased the risk of elevated FBG and dyslipidemia. 41 Previous epidemiological studies found that sugar-sweetened beverages were a major component of a specific dietary pattern, which was associated with the increased risks of obesity and MetS. 42,43 One study involving Tehrani women aged 40–69 years reported that the Western dietary pattern with high consumption of red meat, processed meat, soft drinks, and low consumption of vegetables was inversely associated with MetS. 42 In another study involving a Korean population, 43 the Western pattern characterized by high consumption of fast foods, grilled meat, sea food, and caffeinated drinks was positively associated with the increased risk of MetS components.
We investigated the associations of the third beverage consumption pattern characterized by high consumption of unsweetened coffee and low consumption of sweetened coffee with the odds of MetS components. Previous studies regarding the relation between coffee consumption and MetS showed contradictory results. Several European studies 44,45 reported no significant association between coffee consumption and MetS, while studies conducted in Japan showed a significantly negative relationship between coffee consumption and MetS. 46,47 In contrast, a previous study involving Korean adults showed that instant coffee intake was positively related to the risk of MetS. 48 In addition, Song et al. 12 reported that coffee consumption was inversely related to the risk of MetS development when coffee was defined as black or brewed coffee, which is not in agreement with our results. The inconsistent results may be due to the difference in the characteristics of study samples as well as the different definition of coffee consumption. For example, some studies define coffee consumption limited to one type of coffee such as black/brewed or instant coffee, 12,49 whereas some other studies considered various types of coffee such as filtered-coffee or instant coffee. 48 Our results showed that the “unsweetened coffee” pattern had no association with the risk of obesity and MetS. Further longitudinal studies are required to reveal causal effects of types of coffee consumed on obesity and MetS development among the Korean population.
Our study offers several advantages. It is the first study to identify distinctive beverage consumption patterns that are associated with the risks for obesity and MetS controlling for a variety of potentially confounding factors among Korean adults. We also clearly demonstrated the relationships between beverage consumption patterns and the consumption of other food groups. In addition, we used nationally representative samples with a wide range of socio-demographic and health-related characteristics. Therefore, our study was able to identify the specific beverage consumption patterns reflecting the beverages commonly consumed by Koreans.
However, a few limitations of our study should be mentioned. First, the cross-sectional nature of data used in this study did not allow us to establish causality between the beverage consumption patterns and the risks of obesity and MetS. Second, although we successfully identified three beverage consumption patterns, the energy intake from beverages by Koreans (∼10% of total daily energy intake) 21 was only the half of that by Americans (∼22% of total daily energy intake). 50 Thus, it is possible that the effects of energy intake from beverages on the risks of obesity and MetS in Korean adults may be exaggerated. However, our findings indicated that the beverage consumption patterns identified by factor analysis explained ∼23% of the total variance, which was similar to previous dietary pattern studies. 51,52 Moreover, our findings are supported by previous studies involving various Korean populations, which reported similar results on the effect of a single beverage item on metabolic diseases. 10 –12,53 Considering the gradual increase in the consumption of beverages from Korean adults, additional research including a large number of Korean individuals regarding their beverage consumption patterns in relation to various diseases should be designed. Third, the interpretation of our results is limited by the arbitrary nature of factor analysis approaches. The factor analysis allows researchers to identify certain patterns based on a data-driven approach. The grouping of food items to conduct a factor analysis is arbitrary and the derived patterns also showed subjective characteristics. 27 Thus, different datasets may provide different beverage consumption patterns even though these datasets derive from the Korean population. However, our findings cannot be directly compared with the results from previous studies because this is the first study to identify the beverage consumption patterns of Koreans. Therefore, further studies are required to examine the reproducibility of beverage consumption patterns by using various datasets.
In conclusion, we identified three major beverage consumption patterns of Korean adults and we found that the “healthy beverage” pattern was inversely associated with, whereas the “sugar-sweetened beverage” pattern was positively associated with the risks of obesity and MetS components. Providing nutritional education with the aim to change behaviors related to beverage consumption and choice may help to reduce the risks of obesity and MetS among individuals adhering to these two beverage patterns. Further longitudinal and interventional studies are warranted to confirm the long-term effects and advantages of the “healthy beverage” pattern in relation to chronic diseases and provide scientific guidelines for achieving a healthy beverage consumption.
Footnotes
Acknowledgments
The article was prepared using KNHANES 2008–2012 data obtained from the KCDC. All authors appreciate the KCDC for the availability of the KNHANES survey data.
AUTHORS' CONTRIBUTIONS
K.W.L. formulated the study question and conceptualized the study, conducted the statistical analysis, and wrote the initial draft of the article. D.S. contributed to the study hypothesis and statistical analysis and was involved in article preparation and critical revision. All authors critically reviewed and approved the final article.
Author Disclosure Statement
The authors declare no conflicts of interests.
References
Supplementary Material
Please find the following supplemental material available below.
For Open Access articles published under a Creative Commons License, all supplemental material carries the same license as the article it is associated with.
For non-Open Access articles published, all supplemental material carries a non-exclusive license, and permission requests for re-use of supplemental material or any part of supplemental material shall be sent directly to the copyright owner as specified in the copyright notice associated with the article.