
Abstract
This study investigated the effects of Akebia quinata (AQ) leaf and fruit extract on acute alcohol-induced hepatotoxicity in AML12 cells. Different concentrations of AQ extracts (250 and 2500 μg/mL) were used to treat the AML12 cells with or without ethanol for 24 h for inducing acute alcohol cytotoxicity. AQ extract-treated AML12 cells showed enhanced expression of GSH-synthesizing enzymes and suppressed expression of oxidative stress makers such as NOX4, and decreased expression of tumor necrosis factor-α, inflammatory marker, in acute alcohol-induced hepatotoxicity. Furthermore, it was observed that 100 mM ethanol treatment of AML12 cells resulted in global change of mRNA expression in microarray, but AQ leaf extract treatment reversed the global change of mRNA expression pattern into normal condition. In conclusion, AQ extract or functional component from AQ can be useful therapeutic agent in acute alcohol-induced hepatotoxicity by reducing oxidative stress and inflammation responses.
Introduction
A
Cells are protected against oxidation by the action of certain enzymes, vitamins, and other substances, known collectively as antioxidants. 7,8 Glutathione (GSH) plays an important role in the detoxification of ethanol (EtOH) and acute EtOH administration leads to GSH depletion in the liver and other tissues. When the balance between the reactive oxygen species (ROS) production and antioxidant defense system is lost, “oxidative stress” results, which through a series of events deregulates the cellular functions leading to various pathological conditions. 9 Furthermore, abnormal cytokine metabolism is a major feature of alcoholic liver disease (ALD). In recent years, a significant role for proinflammatory cytokines such as tumor necrosis factor-alpha (TNF-α), in the onset of liver disease, has been indicated both by clinical observations of an enhanced level of cytokines in patients with ALD and results of studies with animal models of alcohol-induced liver injury. 10 –12 Inflammatory disorders, such as hepatitis, which are caused not only by infectious agents such as viruses and bacteria but also by physical and chemical agents like alcohol, heat, acid, cigarette smoke, and foreign bodies, are recognized risk factors for human cancers at various sites. 13
Akebia quinata (Thunb.) Decne. (Lardizabalaceae), commonly referred to as chocolate vine, grows naturally in Japan, China, and Korea. 14 The dry ripe fruit and stems of Akebia quinata (AQ) are used as an analgesic, an antiphlogistic, and a diuretic in traditional East Asia medicine. 15,16 According to previous studies, dried fruit and stem of AQ contained glycoside of oleanolic acid, hederagenin, triterpene glycosides, norajunolic acid, and saponi. 15,17 Extracted saponin and oleanane disaccharides from AQ were associated with an anti-inflammatory activity. 18 In our previous study, we found protective effects of AQ fruit extract on acute alcohol-induced liver damage in an in vivo model. 19 This study focused on effects of AQ leaf and fruit extract on hepatotoxicity and inflammation induced by alcoholic oxidative stress in AML12 cells, a mouse normal hepatocyte cell line, and we investigated the effect of AQ extract on global gene expression.
Materials and Methods
Preparation of water extracts of A. quinata
Fruit and leaf of AQ were collected from April to September 2013, around the Mt. Jiri in Jeollanam-do, South Korea. They were dried with hot air (80°C) and powdered. One kg of dried fruits and leaves of AQ were extracted with 4 L of water in a shaking incubator (SI-600; Lab Companion, Daejeon, Korea) at 25°C for 24 h. Then, the extracts were filtered and concentrated using a rotary vacuum evaporator (R-114; Buchi Labortechnik, Flawil, Switzerland) under reduced pressure. Concentrated extracts were frozen at −70°C (DF8715; Ilshin Co., Seoul, Korea) for 1 h and then lyophilized using a freeze-dryer (FDS8508; Ilshin Co.). Water fraction of fruits and leaf extracts yielded 5.4% and 13.95% (w/w), respectively.
Cell culture
The AML12, normal mouse hepatocyte cell line, was obtained from American Type Culture Collection (ATCC, Manassas, VA, USA). Cells were cultured in recommended DMEM/F12 media (Corning, NY, USA) in a humidified incubator at 37°C and CO2 at 5%. Cells with passage number under 18 were used for the experiments.
Treatments
AML12 cells were seeded at a density of 0.3 × 10⁶ cells/well in a six-well dish (30 mm). After 4 h of seeding, the extracts of AQ fruit and leaf, and ethanol were treated according to Table 1 for 24 h.
Cell proliferation and viability test
Cell proliferation was tested by the tetrazolium salt 3-(4,5-dimethylthiazol-2-yl)-2,5-diphenyltetrazolium bromide (MTT) assay. Cells were seeded at a density 0.5 × 10⁵ cells/well in a 96-well cell culture plate. The cells were treated with extracts of AQ fruit and leaf in each nonethanol and ethanol group for 24 h. Then, 20 μL of MTT solution (5 mg/mL) was added to each well. The culture plates were incubated for 4 h. After removing media, 200 μL of dimethyl sulfoxide (DMSO) was added to dissolve MTT formazan. Absorbance was measured with a microplate spectrophotometer at 570 nm. The viability of cells was determined by trypan blue staining solution (Sigma-Aldrich Co., St. Louis, MO, USA). The cultured cells were collected with trypsin-ethylenediaminetetraacetic acid (EDTA) solution (Sigma-Aldrich Co.) and centrifuged. The collected cells were resuspended in fresh culture media with same volume of trypan blue solution. The stained (unviable) cell and unstained (viable) cells were counted on a hemocytometer slide. The viable cells (%) were calculated as the ratio of total number of viable cells to total number of unviable cells.
GSH concentration
Total glutathione concentrations were measured as previously described. 20,21 Cells were harvested in a sodium phosphate buffer (10 mM, pH 6). An aliquot from the collected supernatant was used to measure protein concentration by Bradford's method 22 and the other part of supernatant was used to determine the glutathione level. For the standard curve, glutathione standard solution (G4251; Sigma-Aldrich Co.) was mixed with a reaction solution (0.15 mM NADPH [N6505; Sigma-Aldrich Co.], 0.1 mM 5,5′-dithio-bis-(2-nitrobenzoic acid) [D8130; Sigma-Aldrich Co.], 50 mM NaPO4 [7558-797-4; Junsei Chemical Co. Ltd., Tokyo, Japan], and 1.5 mM EDTA [E5124; Sigma-Aldrich Co.]) and GSH reductase (10 U/mL) simultaneously. The differences in absorbance of the mixture between 0 min and 1 min were measured at 412 nm. Finally, the sample's glutathione concentration was determined by the calculated standard GSH calibration curve and expressed as μmole per protein concentration (mg).
RNA preparation and quantitative real-time polymerase chain reaction
Total RNA was extracted with Trizol reagent (Life Technologies, Inc., Grand Island, NY, USA) following the manufacturer's instruction. RNA concentration was determined spectrophotometrically before use. The mRNA levels were determined by quantitative real-time polymerase chain reaction (PCR). Total RNA was subjected to reverse transcription (RT) by using the cDNA synthesis kit (K1621; Thermo Fisher Scientific, Waltham, MA, USA). PCR analyses were performed on PCR (Piko real 96; Thermo Fisher Scientific) and reactions were carried out in Maxima SYBR Green qPCR Master Mixes (K0222; Thermo Fisher Scientific) with primers (Table 2). After PCR, the relative gene expression of these genes was determined by Livak's method. 23
Western blot analysis
Western blot analysis was conducted as described previously. 24 Proteins were separated in 12.5% SDS-polyacrylamide gels and electrophoretically transferred to nitrocellulose membranes. Transferred proteins were blocked with Tris-buffered saline (pH 7.6)/0.1% Tween 20 containing 5% nonfat dried milk, washed with Tris-buffered saline/0.1% Tween 20, and incubated 1.5 h with primary antibodies in Tris-buffered saline/0.1% Tween 20 containing 5% nonfat dried milk. Membranes were probed with antibodies against GSS (Abcam, Cambridge, MA, USA). A horseradish peroxidase-conjugated secondary antibody was used. Blots were developed by enhanced chemiluminescence.
Microarray analysis
Total RNA was amplified and purified using the Ambion Illumina RNA amplification kit (Ambion, Austin, USA) to yield biotinylated cRNA according to the manufacturer's instructions. Briefly, 550 ng of total RNA was reverse transcribed to cDNA using a T7 oligo (dT) primer. Second-strand cDNA was synthesized, in vitro transcribed, and labeled with biotin-NTP. After purification, the cRNA was quantified using the ND-1000 Spectrophotometer (NanoDrop Technologies, Wilmington, DE, USA). 750 ng of labeled cRNA samples was hybridized to each Mouse Ref8 expression v.2 bead array for 16–18 h at 58°C, according to the manufacturer's instructions (Illumina, Inc., San Diego, CA, USA). Detection of array signal was carried out using Amersham fluorolink streptavidin-Cy3 (GE Healthcare Bio-Sciences, Little Chalfont, United Kingdom) following the bead array manual. Arrays were scanned with an Illumina bead array Reader confocal scanner according to the manufacturer's instructions.
Statistical analysis
All experimental data were performed in triplicate and results are expressed as mean standard error of the mean (SEM). Treatment effects were analyzed using one-way analysis of variance (ANOVA), followed by Duncan's multiple range test with SAS software (ver. 9.3). P-values <.05 were conducted statistically significant.
Results
Cell proliferation and viability
MTT assay was performed to investigate cell proliferation in AQ extracts and EtOH-treated AML12 cells. The treatment of AQ leaf extract reduced proliferation dose dependently in non-EtOH-treated groups (Fig. 1A). The EtOH-treated groups showed a similar proliferation tendency to that of non-EtOH-treated groups. However, the treatment with AQ fruit extract reduced proliferation significantly in only the 2500 μg/mL treatment group in both EtOH- and non-EtOH-treated groups (Fig. 1B). The AQ fruit extract had no effect on cell viability in either non-EtOH groups or EtOH groups (Fig. 1D). However, the cell viability of 2500 μg/mL treatment group was reduced in both non-EtOH groups and EtOH groups (Fig. 1C).
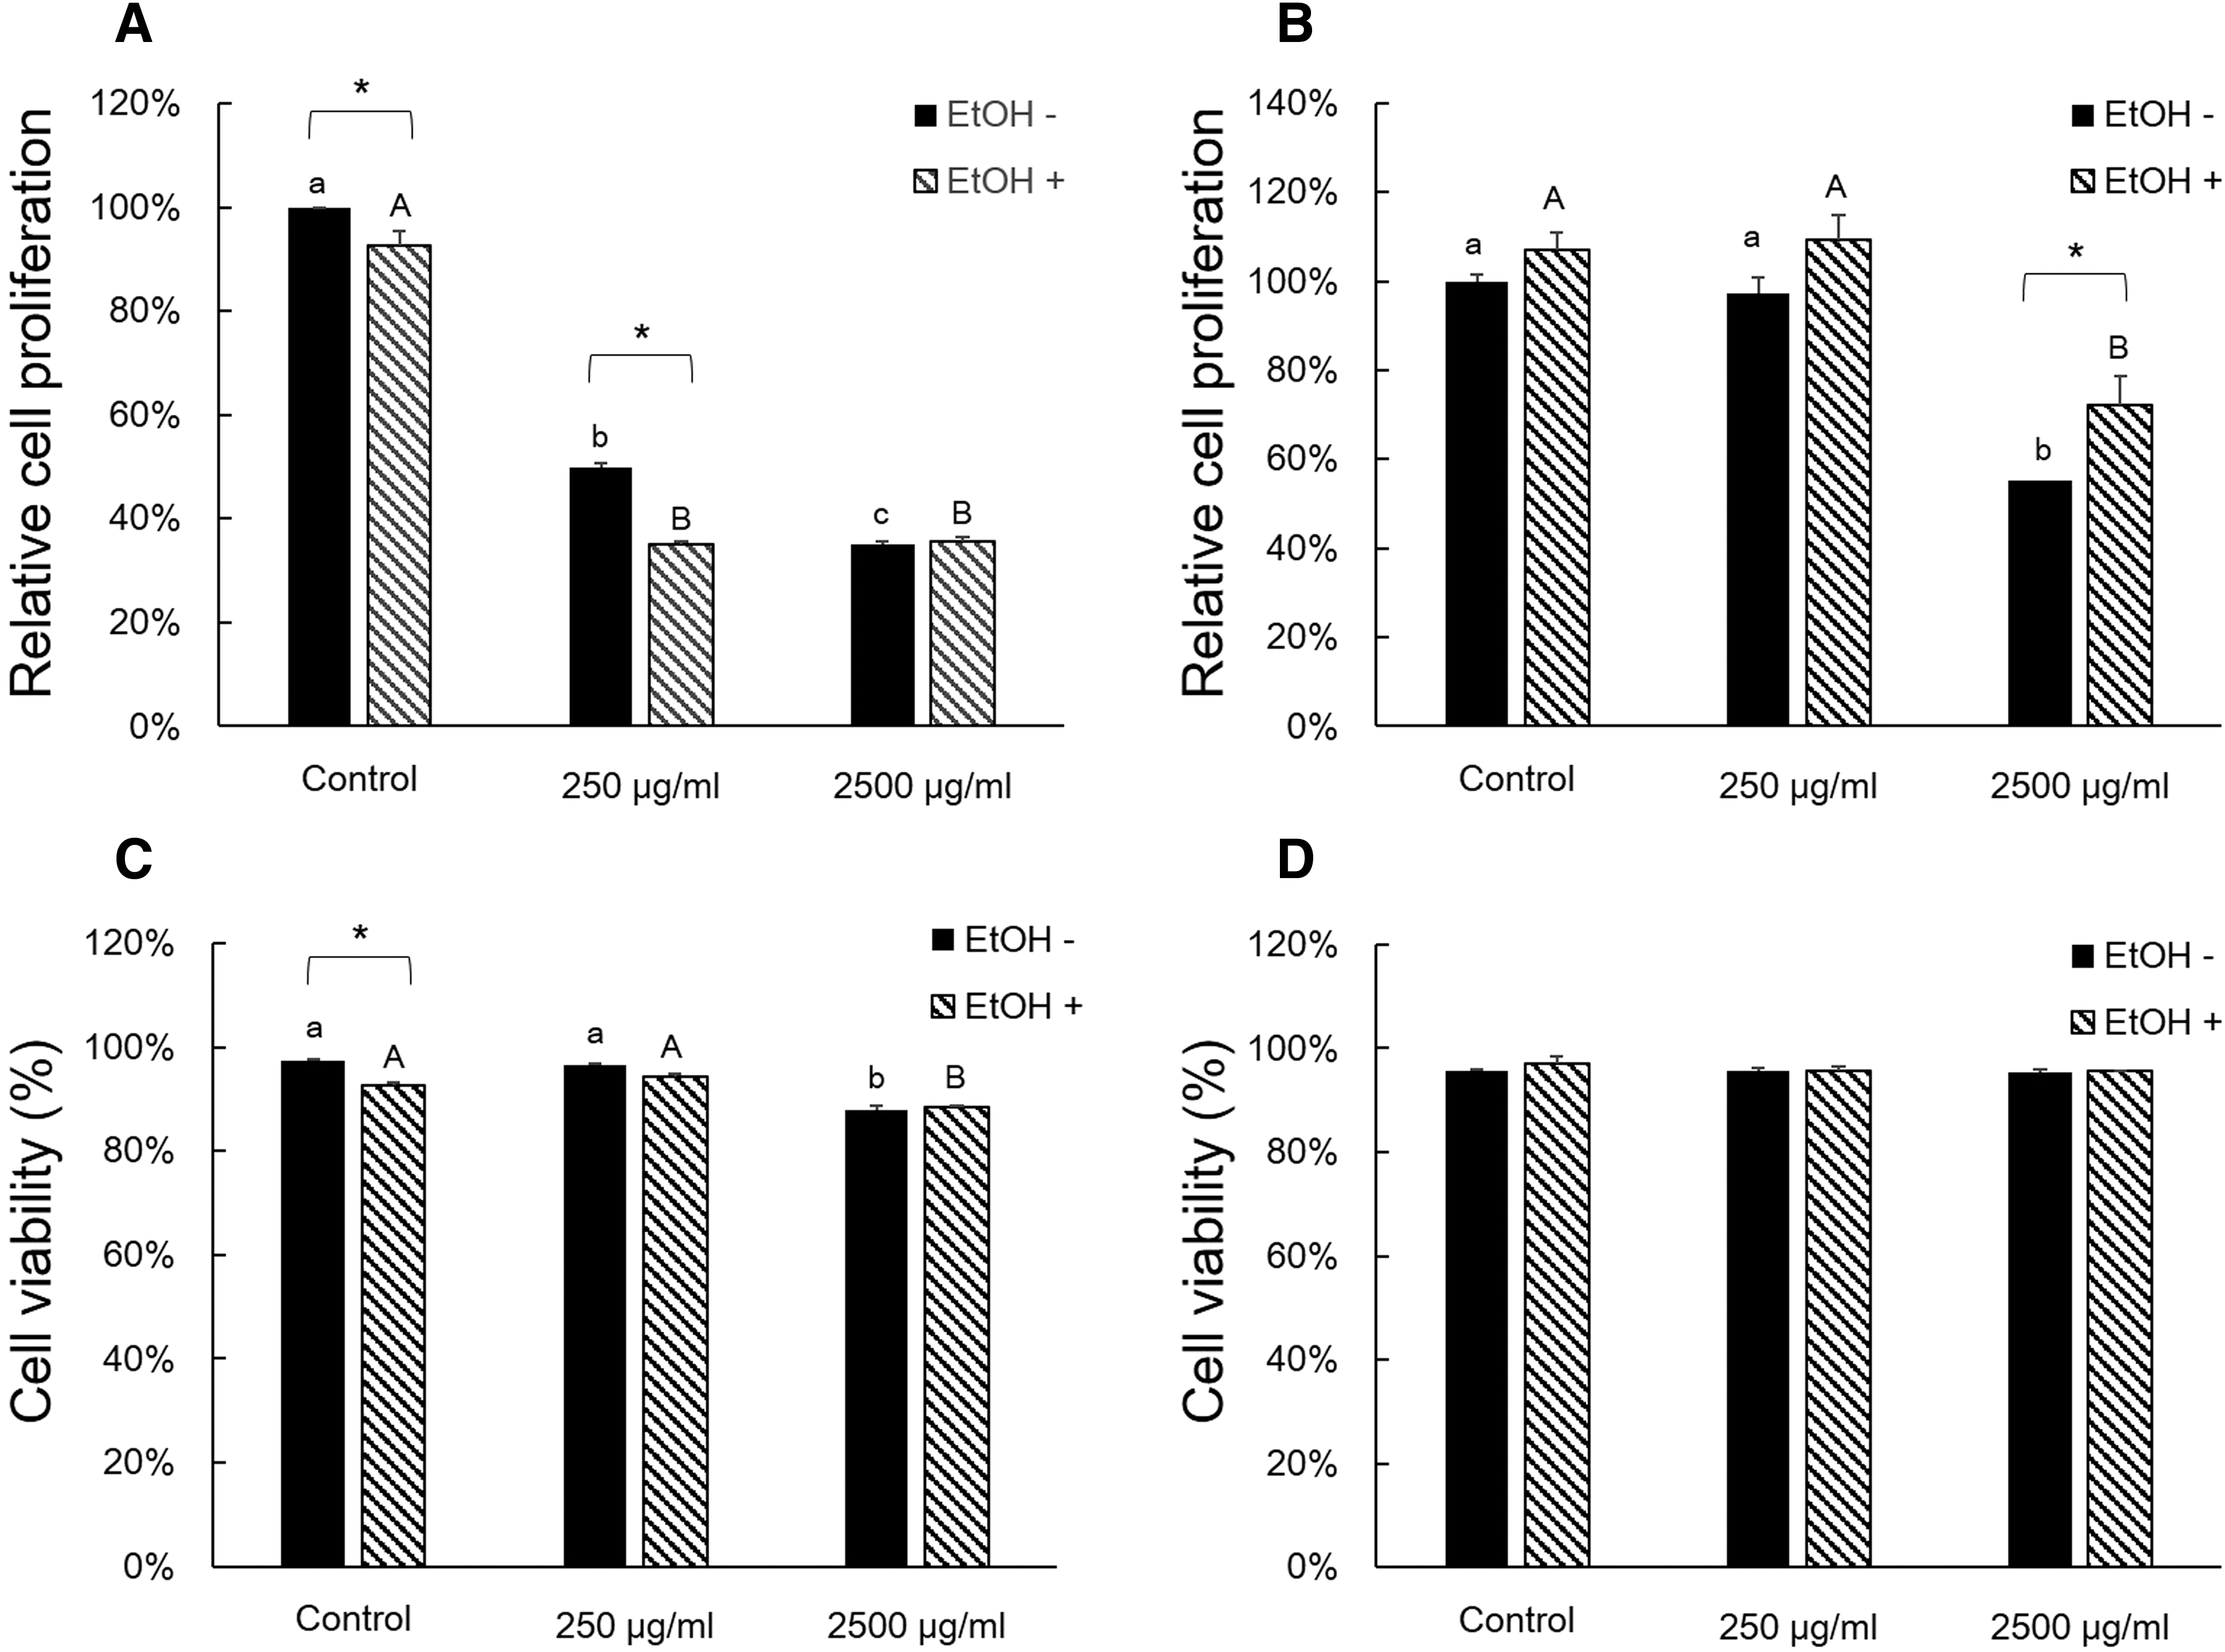
Effects of AQ leaf and fruit extract, and EtOH on cell proliferation and viability of AML12 cells. For cell proliferation and viability assay, tetrazolium salt, 3-(4,5-dimethylthiazol-2-yl)-2,5-diphenyltetrazolium bromide assay, and trypan blue staining assay were tested, respectively.
NOX4 and TNF-α mRNA expression
Figure 2A shows mRNA expression of nicotinamide adenine dinucleotide phosphate-oxidase 4 (NOX4) in AQ leaf extract-treated groups. In the 2500 μg/mL treatment group, the mRNA expression of NOX4 was significantly lower compared with the control and 250 μg/mL treatment group with EtOH treatment. The mRNA expression of NOX4 had no difference within non-EtOH and EtOH groups. The treatment of AQ fruit extract tended to a show similar pattern to treatment of AQ leaf extract (Fig. 2B).We also tested the effect of AQ extract treatment on mRNA expression of TNF-α in EtOH-treated AML12 cells. EtOH treatment increased mRNA expression of TNF-α compared to control (Fig. 2C). In the 2500 μg/mL group, AQ leaf treatment showed the lowest levels of mRNA expression of TNF-α in the EtOH-treated groups and did not differ from non-EtOH 2500 μg/mL group. Figure 2D shows the relative mRNA expression of TNF-α in AQ fruit extract-treated groups. The pattern of TNF-α mRNA expression tended similar for the AQ leaf extract treatment groups.
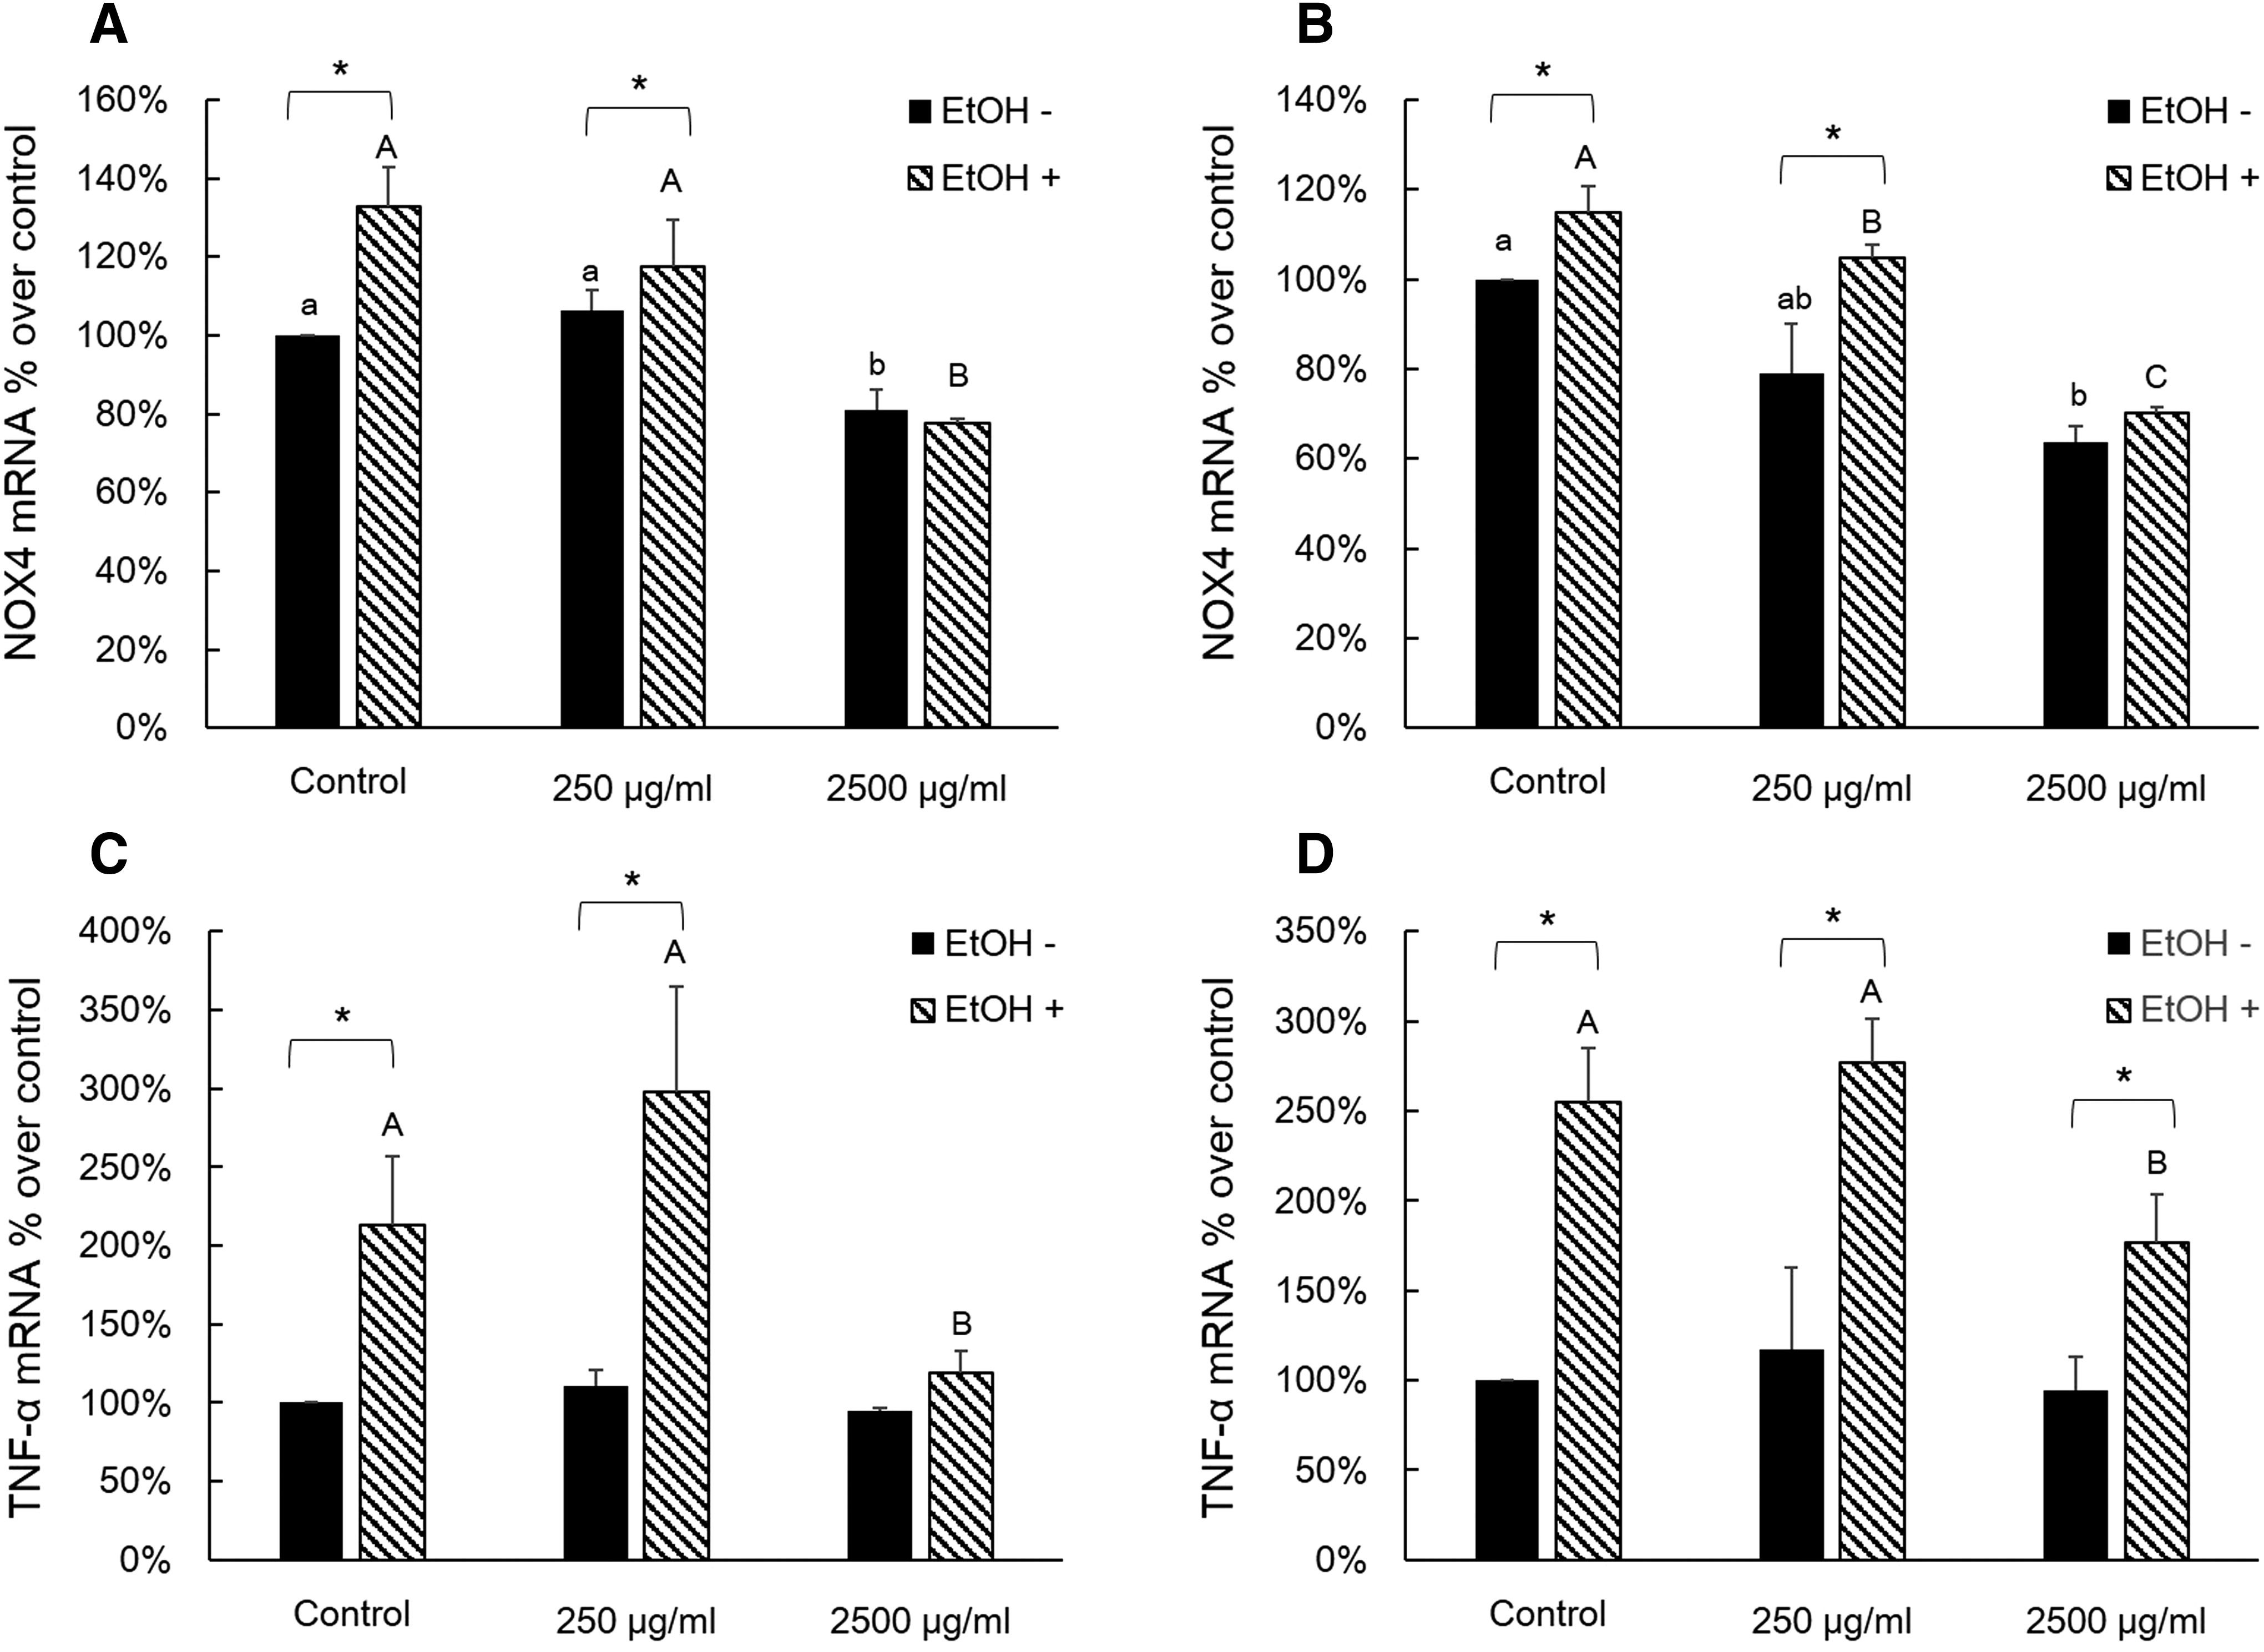
Effects of AQ leaf and fruit extract, and EtOH on NOX4 and TNF-α in AML12 cells.
The glutathione synthesizing enzymes expression and cellular glutathione level
We investigated the effects of AQ extract treatments on mRNA expressions of GSH-synthesizing enzymes and cellular GSH levels with or without EtOH treatment in AML12 cells (Figs. 3 and 4). In the non-EtOH treatment group, treatment with AQ leaf extract had a significantly higher mRNA expression level of GCLM, GCLC, and GSS than those of control especially in 2500 μg/mL of AQ treatment. However, there was no significant difference in the GSH level (Fig. 3). The AQ fruit extract treatment showed comparable effects on mRNA expression of GSH-synthesizing enzyme compared to those of AQ leaf extract treatment (Fig. 4). In both non-EtOH and EtOH treatment, the cellular GSH level was increased compared to that of control. Interestingly, EtOH treatment exhibited higher GSH level within same dose of AQ fruit extract treatment. In our study, higher intracellular GSH levels with EtOH treatment were associated with an increased mRNA expression of GCLM (Fig. 4A), GCLC (Fig. 3B), GSS (Fig. 3C), and protein level of GSS (Fig. 5A) in AQ leaf or fruit extract treatment.
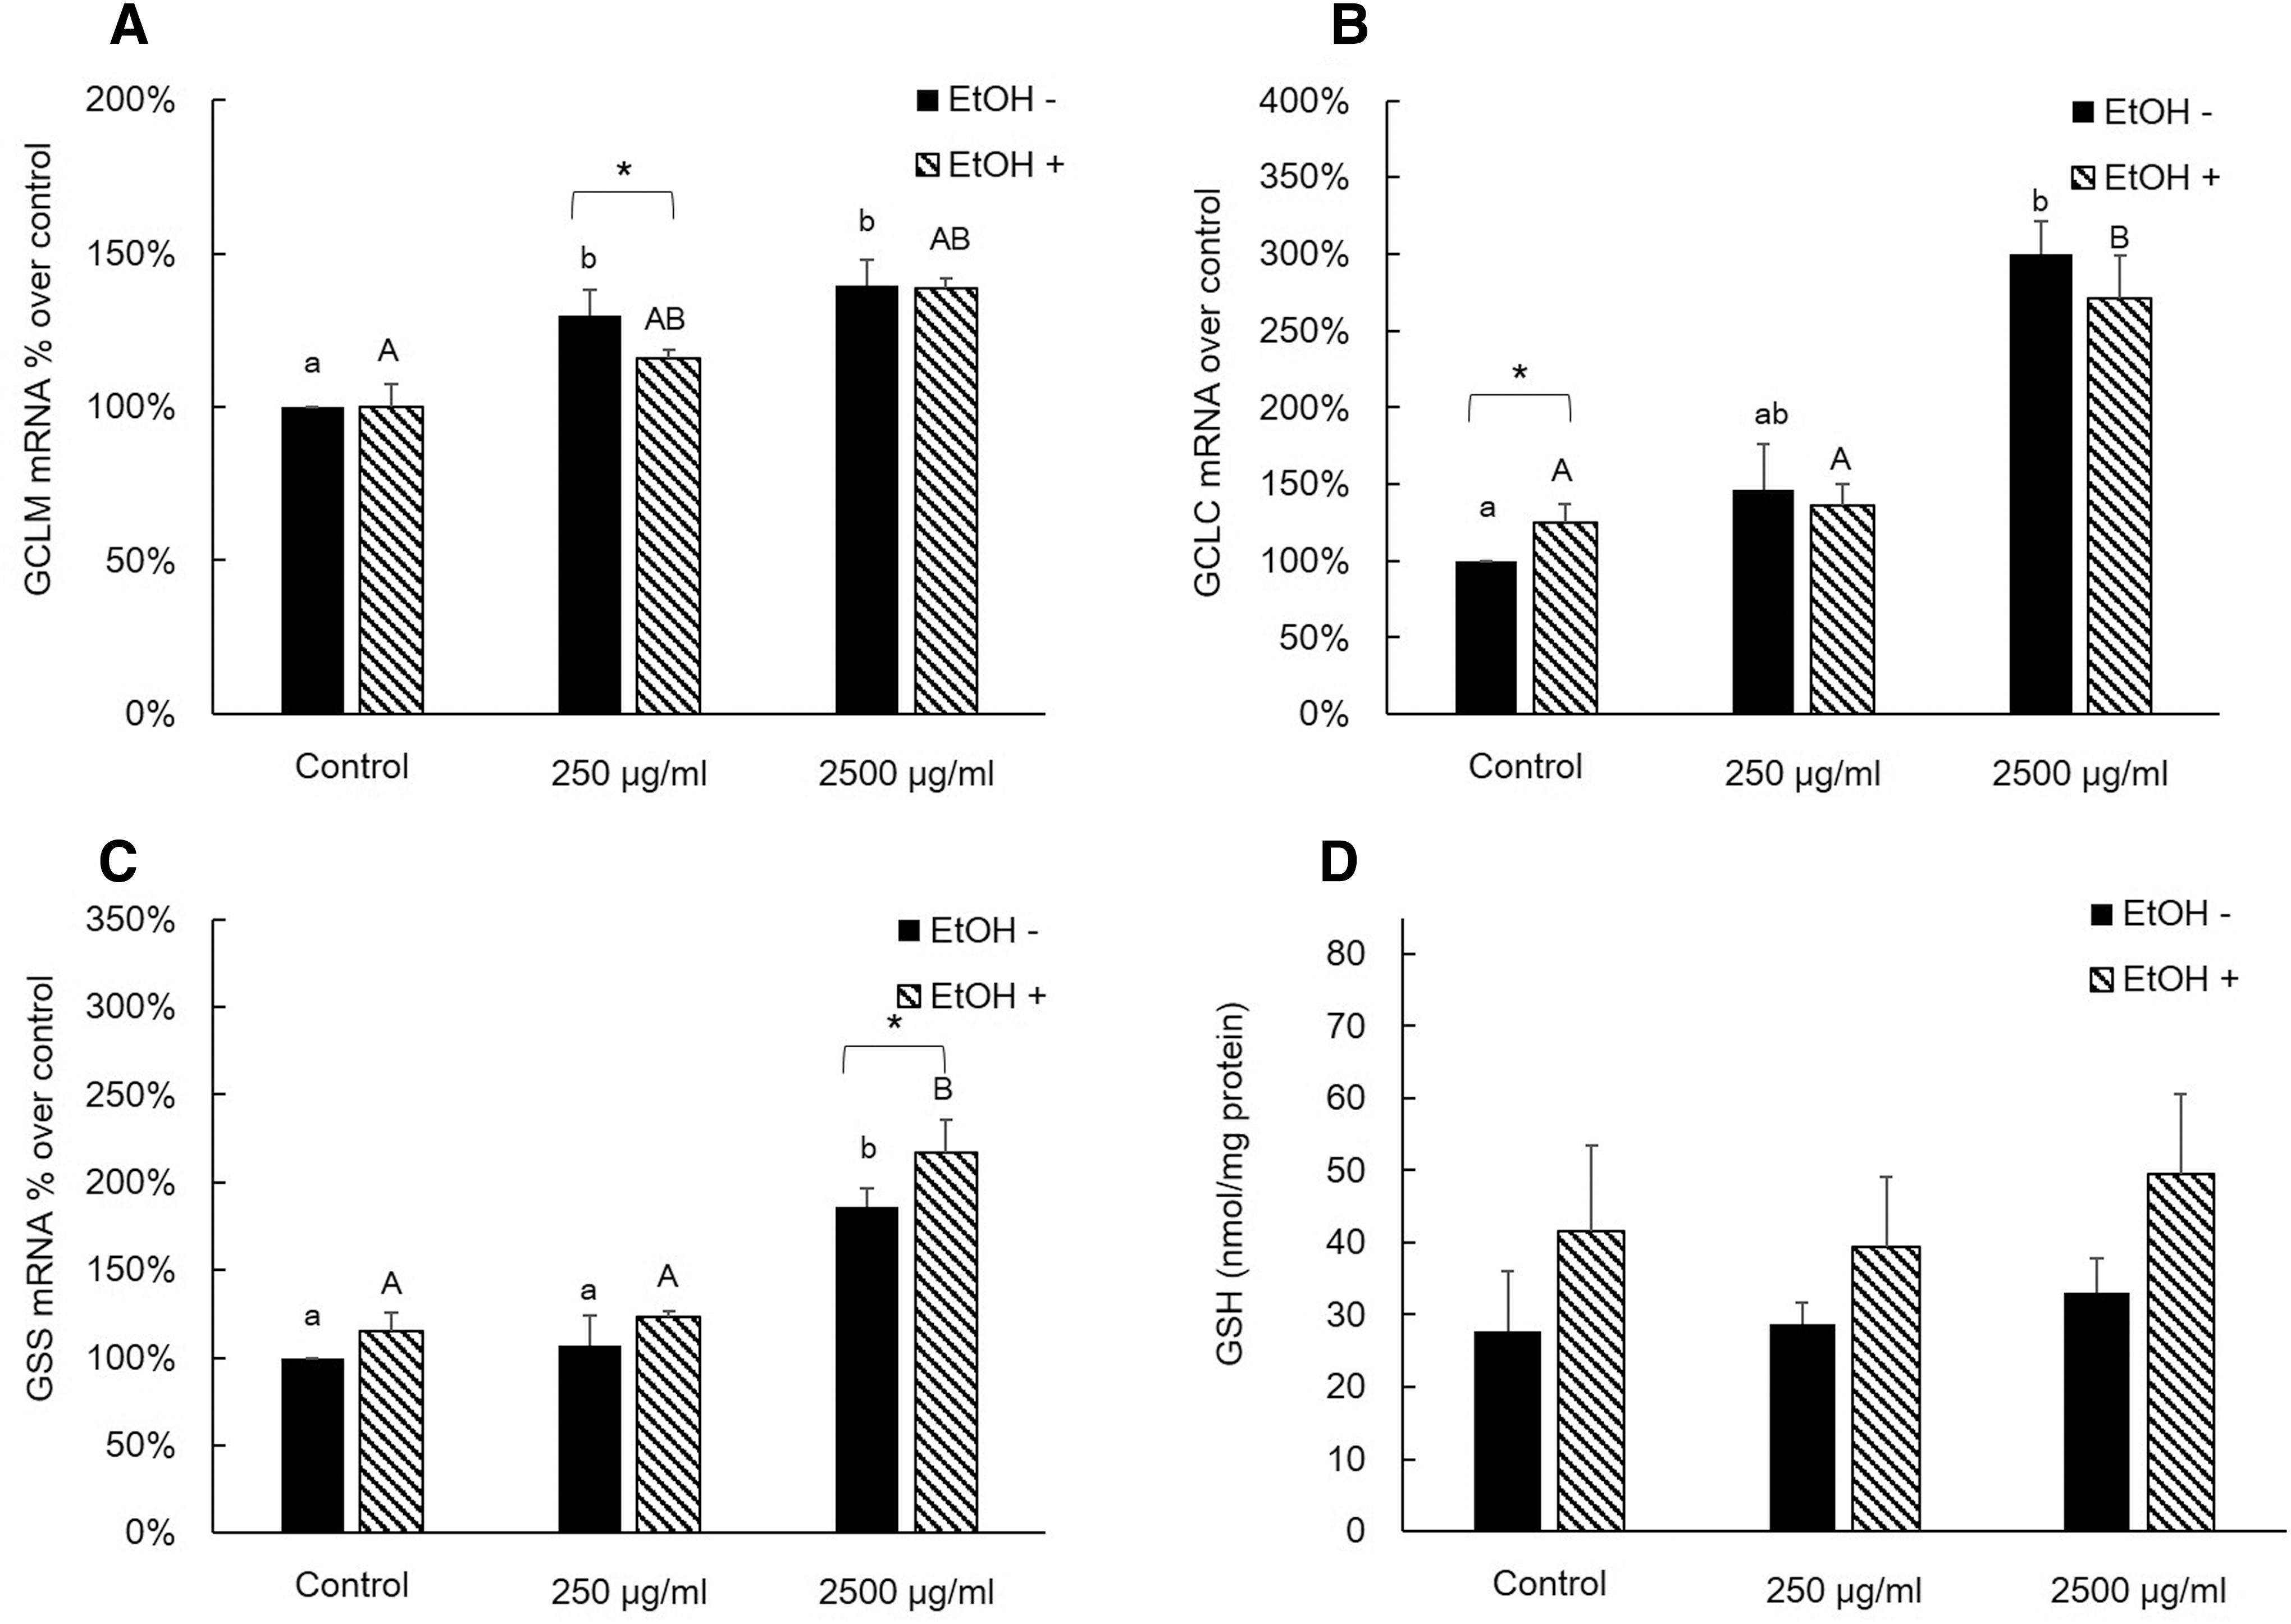
Effects of AQ leaf extract and EtOH on relative mRNA expression level of GSH-synthesizing enzymes and GSH concentration in AML12 cells.
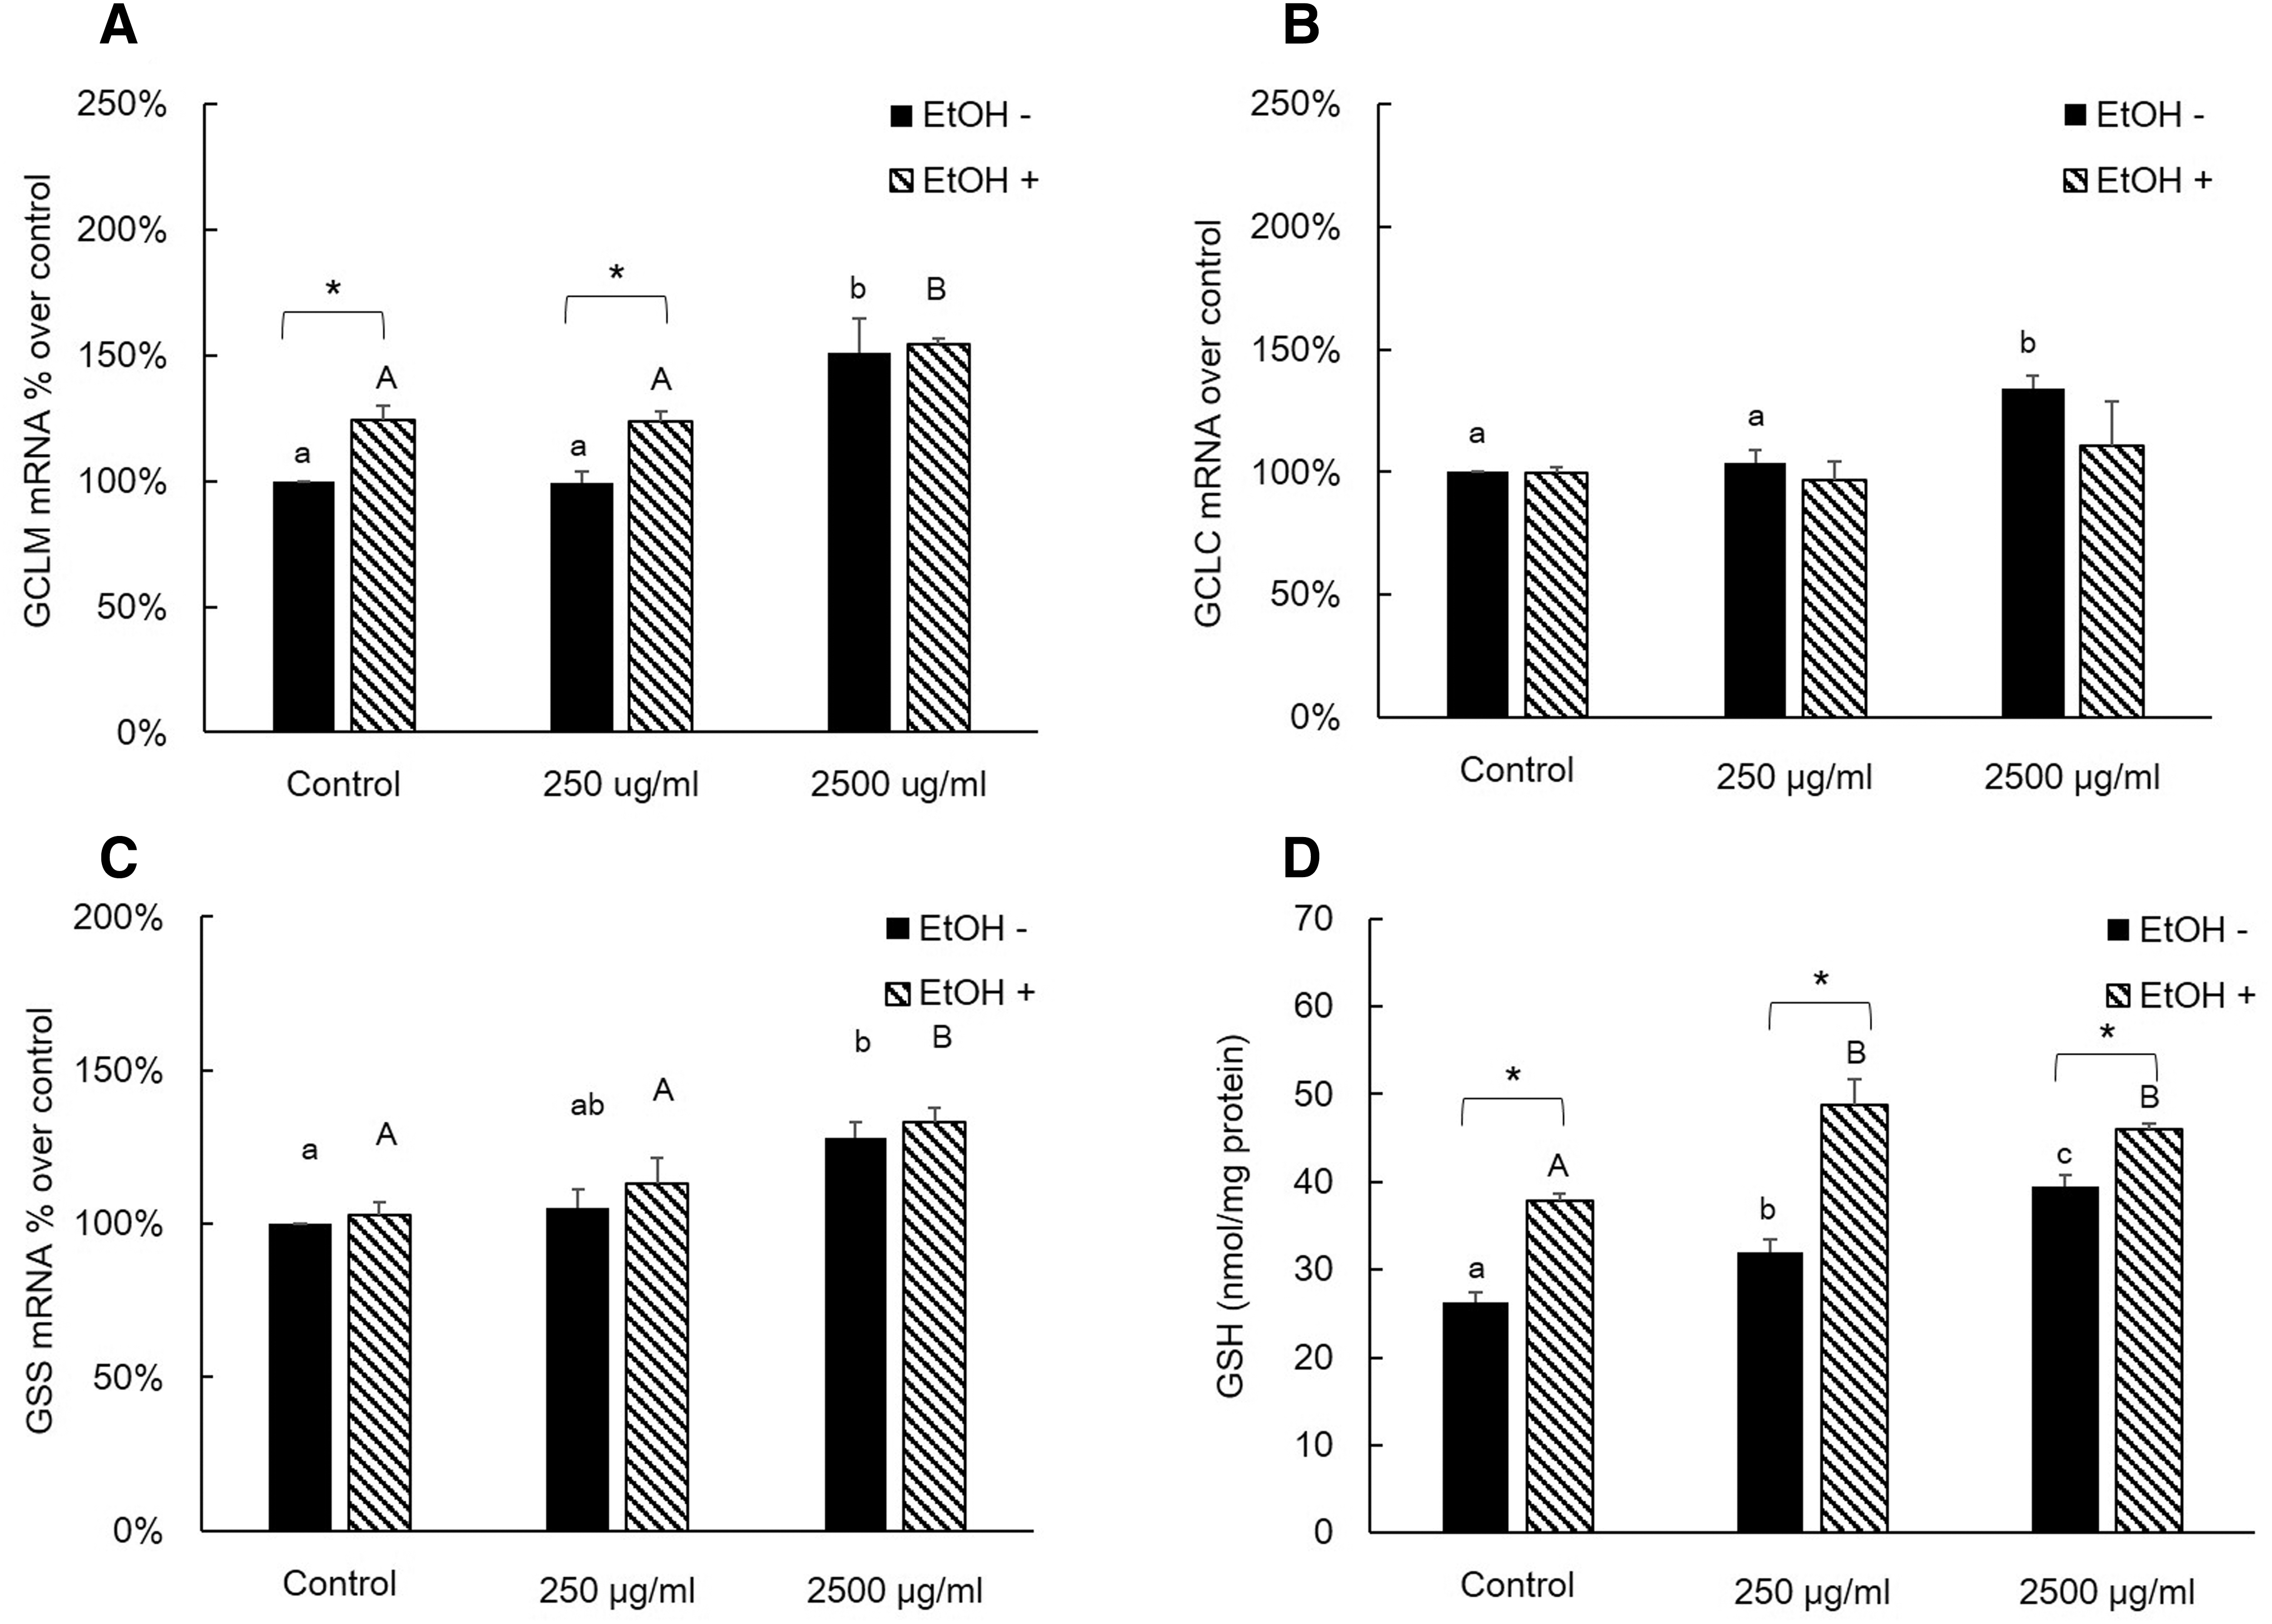
Effects of AQ fruit extract and EtOH on relative mRNA expression level of GSH-synthesizing enzymes and GSH concentration in AML12 cells.
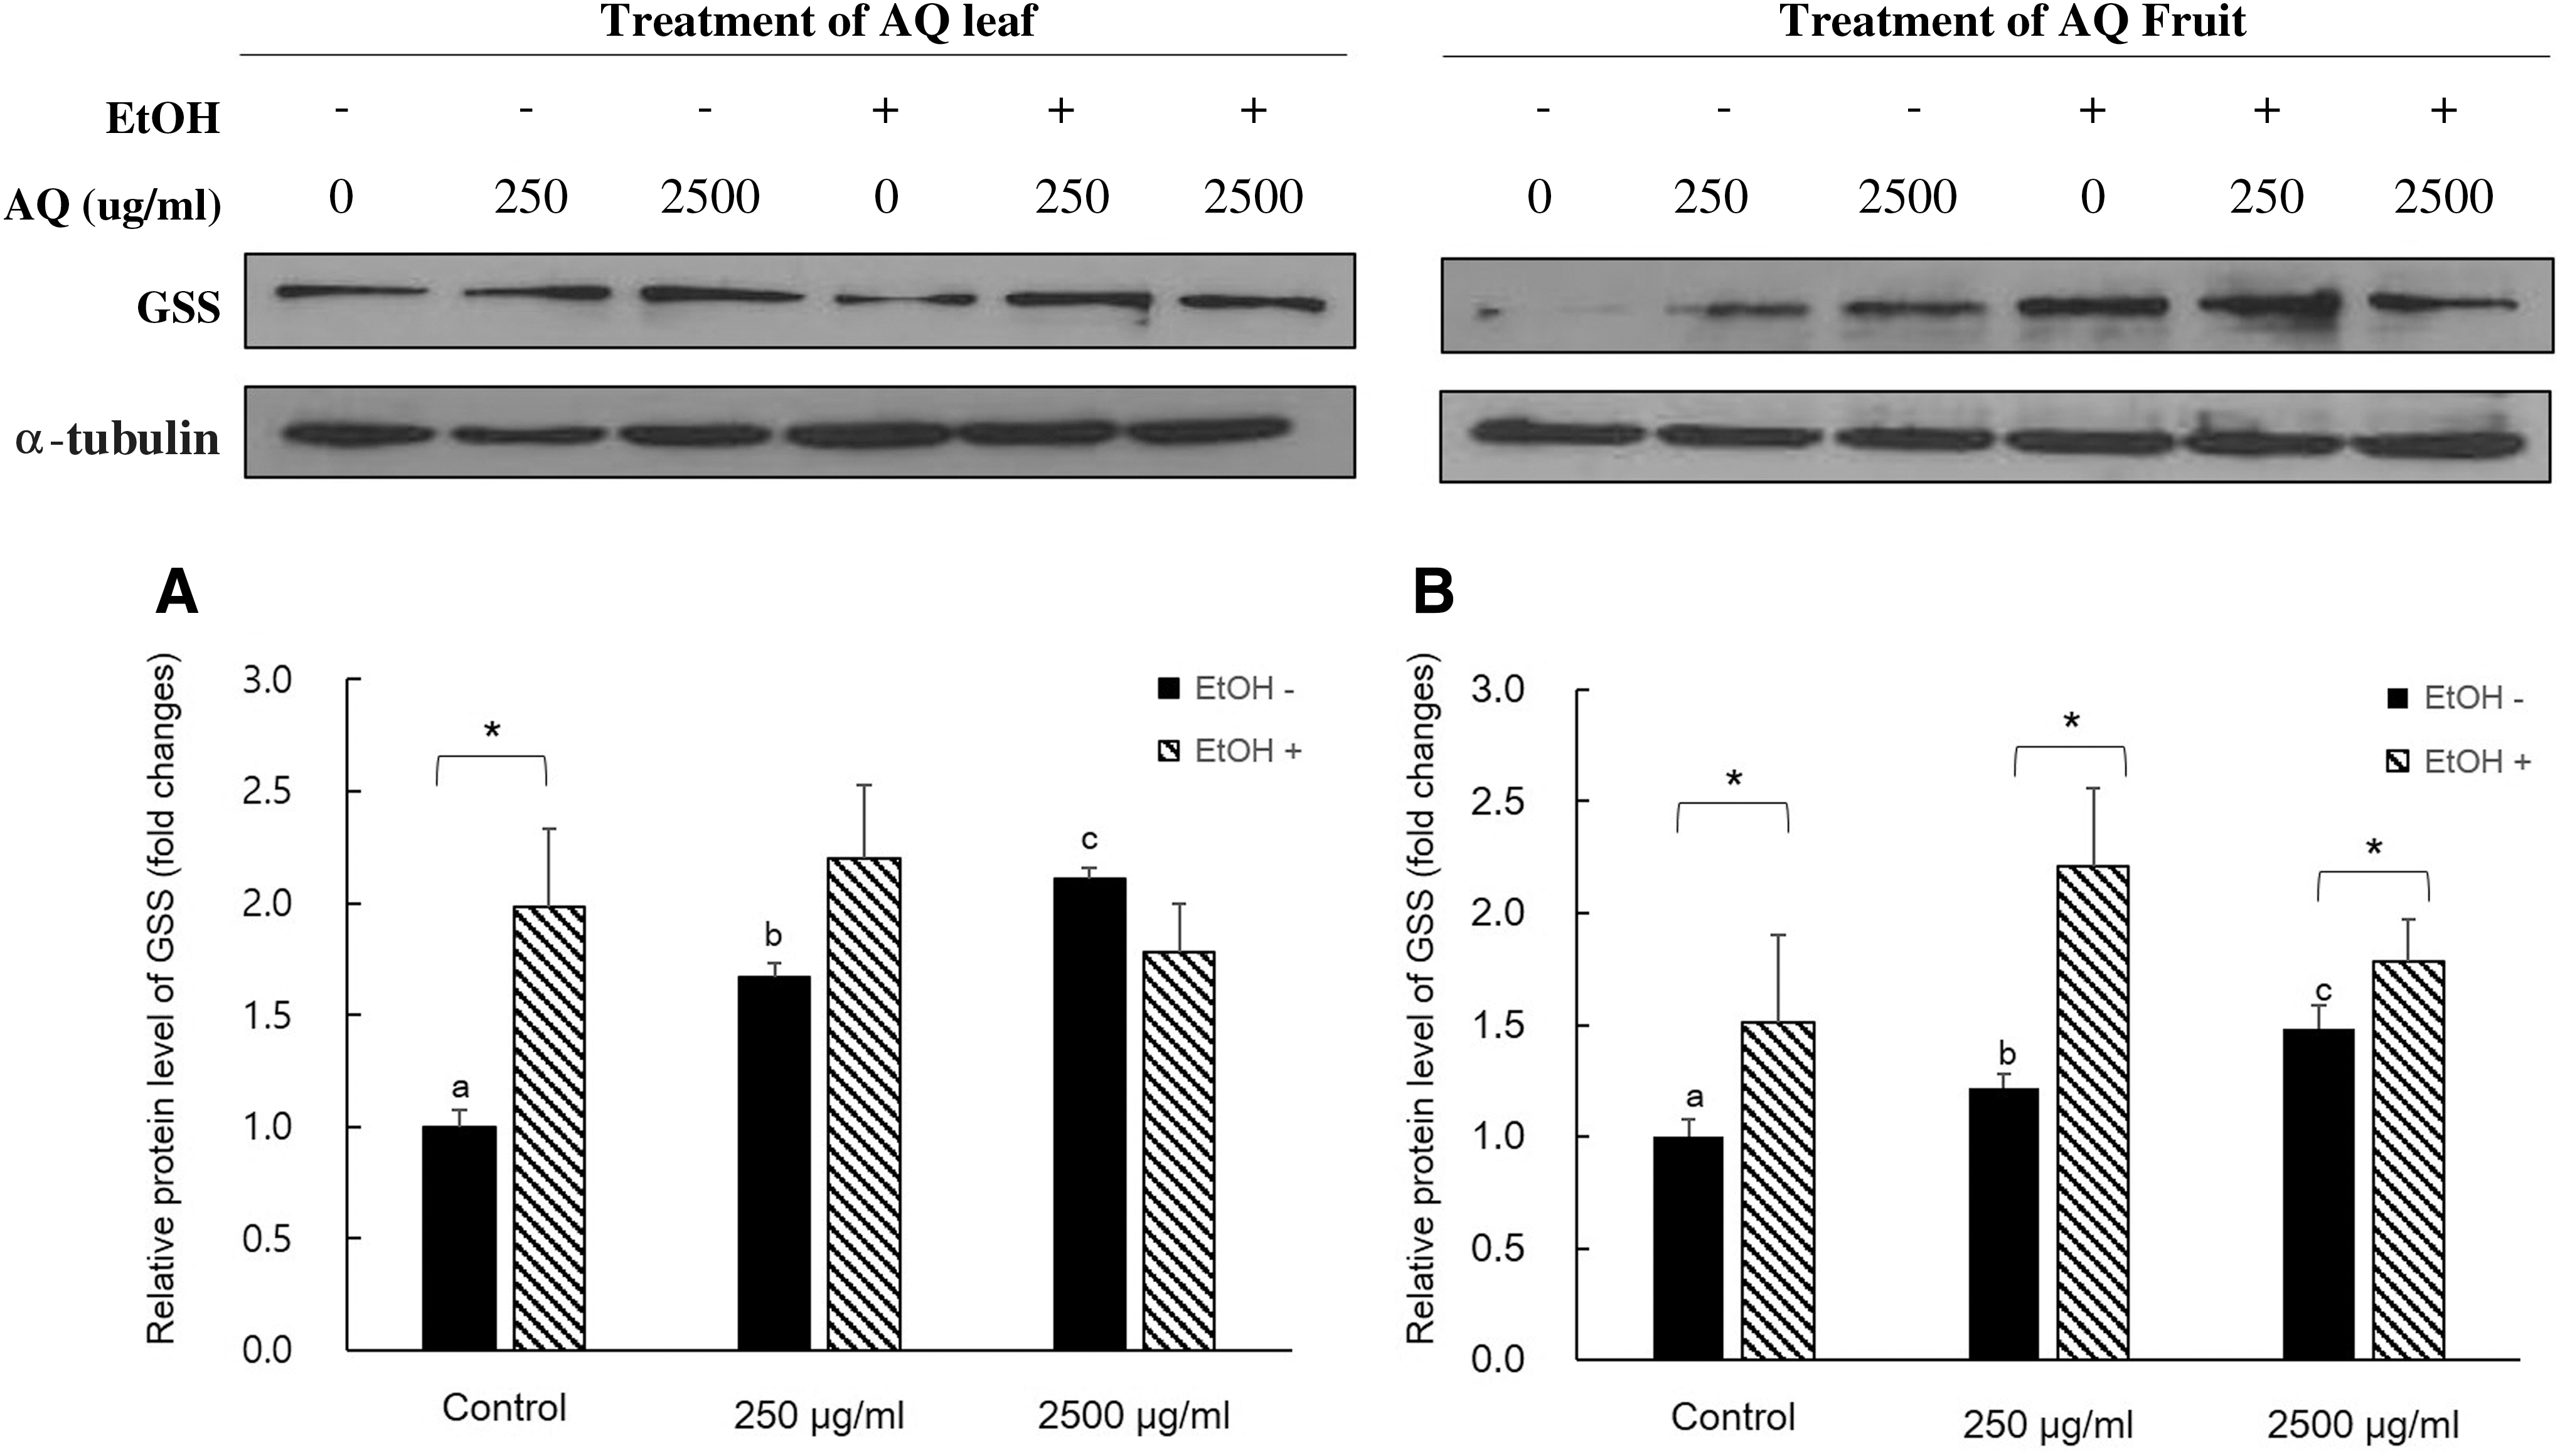
Western blot analysis for GSS expression level of AQ leaf and fruit treatment.
Microarray analysis
The effect of AQ leaf extract and EtOH treatment, and the combination of them on gene expression changes were compared by functional clustering analysis (Fig. 6). The result of control was quite homogeneous when only 2500 μg/mL of AQ leaf extract treatment was compared. Only the EtOH treatment group showed obvious changes in global gene expression changes compared with the control. However, the changes induced by EtOH treatment were largely reversed by AQ leaf extract treatment with EtOH challenge. Table 3 presents the results of ontological clustering of DAVID data mining. Many of the gene ontology (GO) clusters were significantly identified. Eighty-one genes and 77 genes were counted that were significant for the regulation of apoptosis (GO:0042981) and apoptosis (GO:0006915), respectively. We also found that the AQ leaf extract treatment affected cellular oxidative stress, cell redox homeostasis, and response to hydrogen peroxide in terms of GO clustering. Inflammatory response (GO:0006954), regulation of inflammatory response (GO:0050727), and mononuclear cell proliferation (GO:0032943) classified by DAVID clustering exhibited no statistically significant differences.

Heat map comparing the changes in gene expression of functional clusters in AQ leaf extract treatment, EtOH treatment, and the combination of AQ leaf extract and EtOH in AML12 cells. A heat map is a graphical representation of data that the values are represented in green & red colors. EtOH, treatment of 100 mM ethanol; 2500 μg/mL*, 2500 μg/mL of AQ leaf extract treatment. Color images available online at
Genes were counted in 2500 μg/mL of Akebia quinata leaf extract-treated group with 100 mM ethanol.
Discussion
In this study, 100 mM EtOH was used to challenge cells as an acute alcohol exposure model. According to previous studies, this dose of EtOH can induce alcoholic stresses in several cell lines. 25,26 While several mechanisms related to the pathogenesis of alcohol-mediated liver damage have been studied in detail, some other potential mechanisms, for example, apoptosis and cell proliferation, were not well known in ALD. Although several studies have reported that apoptosis occurs in both clinical and experimental ALD, the mechanisms are not entirely clear. 27,28 For instance, it has been suggested that oxidative stress may be the possible mechanisms underlying ethanol-induced apoptosis. For these reasons, to see if EtOH and AQ extract treatment can affect cell viability or apoptosis, the test of viable cell was conducted by trypan blue staining. Previous study reported that AQ fruit extract treatment had shown less toxicity in an in vivo model. 19,29 The results of this study were in agreement with those previous investigations. On the other hand, there was a significant difference between control and negative control (only EtOH-treated group). However, all groups showed about 90% of cell viability with AQ leaf and EtOH treatment. As a result, treatment of AQ leaf and fruit exhibited reduced cytoproliferation with minimum changes of cell viability in the AML12 cell line.
Nicotinamide adenine dinucleotide phosphate-oxidase (NOX) is a membrane-bound enzyme complex that transports electrons across biological membranes to reduce oxygen to superoxide. 30 Isoforms are well identified such as NOX1, NOX2, NOX3, and NOX4. Some studies showed that NOX-derived ROS are related to alcoholic liver injury, 31 inducing active signaling cascades leading toward hepatic fibrosis, and have a direct toxicity. 32 In particular, NOX4 is closely associated with hepatic fibrosis. 33,34 In this study, NOX4 was used as an oxidative stress marker to investigate effects of AQ extracts on acute alcohol-induced hepatotoxicity. In Figure 2A and B, 2500 μg/mL of AQ fruit and leaf extract group treated with EtOH exhibited a reduced mRNA NOX4 expression compared to EtOH-only treated group. These results suggest that AQ leaf or fruit extract treatment could reduce oxidative stress against acute alcohol-induced ROS by attenuating expressions of one of the oxidative stress markers, NOX4.
TNF had been reported to be upregulated in several alcohol-mediated models of liver injury. 10,35 Previous study showed that rats chronically exposed to alcohol with normal liquid feed were more susceptible to lipopolysaccharide (LPS)-induced liver injury than isocalorically fed normal-diet group. 36 In previous in vivo studies, 37,38 chronic or acute alcohol intake could damage the membranes of the intestinal mucosa. The damage to intestinal membranes was related to an increased release of endotoxin such as LPS into the blood steam. Elevated level of endotoxin in the bloodstream and liver affected the activation of Kupffer cells and production of ROS and cytokines. Our previous study also reported that TNF-α mRNA levels were increased in mouse livers with acute alcoholic liver injury. 19 In this study, the EtOH treatment increased TNF-α mRNA expression in AML12 cells. Consequently, AQ leaf and fruit extract treatment decreased TNF-α mRNA expression in acute alcohol-induced hepatotoxicity.
GSH, the major endogenous antioxidant, is widely present in plants and animals and is vital for cellular function, including modulation of redox-regulated signal transduction, apoptosis, and cell proliferation. 39,40 GSH decreases ROS by directly reacting with ROS such as hydrogen peroxide, superoxide anion, singlet oxygen, and hydroxyl, or its role as a substrate for the activity of glutathione peroxidase, which catalyzes the removal of hydrogen peroxide, lipid peroxides, and peroxynitrite. 41 The hepatic GSH level was lowered and dysregulated in cellular homeostasis in chronic liver diseases, such as endotoxemia and ALD. 42 –44 It is well known that either acute or chronic ethanol treatment decreases the hepatic glutathione concentrations in animals. In previous studies, hepatic GSH levels are depleted 6 h after acute EtOH administration in young animals. 45 –47 Although there were few in vitro studies of GSH depletion and recovery of GSH after EtOH-induced intoxication, several researches showed that acute alcohol-induced depletion of hepatic GSH level was recovered 46 and elevated 48 after completion of intoxication metabolism. On the other hand, when GSH levels were enhanced or increased by administration of GSH or its precursors, depletion of GSH concentrations by EtOH is prevented 49,50 and toxicity is diminished. 51,52 In an in vivo study, Vogt and Richie suggested that GSH depletion and replenishment are affected by aging, feed, fasting, time of intoxication, and efflux of GSH from liver. 48 These views implied that there is a defensive mechanism against intoxication by alcohol. In this study, eventhough an enhanced expression of some GSH-synthesizing enzymes and GSH concentration was observed in only EtOH-treated groups or EtOH treatment with AQ extract, the treatment with AQ leaf and fruit extract also showed an increased expression of GSH-synthesizing enzymes and GSH level in non-EtOH-treated AML12 cells. Therefore, we could conclude that the treatment of AQ leaf and fruit extract had an effect on enhancing the expressions of GSH-synthesizing enzymes and GSH concentration in acute EtOH-induced hepatotoxicity in in vitro model.
In this study, we used the microarray gene technology that allows assessment of a large number of genes involved in a wide spectrum of cellular processes. To provide information on several important aspects of AQ extract treatment on acute alcohol-induced hepatotoxicity, the DAVID Gene Functional Classification Tool (
In conclusion, this study demonstrated that treatment of AQ leaf and fruit extract showed a potential for antioxidative and anti-inflammatory activities by quantitative PCR and microarray analysis. Previously, we reported that AQ fruit crude extract had protective effects on acute alcohol-induced hepatotoxicity in animal model. 19 Although protective mechanisms of treatment of AQ extract, in in vitro model, were not fully identified, AQ extract-treated AML12 cells exhibited the enhanced expression of GSH-synthesizing enzymes and the suppressed expression of oxidative stress markers such as NOX4, and decreased expression of TNF-α in acute alcohol-induced hepatotoxicity in an in vitro model. In addition, the response of gene expression changes observed after acute EtOH-induced hepatotoxicity was global. The globally changed gene expression, which was subjected to treatment with 100 mM of EtOH, was almost turned into a pattern of control by treatment with AQ leaf extracts. Taken together, AQ extract or functional component from AQ can be a useful therapeutic agent for acute alcohol-induced hepatotoxicity by decreasing oxidative stress and inflammatory responses.
Footnotes
Acknowledgment
This research was supported by Korea Institute of Planning and Evaluation for Technology in Food, Agriculture, Forestry, and Fisheries Grant (112123-03-3-HD040) and also by BK21 Plus Project (22A20130012143).
Author Disclosure Statement
The authors have no conflicts of interest to disclose.
References
Supplementary Material
Please find the following supplemental material available below.
For Open Access articles published under a Creative Commons License, all supplemental material carries the same license as the article it is associated with.
For non-Open Access articles published, all supplemental material carries a non-exclusive license, and permission requests for re-use of supplemental material or any part of supplemental material shall be sent directly to the copyright owner as specified in the copyright notice associated with the article.