
Abstract
This study investigated whether Nardostachys jatamansi DC extract (NJE) improved insulin sensitivity and suppressed hepatic glucose production in an animal model of type 2 diabetes. C57BL/KsJ-db/db mice were divided into three dietary groups: regular diet (control), NJE, and rosiglitazone. After 6 weeks of feeding, blood glucose, glycosylated hemoglobin, and plasma insulin levels were significantly lower in NJE than in diabetic control group mice. The oral glucose tolerance test also revealed a positive effect of NJE on increasing insulin sensitivity. The homeostatic index of insulin resistance was significantly lower in NJE than in diabetic control group mice. NJE markedly lowered the plasma lipid concentration compared to diabetic control group mice. In the skeletal muscle, the expression of phosphorylated AMP-activated protein kinase, pAkt substrate of 160 kDa, and plasma membrane glucose transporter type 4 increased more in NJE compared to diabetic control group mice. NJE also decreased the expression of glucose-6-phosphatase and phosphoenolpyruvate carboxykinase in the liver. These findings demonstrate that NJE alleviates hyperglycemia by improving insulin sensitivity and inhibiting gluconeogenesis in the liver.
Introduction
D
Nardostachys jatamansi DC (NJ), a member of the plant family Valerianaceae, is a perennial herb growing to about 10–60 cm in height. NJ is used in some Asian countries as a stimulant, a bitter tonic, and an antispasmodic. NJ is also utilized to treat epilepsy, hysteria, palpitations, and convulsions. 5 Sesquiterpenes (jatamansic acid and jatamansone), lignans, and neolignans are reported to be present in the rhizomes of this plant. 6,7 NJ extract (NJE) also contains numerous polyphenols and flavonoids, 8 has protective effects against atopic dermatitis-like skin lesions, 9 and alleviates cerulean-induced acute pancreatitis. 10 Antioxidant and anti-inflammatory effects of NJE have also been reported. 11
The effect of NJE on type 2 diabetes has not yet been assessed, especially with regard to alleviating increased blood glucose levels, improving insulin sensitivity and resistance, and modifying the activities of enzymes involved in hepatic glucose production. Thus, in this study, we investigated whether NJE alleviated hyperglycemia by improving insulin sensitivity and inhibiting gluconeogenesis in the liver of db/db mice.
Materials and Methods
Preparation of NJE
NJ was purchased from Omni Herb (Seoul, Korea), a standard commercial source. The herb's identity was confirmed at a Korean drug testing laboratory. NJ was prepared by decocting the dried herbal preparation twice with 30% ethanol. Each decoction time was ∼3 h. The 30% ethanol extract was centrifuged at 4,000 g for 3 min and the supernatant was filtered through 0.2 μm polyvinylidene fluoride paper. Then, the extract was concentrated by a vacuum evaporator, frozen at −70°C, and lyophilized to a powder. The powder was extracted with distilled water and filtered. The filtrates were stored at 4°C until used.
Animals and diets
Male C57BL/KsJ-db/db mice were purchased from Japan SLC (Hamamatsu, Japan). Five-week-old db/db mice were fed a pelletized commercial chow diet for 2 weeks after arrival. They were subsequently divided randomly into three groups (n = 8 per group): db/db mice in the control group (db/db-control) were fed a standard semisynthetic diet (AIN-93G) for 6 weeks. Animals in the other two groups were fed the AIN-93G diet supplemented with either NJE (db/db-NJE, 0.2%, w/w) or rosiglitazone (db/db-RG, 0.005% w/w). All mice were caged individually under a 12-h light/12-h dark cycle in a temperature-controlled room with food and water available ad libitum. At the end of the experimental period, mice were anesthetized with ether after withholding food for 12 h. Blood samples were collected from the inferior vena cava to determine plasma biomarker levels. After collection of the blood sample, the liver was removed and rinsed with physiological saline solution. All procedures were approved by the animal ethics committee of Pusan National University (PNU-2015-0879).
Blood glucose and glycosylated hemoglobin (HbA1c) levels
The glucose concentration in the venous blood drawn from the tail vein was measured weekly after a 12-h fast using a glucometer (Roche Diagnostics, Mannheim, Germany). Anticoagulant-treated whole blood samples were hemolyzed and the concentration of HbA1c was measured. HbA1c levels were determined by immunoturbidimetry.
Plasma insulin levels
Blood samples from the inferior vena cava were collected into heparin-coated tubes. After centrifugation at 1000 g for 15 min at 4°C, plasma was removed carefully from the sample. Plasma insulin levels were determined with an enzyme-linked immunosorbent assay kit (Millipore Corporation, Billerica, MA, USA).
Homeostatic index of insulin resistance
The homeostatic index of insulin resistance (HOMA-IR) was determined as surrogates of insulin sensitivity.
12,13
HOMA-IR was calculated using the homeostasis model assessment with the following equation [Eq. (1)]:
Oral glucose tolerance test
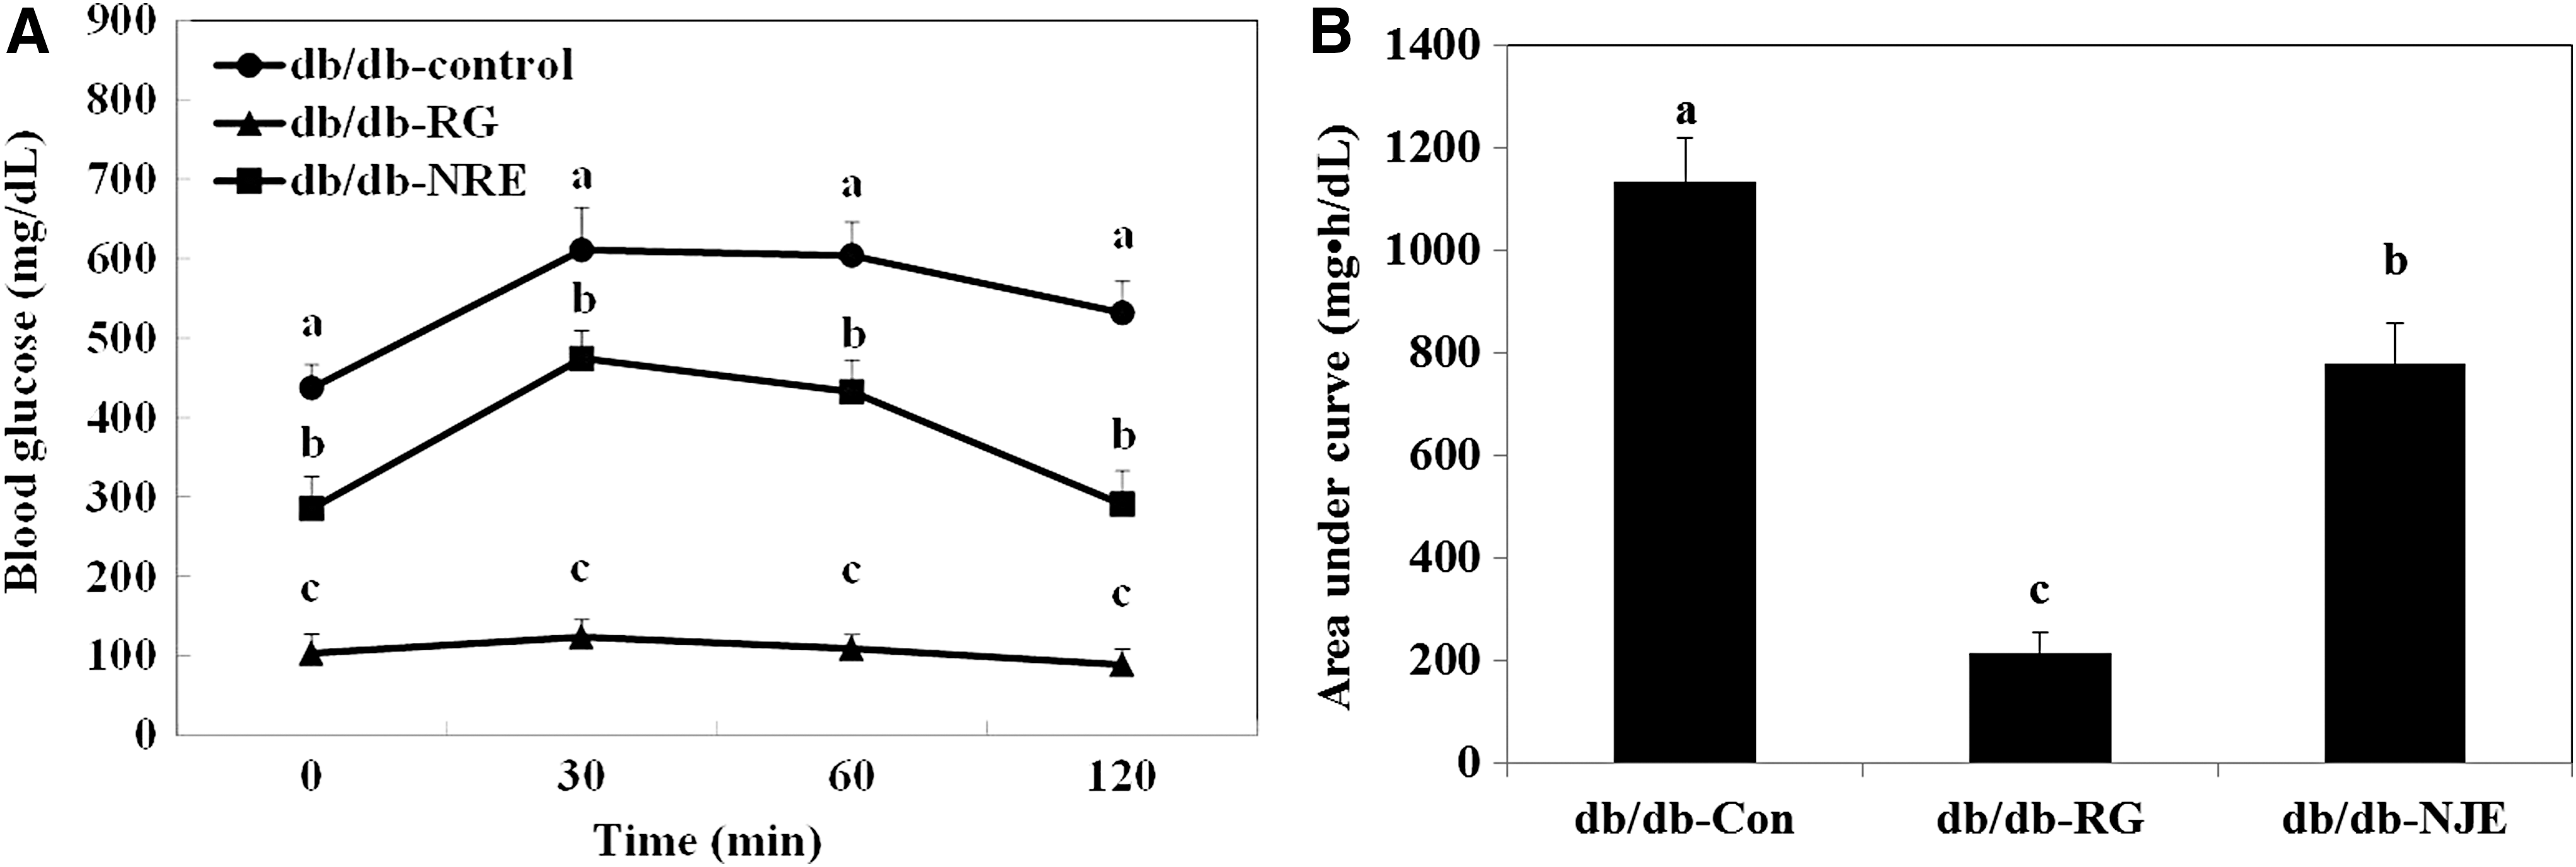
Five weeks after feeding the different diets, mice were subjected to the oral glucose tolerance test (OGTT). Mice were fasted overnight and then 2 g/kg glucose solution was administered orally. Blood samples were taken from the tail vein at 0, 30, 60, and 120 min, and blood glucose was measured. The areas under the curves were calculated using the trapezoidal rule.
Plasma lipid concentrations
Plasma total cholesterol, high-density lipoprotein cholesterol (HDL-C), and triglyceride concentrations were determined using an enzymatic method (Asan Pharmaceuticals, Seoul, Korea). Plasma-free fatty acid concentrations were determined using an enzymatic colorimetric method (Wako, Osaka, Japan).
Hepatic tissue processing
The hepatic enzyme source was prepared according to the method developed by Hulcher and Oleson 14 with a slight modification. A 0.2 g/mL homogenate was prepared in buffer containing 0.1 M triethanolamine, 0.02 M EDTA, and 2 mM dithiothreitol, pH 7.0. The homogenate was centrifuged at 600 g for 10 min to remove cell debris. The supernatant was then centrifuged at 10,000 g followed by 12,000 g at 4°C for 20 min to remove mitochondria. Finally, the supernatant was ultracentrifuged twice at 100,000 g for 60 min at 4°C to obtain the cytosolic supernatant. The mitochondrial and microsomal pellets were resuspended in 1 mL of the homogenization buffer. The protein content was determined by the Bradford method using bovine serum albumin as the standard.
Plasma membrane fraction of skeletal muscle
Muscle tissue was placed in buffer (5 mM sodium azide, 0.25 M sucrose, 0.1 mM phenylmethylsulfonyl fluoride, and 10 mM NaHCO3, pH 7.0) at 4°C. Subfractionation of the muscle membranes was performed as described previously 15 using procedures modified from those described by Klip et al. 16,17 Dissected skeletal muscle was homogenized and centrifuged at 1000 g for 10 min, and the supernatant was collected and stored. The resulting pellet was resuspended in the buffer and rehomogenized in a glass homogenization tube. The supernatant was collected, combined with the first supernatant, and the combination centrifuged at 9000 g for 10 min. The resulting supernatant was then centrifuged at 190,000 g for 60 min. The membranes were subsequently applied to a discontinuous gradient containing 0.25, 0.3, and 0.35 sucrose (g/mL) solutions and centrifuged at 190,000 g for 16 h. Membranes were collected from the top of each gradient interface, resuspended in the buffer, pelleted by centrifugation at 190,000 g for 60 min, and again resuspended in the buffer.
Western blot
Western blot analyses were performed on liver and skeletal muscle tissue extracts. Livers and skeletal muscle tissues were homogenized in ice-cold lysis buffer, centrifuged at 20,000 g at 4°C for 15 min, and the supernatants collected. Protein concentrations in the supernatants were measured using a protein assay kit (Bio-Rad, Hercules, CA, USA). Protein samples (30 μg) were separated on 12% polyacrylamide resolving Tris-HCl gels. Separated proteins were transferred to nitrocellulose membranes. The membranes were blocked in 5% skim milk in Tris-buffered saline containing 0.1% Tween 20 for 1 h at room temperature. Blocked membranes were incubated with antibodies overnight at 4°C. Antibodies against phosphorylated-AMP-activated protein kinase (pAMPK), AMPK, pAS160 (Thr172), AS160, plasma membrane glucose transporter type 4 (PM-GLUT4), GLUT4, glucose 6-phosphatase (G6Pase), and phosphoenolpyruvate carboxykinase (PEPCK) were purchased from Cell Signaling Technology (Beverly, MA, USA). The membranes were then washed and probed with a secondary antibody for 1 h at room temperature. Each antigen-antibody complex was visualized using enhanced chemiluminescence Western blotting detection reagents and LAS-1000 Plus (Fujifilm, Tokyo, Japan). Band densities were determined using an image analyzer (Multi Gauge V3.1; Fujifilm, Valhalla, NY, USA) and normalized to β-actin.
Statistical analyses
Data are presented as mean ± standard deviation. Statistical analyses were performed using SAS 9.1 software (SAS Institute, Cary, NC, USA). Differences among groups were evaluated for significance using one-way analysis of variance followed by the post hoc Duncan's multiple range test. P values less than .05 were considered significant.
Results
Body weight and food and water intake
Throughout the experiment, body weights and water and food intakes of all mice were monitored weekly. At the start of the study, the body weights of mice in the db/db-control, db/db-NJE, and db/db-RG groups did not differ significantly. Body weights increased gradually during the 6-week experimental period. At the end of the study, mice in the db/db-RG (52.98 ± 1.51 g) had a significantly higher body weight than those in db/db-control (44.40 ± 1.73 g) and db/db-NJE (44.92 ± 2.24 g) (Table 1). Daily food intake was not significantly different between the db/db-control, db/db-NJE, and db/db-RG groups. However, water intake was significantly higher in db/db-control (20.30 ± 2.27 mL/day) than db/db-NJE group mice (13.20 ± 1.73 mL/day).
Values are mean ± SD, n = 8 per group.
db/db-control: C57BL/KsJ-db/db mice fed AIN-93G diet, db/db-RG: C57BL/KsJ-db/db mice fed AIN-93G diet supplemented with rosiglitazone (0.005 g/100 g diet), db/db-NJE: C57BL/KsJ-db/db mice fed AIN-93G diet supplemented with NJEs (0.2 g/100 g diet).
Means not sharing a common letter are significantly different among groups (P < .05).
NJE, Nardostachys jatamansi DC extract; NS, not significant; SD, standard deviation.
Blood glucose, HbA1c levels, plasma insulin levels, and HOMA-IR
Initial blood glucose levels were not significantly different among the groups; however, fasting blood glucose levels in db/db-NJE group mice after 2 weeks were significantly lower than those in db/db-control group mice (Fig. 1). Blood glucose levels measured in db/db-control group mice were elevated throughout the experiment, likely reflecting the progression of diabetic mellitus. As shown in Table 2, HbA1c values were 9.35 ± 0.58 and 6.08 ± 0.68 in db/db-control and db/db-NJE group mice, respectively. HbA1c values in db/db-NJE group mice were significantly lower than those in db/db-control group mice (P < .05).

Weekly changes in fasting blood glucose concentrations in C57BL/KsJ-db/db mice administered NJEs. db/db-control: C57BL/KsJ-db/db mice fed AIN-93G diet, db/db-NJE: C57BL/KsJ-db/db mice fed AIN-93G diet supplemented with NJEs (0.2 g/100 g diet), db/db-RG: C57BL/KsJ-db/db mice fed AIN-93G diet supplemented with rosiglitazone (0.005 g/100 g diet), NS: not significant. Values are mean ± SD, n = 8 per group. a–cMeans not sharing a common letter are significantly different among groups (P < .05). NJE, Nardostachys jatamansi DC extract.
Values are mean ± SD, n = 8 per group.
db/db-control: C57BL/KsJ-db/db mice fed AIN-93G diet, db/db-RG: C57BL/KsJ-db/db mice fed AIN-93G diet supplemented with rosiglitazone (0.005 g/100 g diet), db/db-NJE: C57BL/KsJ-db/db mice fed AIN-93G diet supplemented with NJEs (0.2 g/100 g diet).
Means not sharing a common letter are significantly different among groups (P < .05).
HbA1c, blood glycosylated hemoglobin; HOMA-IR, homeostatic index of insulin resistance; QUICKI, quantitative insulin sensitivity check index.
Plasma insulin levels were markedly lower in mice of the db/db-RG group than in mice of the db/db-control group (Table 2). Similarly, db/db-NJE group mice exhibited significantly lower plasma insulin levels than mice in the db/db-control group. HOMA-IR values were significantly lower in db/db-NJE than in db/db-control group mice (P < .05).
Oral glucose tolerance test
Five weeks after feeding the diets, mice were subjected to the OGTT (Fig. 2). For the change point analysis, it was confirmed that db/db-NJE and db/db-RG group mice had a change point at 30 min. Blood glucose concentrations in db/db-RG group mice peaked at 30 min and recovered to the basal value at 120 min. Similarly, blood glucose concentrations in db/db-NJE group mice peaked at 30 min and decreased at 120 min. However, the blood glucose concentration in db/db-control group mice peaked at 30 min and failed to return to baseline after 120 min. Subsequently, the blood glucose concentration became significantly higher in db/db-control mice compared to db/db-NJE and db/db-RG group mice.
Plasma lipid levels
Plasma total cholesterol, triglyceride, free fatty acid, HDL-C, and atherogenic index levels were markedly lower in mice in the db/db-NJE and db/db-RG groups than those in the db/db-control group. Plasma HDL-C levels were significantly higher in the db/db-NJE and db/db-RG groups than those measured in the db/db-control group (Table 3).
Values are mean ± SD, n = 8 per group.
db/db-control: C57BL/KsJ-db/db mice fed AIN-93G diet, db/db-NJE: C57BL/KsJ-db/db mice fed AIN-93G diet supplemented with NJEs (0.2 g/100 g diet), db/db-RG: C57BL/KsJ-db/db mice fed AIN-93G diet supplemented with rosiglitazone (0.005 g/100 g diet).
Means not sharing a common letter are significantly different among groups (P < .05).
AI, atherogenic index; FFA, free fatty acid; HDL-C, high-density lipoprotein cholesterol; LDL-C, low-density lipoprotein cholesterol.
Expression of PM-GLUT4, GLUT4, pAMPK, AMPK, pAS160, and AS160 in skeletal muscle
Dietary supplementation with NJE significantly increased PM-GLUT4, pAMPK, and pAS160 protein levels in skeletal muscle. The expression of PM-GLUT4 in the skeletal muscle significantly increased, reaching levels in db/db-NJE group mice that were 2.3-fold higher than those measured in db/db-control group mice (Fig. 3). The expression of AMPK was unchanged between db/db-NJE and db/db-control group mice. However, the phosphorylation levels of AMPK and AS160, two upstream regulators of GLUT4 translocation to the plasma membrane, significantly increased after supplementation with NJE. This means that NJE has the ability to stimulate glucose uptake through activation of the AMPK-AS160-GLUT4 pathway in skeletal muscle.
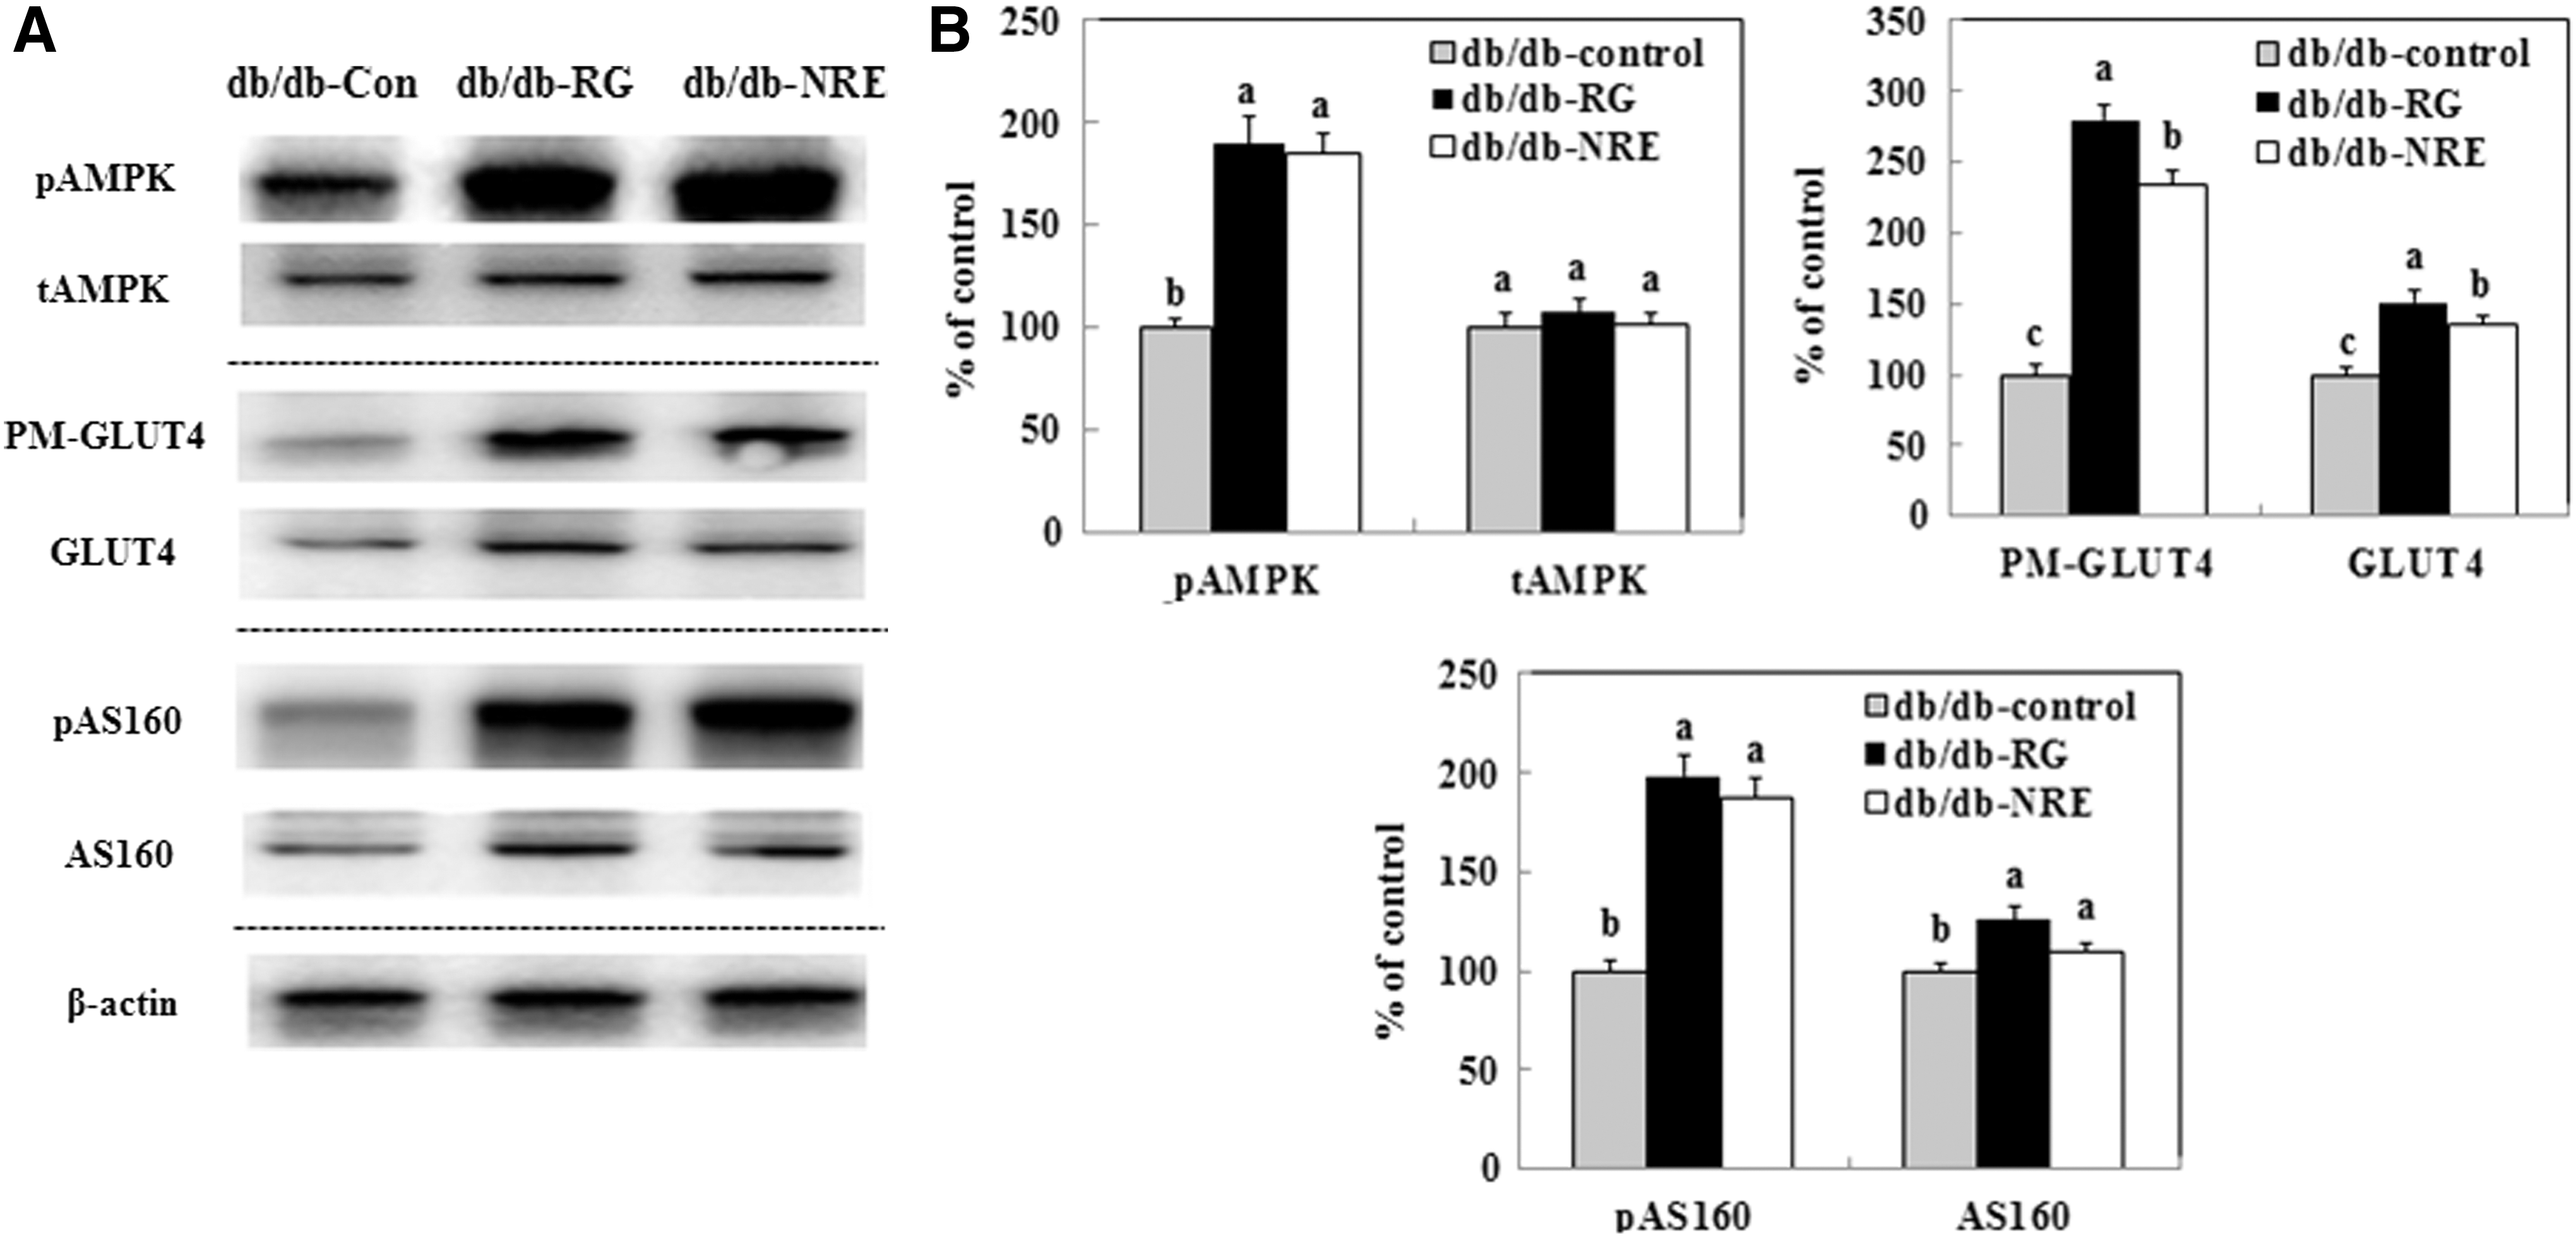
The effect of supplementation with NJE on PM-GLUT4, GLUT4, pAMPK, AMPK, pAS160 and AS160 expression in skeletal muscle. Western blotting and signal intensities were determined by densitometric analysis using Multi Gauge V3.1 software.
Expression of the gluconeogenic enzymes G6Pase and PEPCK
As shown in Figure 4, the hepatic expression of PEPCK significantly decreased in db/db-NJE group mice, with 2.5-fold lower levels than those in the db/db-control group. Similarly, the expression of G6pase in db/db-NJE group mice significantly decreased compared to that in db/db-control group mice. Therefore, expression levels of the gluconeogenic enzymes G6Pase and PEPCK in liver were significantly lower in db/db-NJE than db/db-control group mice.
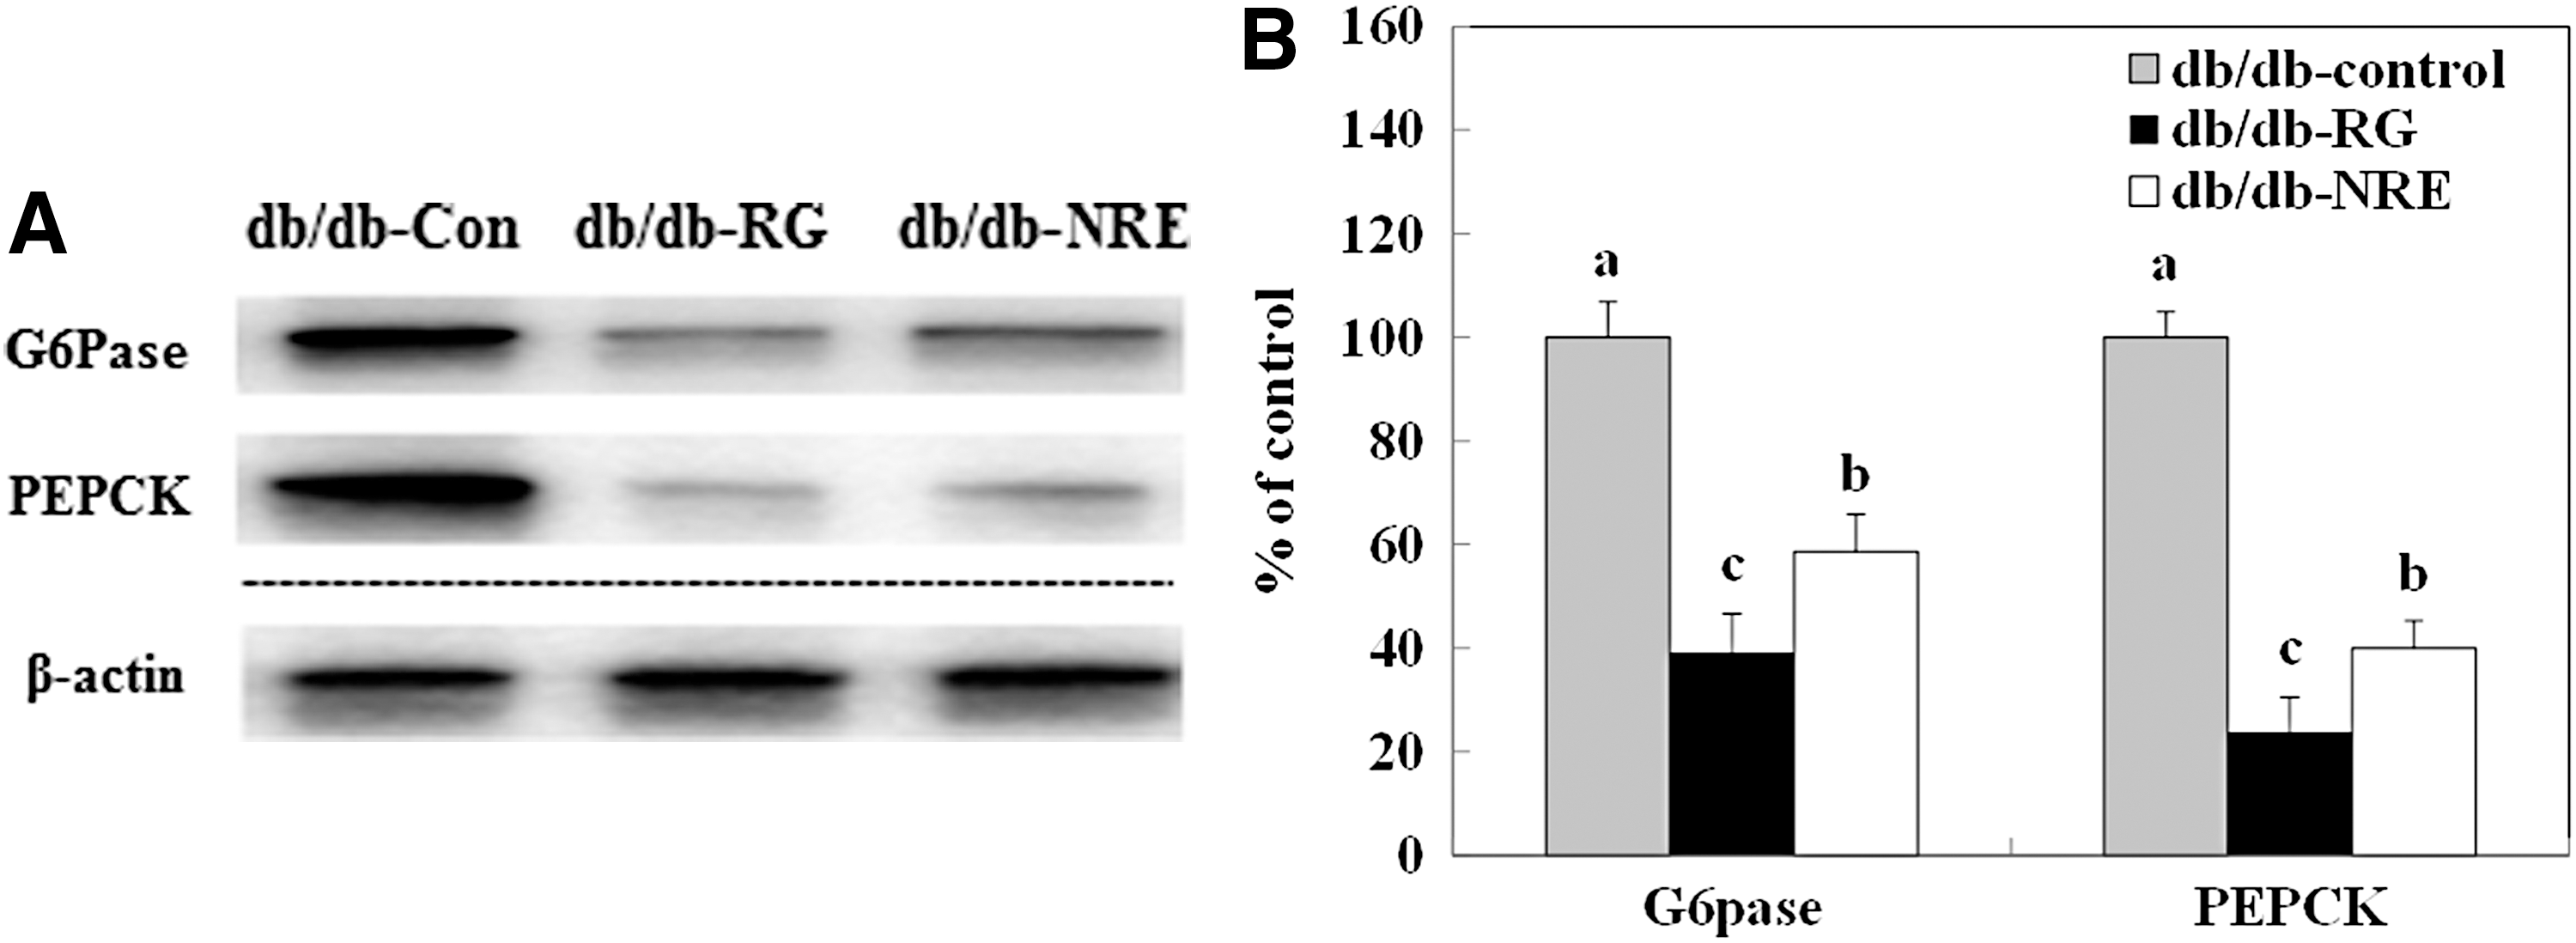
The effect of supplementation with NJE on G6Pase and PEPCK expression in the liver of C57BL/KsJ-db/db mice. Western blotting and signal intensities were determined by densitometric analysis using Multi Gauge V3.1 software.
Discussion
Type 2 diabetes and its associated complications are responsible for many serious health problems of modern society. In this study, we investigated the ability of NJE supplementation to improve hyperglycemia and insulin sensitivity in an animal model of type 2 diabetes, C57BL/KsJ-db/db mice.
Body weights increased in db/db-NJE group mice after 6 weeks. However, this increase was significantly less than that measured in db/db-RG group mice. The weight gain of db/db-RG group mice was attributable to an increase in the weight of adipose tissue. Such a rise in adipose tissue mass has also been observed in patients taking rosiglitazone. 18 Thus, weight gain of db/db-RG group mice can be considered a side effect of rosiglitazone treatment. 19
Food intake was unchanged among the different treatment groups. In contrast, water intake was significantly higher in db/db-control group mice than in db/db-NJE and db/db-RG group mice. The increase in water intake indicates polydipsia, one of the typical symptoms of type 2 diabetes. 20 In this study, NJE supplementation ameliorated the symptoms of diabetes, especially polydipsia.
After 2 weeks of experimental diets, blood glucose levels in db/db-NJE group mice significantly decreased compared to that in db/db-control group mice. Hyperglycemia is an important factor in the development of type 2 diabetes and its complications. 21 Therefore, the effective regulation of hyperglycemia is essential for improving the quality of life in patients with type 2 diabetes. 22 In addition, NJE supplementation in db/db mice significantly lowered the HbA1c concentrations compared to db/db-control mice. HbA1c is mainly measured as a marker of average blood glucose levels over long time periods and is effective for monitoring glycemic control in patients with type 2 diabetes. 23 Possible mechanisms by which NJE can decrease hyperglycemia and HbA1c may involve flavonoids present in this extract that have been reported to have anti-diabetic effects by lowering blood glucose levels. 24 This suggests that supplementation with NJE has a positive effect in controlling hyperglycemia in type 2 diabetes.
Generally, db/db mice exhibit an initial phase of hyperinsulinemia and progressively develop insulinopenia with age, a feature that is observed in the late stages of type 2 diabetes. 25 In this study, plasma insulin levels in db/db-control group mice were significantly higher than those measured in db/db-NJE group mice. This suggested that the db/db-control group mice were hyperinsulinemic. These results are consistent with insulin resistance, which is characteristic of the early stage of type 2 diabetes. In this situation, insulin does not function correctly in target tissues. Thus, more insulin is required leading to hyperinsulinemia. NJE has the ability to improve insulin resistance, thereby reducing hyperinsulinemia and preventing metabolic symptoms. 24,26,27
HOMA-IR, simple index of insulin resistance, was calculated using fasting blood glucose and insulin levels. HOMA-IR values should increase with increasing insulin resistance. 25 Although the HOMA-IR index has numerous limitations in terms of accuracy and reliability, 28 it effectively identifies insulin resistance. 29 Quantitative insulin sensitivity check index (QUICKI) values should decrease with increasing insulin resistance. 30 In this study, the QUICKI value was significantly lower in db/db-NJE group mice compared with the values measured in db/db-control group mice. These results suggest that NJE may enhance insulin sensitivity.
Five weeks after feeding the diets, the OGTT was performed. Blood glucose levels in db/db-RG group mice recovered to nearly the basal value at 120 min after glucose loading. Db/db-NJE group mice also improved their glucose processing capacity with lowered blood glucose concentrations at 120 min, while glucose tolerance in db/db-control group mice failed to return to baseline after 120 min. Therefore, db/db-NJE group mice appear to have improved insulin sensitivity, which is important for lowering blood glucose levels, whereas db/db-control group mice did not show any change in postprandial glucose level.
Both lipolysis and circulating free fatty acids are increased in an insulin-resistant condition. 31,32 Furthermore, plasma-free fatty acid levels are elevated in obese patients with type 2 diabetes, which accounts for up to 50% of the insulin resistance. In this study, db/db-NJE group mice had significantly lower plasma total cholesterol, triglyceride, free fatty acid, and HDL-C levels compared to db/db-control group mice. In contrast, db/db-NJE group mice exhibited significantly increased HDL-C levels compared to db/db-control group mice. The polyphenol content of NJE may be responsible for this effect on blood lipids. A few studies have reported that free fatty acid and low-density lipoprotein cholesterol levels were significantly reduced by supplementation with natural products containing polyphenols in type 2 diabetic animals. 33,34 In this study, the results also show that NJE supplementation ameliorates the effects of insulin resistance, in part, by reducing plasma lipid levels in db/db mice.
The AMPK-related glucose transport pathway in skeletal muscle is considered to play an important role in maintaining global glucose homeostasis. 35 Glucose uptake is regulated by insulin binding to the insulin receptor, which facilitates glucose transport into cells by GLUT4, the key glucose transporter that responds to insulin in skeletal muscle. When activated, AMPK phosphorylates and activates AS160, thereby promoting the translocation of GLUT4 from the intracellular pool to the plasma membrane. 36 In this study, supplementation of db/db mice with NJE significantly increased the expression of pAMPK. This increased the expression of GLUT4 in plasma membrane, which contributed to enhanced insulin sensitivity. Supplementation with NJE also increased the expression of pAS160, suggesting that it may stimulate glucose uptake in skeletal muscle and decrease hyperglycemia. 37 AS160 is a main arbitrator of GLUT4 translocation and glucose uptake in skeletal muscle cells. 38 When AS160 is phosphorylated, translocation of GLUT4 from the intracellular pool to the plasma membrane is accelerated. 39 Thus, NJE may stimulate glucose uptake in skeletal muscles through activation of AMPK-AS160-GLUT4 pathway.
The liver plays an important role in regulating glucose production through gluconeogenesis and glycogenolysis. In the postprandial state, insulin stimulates the liver to remove more glucose from the blood and synthesize glycogen, consequently decreasing postprandial hyperglycemia. Conversely, in the starved state, the liver produces more glucose to maintain blood glucose levels. 40 In the diabetic condition, hepatic gluconeogenesis is abnormally enhanced and glycogen synthesis is inhibited. 41 Suppressing hepatic glucose output and inhibiting some enzymes that regulate the gluconeogenic pathways in the liver are molecular targets for treating diabetes. 42 The essential enzymes that regulate gluconeogenesis and glucose metabolism in the liver are G6Pase and PEPCK. 43 By reducing the activity of these enzymes, less glucose is produced, thus reducing blood glucose levels. The results of this study suggest that NJE supplementation significantly decreases the expression of G6Pase and PEPCK. This means that NJE may have an ability to reduce hepatic gluconeogenesis.
In conclusion, the results of this study demonstrate that NJE activates pAMPK, GLUT4, and pAS160 in skeletal muscle. It also inhibits hepatic G6Pase, thereby suppressing hepatic gluconeogenesis. NJE improves hyperglycemia by enhancing insulin sensitivity in skeletal muscle and suppressing glucose production in the liver. These results suggest that supplementing the diet with NJE may have beneficial effects in type 2 diabetic animals, suggesting that it may have potential for use as an anti-diabetic supplement for human patients.
Footnotes
Acknowledgments
This work was supported by a grant from the Korea Bio Medical Science Institute.
Author Disclosure Statement
The authors have declared that there are no conflicts of interest.