




Abstract
Diet is a modifiable key factor targeted in prevention and management of nonalcoholic fatty liver disease (NAFLD). The aim was to study the effect of Mediterranean Diet (MedDiet) on clinical, biochemical, and inflammatory profile in NAFLD patients with simple steatosis. Potential associations of signal transducer and activator of transcription 3 (STAT3) rs2293152 genotype to diet composition and patients' profile were investigated. In this nonrandomized, open-label, 24-week prospective intervention study, 44 untreated NAFLD patients with nonsignificant fibrosis received nutritional counsel to increase adherence to MedDiet. Adherence to MedDiet was estimated with MedDietScore. Furthermore, we genotyped STAT3 rs2293152 single nucleotide polymorphism and performed clinical and inflammatory measurements. In all patients, MedDietScore increased and anthropometric indices improved, whereas liver imaging, liver fibrosis score, blood pressure, fasting glucose, glycated hemoglobin (HbA1c), C-reactive protein (CRP), visfatin, and oxidized low-density lipoprotein levels were also significantly ameliorated compared with baseline (P < .05). No association of STAT3 polymorphism with diet composition was found. Comparisons of mean differences between G- and C-carriers at the end point of the trial showed that only visfatin was significantly associated with the STAT3 genotype (−0.0 ± 4.6 vs. −4.2 ± 3.9, P = .04, respectively). Carrying the G-allele was associated with an increase of the visfatin levels (3.4 ± 1.5 ng/mL, P = .028). Our results show amelioration of clinical, biochemical, and inflammatory biomarkers in NAFLD patients in response to MedDiet. STAT3 rs2293152 G-carriers experienced more beneficial changes at the end of the intervention compared with baseline. An association between visfatin levels and STAT3 genotype has been shown for the first time.
Introduction
Nonalcoholic fatty liver disease (NAFLD) is an emerging public health issue worldwide representing more than 75% of chronic liver diseases among adults and children in Western societies. 1 NAFLD prevalence has reached 20–30% of the general population and it has been estimated that about one billion individuals worldwide have NAFLD. 2,3 It includes a wide spectrum of liver diseases, from steatosis to nonalcoholic steatohepatitis (NASH), and finally end-stage liver disease 2 or hepatocellular carcinoma (HCC). 4
Lifestyle changes rather than medication treatment are considered favorable for the management of NAFLD. Increase in physical activity and an ∼10% decrease in initial body weight (BW) have shown to decrease liver fat and prevent the onset of the consequent life-threatening conditions. 5 In addition, an inverse relationship between adherence to Mediterranean Diet (MedDiet) and the prevalence of NAFLD has been documented. 6 Even without weight loss, MedDiet reduces liver steatosis and improves insulin sensitivity in insulin-resistant NAFLD patients. 7 We recently published the results of a pilot clinical trial where snacks of alike caloric content were substituted with dried fruits in meal plans of 55 NAFLD patients. 8 Beneficial effects on body fat composition, liver ultrasound scanning, diet composition, fasting glucose, and interleukin-6 (IL-6) levels were observed.
Numerous single nucleotide polymorphisms (SNPs) are linked to NAFLD/NASH; genes such as PNPLA3, APOE, SOD2, TNF, TM6SF2, and GCKR have been replicated in histologically characterized NAFLD cohorts and have been associated with NAFLD susceptibility. 9 –12 In 2008, Sookoian et al. observed significant associations between signal transducer and activator of transcription 3 (STAT3) gene variants and NAFLD. 13 Furthermore, STAT3 has been reported as a crucial link between inflammation and HCC progression. 14
The aim of this study was to investigate changes in nutritional, anthropometric, clinical, and inflammatory/oxidative stress profile of nonfibrotic NAFLD patients, who have previously received a 6-month nutritional counseling to adhere to MedDiet. As secondary outcome, we compared the response of STAT3 rs2293152 genotype carriers against noncarriers [the G (risk)-allele carriers vs. the non-G-carriers or C-carriers] in all traits evaluated. Based on the existing data regarding the negative association between MedDiet adherence and the prevalence of NAFLD, 6,7 we hypothesized that increasing MedDiet adherence in nonfibrotic NAFLD patients would improve disease-related traits and that these phenotype changes might differ in individuals with certain STAT3 genotypes.
Materials and Methods
Subjects
In total, 44 Greek Caucasian patients with nonfibrotic NAFLD participated in the study. Abdominal ultrasound (US) and elastography ultrasound stiffness (EUS; <75 kPa) were used for NAFLD diagnosis and detection of liver fibrosis at the General Hospital of Athens “Laiko.” Eligible subjects were patients of both sex, older than 18 years of age with no change in BW for the last 6 months before the trial, and a body mass index (BMI) >25 kg/m2.
Exclusion criteria were as follows: the presence of chronic viral hepatitis; the presence of congenital or acquired liver disease; the history of previous exposure to hepatotoxic drugs; the evidence of hepatic cirrhosis; ultrasonography values <1 Hz; bariatric surgery; daily consumption of ethanol >20 g for women and >30 g for men for >6 months during the last 5 years; any medication effective on fatty liver disease introduced <6 months before or during the trial; the co-presence of a life-threatening disease; psychiatric disorders impairing the patient's ability to provide written informed consent; age >65 years; pregnant or lactating women; subjects supplemented with omega-3 polyunsaturated fatty acids (PUFA), probiotics/synbiotics, antioxidant vitamins, and/or phytochemicals; and any planned, structured, and repetitive physical activity. Patients with any medication change during the trial were also excluded from analysis.
Study design
According to the Declaration of Helsinki, the study was approved by the Ethics Committees of Harokopio University of Athens and the General Hospital of Athens “Laiko.” Patients were recruited between April and July 2014 and all eligible subjects willing to participate signed an informed consent form. A full review of inclusion and exclusion criteria and a detailed explanation of risks and benefits of the study took place. Upon its completion, the trial has been registered in
Experienced clinical dieticians were appointed to provide nutritional guidance to all NAFLD patients. Counseling was based on the traditional MedDiet as described by Keys 15 in the even countries study (1995) and by Ryan et al. 7 All participants attended the same number of sessions on weeks 0 (baseline), 12, and 24. Participants were instructed to increase the consumption of vegetables, whole grains, fruits, fish, legumes, and raw nut intake. Emphasis was given to use extra virgin olive oil as the main fat in diet. Within the frame of a traditional MedDiet, subjects were advised to decrease fermented dairy and poultry and consume small amounts of red meat and homemade sweets. 7
The distribution of nutrients in meal plans in relation to total caloric value was as follows: 40% of total energy as fat (50% as monounsaturated fatty acids [MUFAs]), 20% as protein, 40% as carbohydrate, 300 mg/day as dietary cholesterol, and 20–30 g fiber/day. 7 Daily energy needs were calculated based on Harris–Benedict equation of basic metabolic rate and sedentary lifestyle.
The primary endpoint of the study was improvement in NAFLD clinical features in recruited patients. Thus, it was calculated that with the sample size of 44 cases we would have 90% power to detect a significant difference in EUS at an effect size of 0.5 and significance level at 0.05.
Liver imaging
Liver imaging was performed at the beginning (week 0) and at the end of intervention period (week 24). An appointed physician conducted US in all patients for diagnosis of NAFLD, whereas liver fibrosis level was evaluated with EUS.
Clinical examination
Clinical examination included (1) anthropometry, (2) physical examination, and (3) blood test all of which were performed after a ≥12-h fast.
(A) BW, height, waist and hip circumferences (WC, HC), waist-to-hip ratio (WHR), and BMI were measured both at baseline (week 0) and at the end of the intervention period (week 24). BW records were made early in the morning in light clothing and without shoes using a flat scale (Tanita WB-110MA) adjusted to the nearest 0.1 kg. Height was measured on a stadiometer (Seca Mode 220) also adjusted to the nearest 0.1 cm. WC, HC, and WHR were measured using an anthropometric tape. Based on bioimpedance analysis body composition was evaluated pre- and postintervention with the Tanita WB.
(B) Physical examination included diastolic and systolic blood pressure (DBP and SBP in mmHg) and heart frequency measurements that were performed at baseline (week 0) and at the end of the trial (week 24) using an electronic sphygmomanometer (OMRON HEM-907 XL; OMRON, Kyoto, Japan). The recorded values were the mean of two consecutive measurements.
(C) Blood withdrawals were performed before (week 0) and after the intervention period (week 24) using a catheter in an antecubital vein. An automatic analyzer was used to determine patients' biochemical profile, whereas glycated hemoglobin (HbA1c) was measured using high-performance liquid chromatography. 16 Reference values for the biochemical parameters were as follows: glucose, 74–106 mg/dL; serum glutamic oxaloacetic transaminase (SGOT), 5–35 U/L men and 5–31 U/L women; serum glutamic pyruvic transaminase (SGPT), 5–45 U/L males and 5–34 U/L, gamma-glutamyltransferase (γGT), 12–64 U/L men and 7–36 U/L women; alkaline phosphatase (ALP), 53–128 U/L men and 48–141 U/L women; total bilirubin, 0.3–1.2 mg/dL; direct bilirubin, 0.0–0.3 mg/dL; HbA1c, 4.8–6.0%; insulin, 4–16 μIU/mL; uric acid, 3.5–7.2 mg/dL men and 2.6–6.6 mg/dL women; creatinine, 0.7–1.3 mg/dL men and 0.6–1.1 mg/dL women; albumin, 3.5–5.2 g/dL; iron (Fe), 59–158 μg/dL males and 37–145 mg/dL females; ferritin (Fer), 30–400 ng/dL men and 15–150 ng/dL women. NAFLD fibrosis score (NFS) was also calculated as follows: NFS = −1.675 + 0.037 × age (year) +0.094 × BMI (kg/m2) + 1.13 × impaired fasting glucose/diabetes (yes = 1, no = 0) + 0.99 × AST/ALT ratio −0.013 × platelet count ( × 109/L) −0.66 × albumin (g/dL). 17
Sandwich enzyme-linked immunosorbent assay measurements
Sandwich enzyme-linked immunosorbent assay (ELISA) measurements were performed to determine levels of inflammation and oxidative stress. Serum samples of coagulated freshly drawn blood were separated by centrifugation at 1800 g for 10 min at 4°C and were stored at −80°C for subsequent ELISA analyses. C-reactive protein (CRP), tumor necrosis factor alpha (TNF-α), IL-6, oxidized low-density lipoprotein (oxLDL), visfatin, and leptin levels were measured according to manufacturers' instructions.
Total serum oxidizability
Total serum oxidizability was estimated photometrically in serum samples applying the method described by Esterbauer and Jurgens. 18
Dietary history and analysis
Food data derived from (1) 3-day food records, (2) the MedDietScore questionnaire, and (3) 24-h diet recalls.
(A) Subjects were instructed to keep a 3-day food record of nonconsecutive days including 1 weekend day, at weeks 0, 12, and 24. Participants were trained by appointed dieticians who were also responsible to review all records for unclear descriptions, errors, omissions, or doubtful entries. Completed records were checked for accuracy by the research supervisor.
(B) Similarly, the MedDietScore questionnaire was completed at weeks 0, 12, and 24 to check the adherence to the Mediterranean dietary pattern. 19 The questionnaire consists of 11 main food components of the MedDiet, namely nonrefined cereals, fruits, vegetables, potatoes, legumes, olive oil, fish, red meat, poultry, full fat dairy products, and alcohol. Consumption of foods items that belong to MedDiet pattern are scored from 0 to 5 accounting for no, rare, frequent, very frequent, weekly, and daily consumption, respectively. On the contrary, consumption of foods that are away from the MedDiet pattern scores are on a reverse scale. The total score ranges from 0 to 55.
(C) During the intervention period, adherence to dietary counseling was monitored by nonscheduled phone calls (one per month), receiving 24-h dietary recalls.
Energy and macronutrient intake (fat, protein, and carbohydrate) from nutritional data were analyzed by Nutritionist Pro nutrient analysis software, version 5.2.0 (Axxya Systems; Nutritionist Pro, Stafford, TX, USA). The Nutritionist Pro food database was expanded by adding analyses of traditional Greek foods/recipes and nutrient information for local processed food items (mainly snack foods, sweets, and fast foods) as documented on the industry food label.
DNA extraction and genotyping
Genetic variation of STAT3 rs2293152 was analyzed with real-time amplification by sequence-specific primers and melting curve analysis using a Light Cycler Instrument. Genotyping was completed using StepOnePlus™ (Applied Biosystems) with the help of TaqMan® SNP Genotyping. Genomic DNA (gDNA) extraction from buffy coat of anticoagulated blood samples was performed using the iPrep™ Purification Instrument (Invitrogen Ltd., Invitrogen Corp.) and the iPrep PureLink™ gDNA Blood Kit (Invitrogen Ltd., Invitrogen Corp.) were used according to the manufacturer's instructions.
Statistical analysis
Statistical analyses were performed using the Statistical Package for the Social Sciences (SPSS 21.0 for Windows, Chicago, IL, USA). The Kolmogorov–Smirnov test was applied to check normal distribution for all parameters and descriptive statistics were exported. Parametric data are expressed as mean values (±standard deviation). Nonparametric data are expressed as medians and interquartile ranges. The paired samples t-test was applied to compare the differences between pre- and postintervention within variables of normal distribution. The Mann–Whitney test was applied for variables without normal distribution. The SNP genotypes were coded as categorical variables: 0 = 2 major alleles and 1 = at least one minor allele (heterozygous or homozygous). Multiple linear regression was performed to test the hypothesis of association between polymorphisms and biomarkers in response to nutritional counseling after age, sex, and BMI change adjustments during the 6-month trial. General linear models were applied to test the association between biomarkers and SNPs. The level of significance was defined at P < .05.
Results
In total, 44 NAFLD patients met eligibility and all subjects completed the trial (Fig. 1). No participant dropped out or was excluded from the study. The mean age was 50.4 ± 10.2 years and 40.9% of the patients were men. Baseline characteristics are given in Table 1.
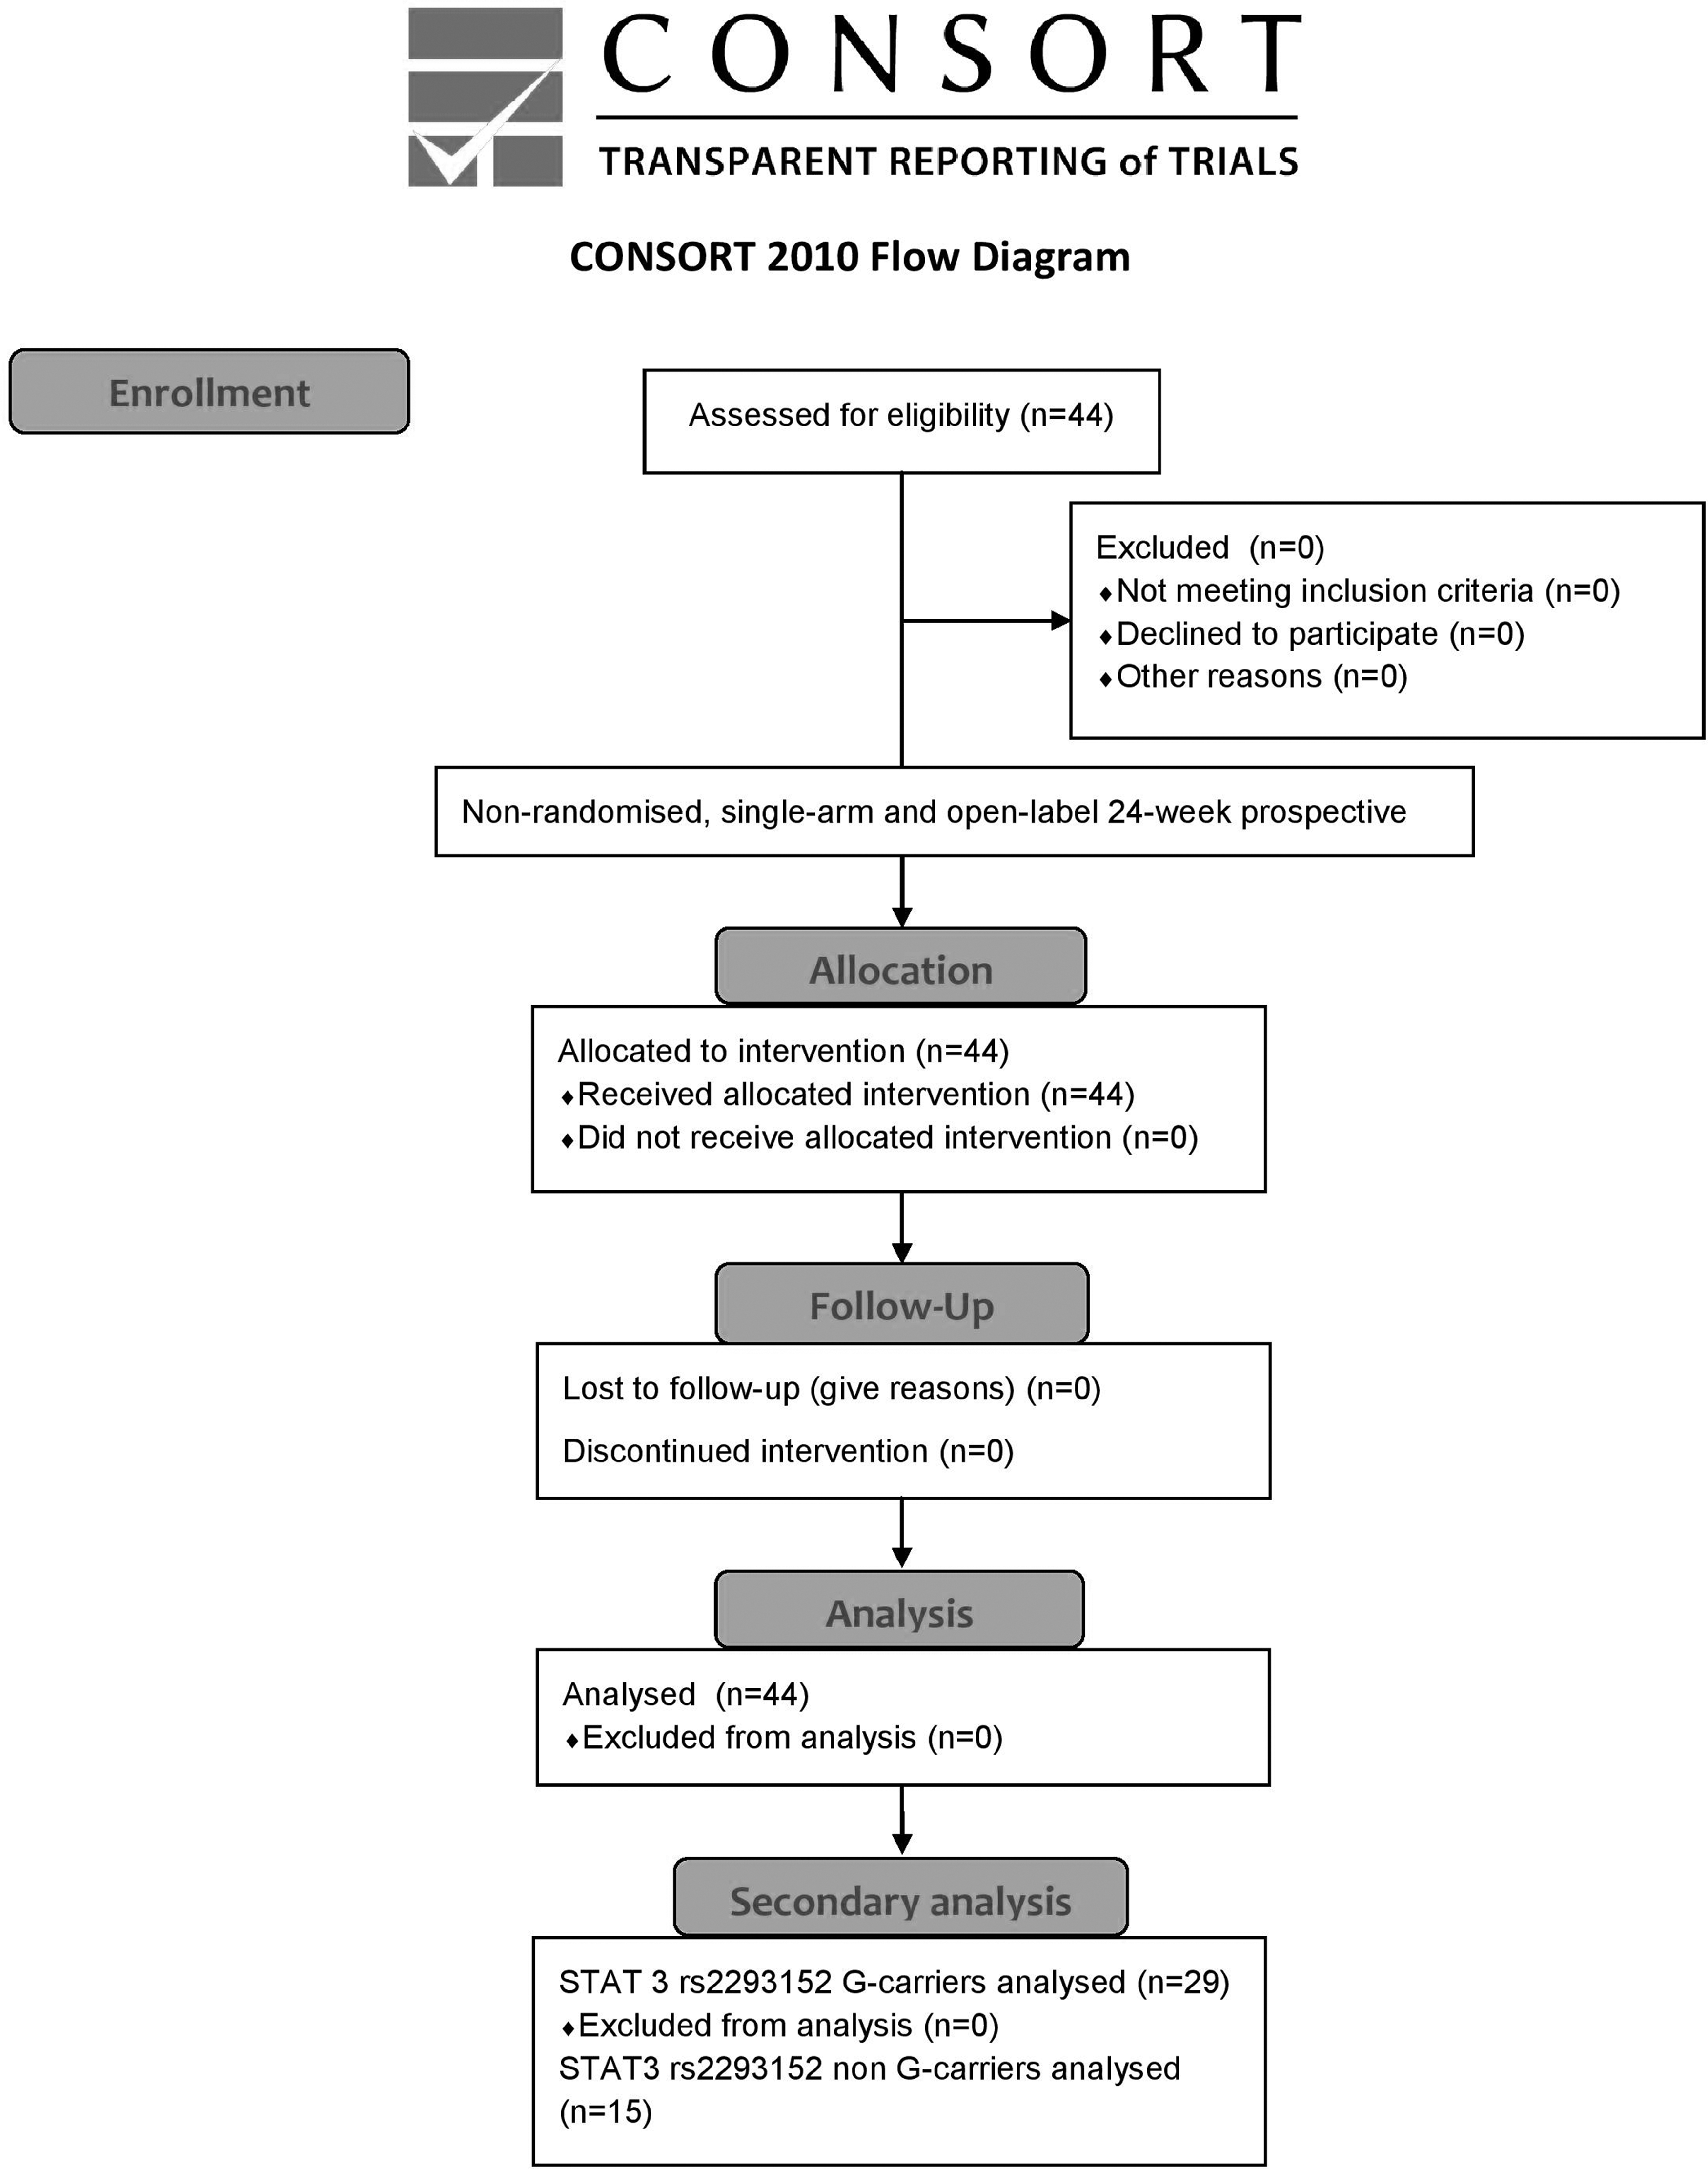
CONSORT 2010 flow diagram: enrollment, assignment, allocation, and intervention exposure, follow-up, analysis.
Baseline Characteristics of Enrolled Nonalcoholic Fatty Liver Disease Patients
All enrolled patients (N = 44) completed the trial (18 men and 26 women). Subjects' mean age was 50.48 ± 10.25 years and mean height was 1.69 ± 0.02. Data are given as mean ± SD.
γGT, gamma-glutamyltransferase; ALP, alkaline phosphatase; BMI, body mass index; BW, body weight; CRP, C-reactive protein; DBIL, direct bilirubin; DBP, diastolic blood pressure; EUS, elastography ultrasound stiffness; Fe, Iron; Fer, ferritin; HbA1c, glycated hemoglobin; HC, hip circumference; HF, heart frequency; IL-6, interleukin-6; MedDiet, Mediterranean Diet; MUFA, monounsaturated fatty acid; NFS, NAFLD Fibrosis Score; oxLDL, oxidized low-density lipoprotein; PUFA, polyunsaturated fatty acids; SBP, systolic blood pressure; SD, standard deviation; SFA, saturated fatty acid; SGOT, serum glutamic oxaloacetic transaminase; SGOT/SGPT, SGOT to SGPT ratio; SGPT, serum glutamic pyruvic transaminase; TBIL, total bilirubin; TNF-α, tumor necrosis factor alpha; US, ultrasound; WC, waist circumference; WHR, waist-to-hip ratio.
The effect of Mediterranean Diet in enrolled NAFLD patients
As given in Figure 2, all participants increased adherence to the Mediterranean Dietary pattern at the endpoint of the trial (30.8 ± 4.3 vs. 35.3 ± 5.1, P < .0001). At the endpoint of the trial, all anthropometric indices, that is, BW, BMI, FAT, trunk FAT, WC, and HC (Fig. 3), were significantly ameliorated (82.4 ± 14.1 kg vs. 80.1 ± 13.7 kg, P < .0001; 28.9 ± 4.0 kg/m2 vs. 28.0 ± 4.0 kg/m2, P < .0001; 32.4% ± 8.7% vs. 31.3% ± 8.8%, P = .007; 31.4% ± 7.4% vs. 30.6% ± 7.6%, P = .029; 99.0 ± 10.8 cm vs. 96.9 ± 11.4 cm, P = .002 and 110.0 ± 9.3 cm vs. 107.7 ± 8.7 cm, P < .0001, respectively), except for WHR (0.9 ± 0.1 vs. 0.9 ± 0.1, P = .648). Significant improvements in liver imaging and liver fibrosis were also observed; US (Hz): 54.5% vs. 50%, P < .0001; EUS (kPa): 5.4 ± 1.2 vs. 4.9 ± 0.7, P = .005 and NFS: −2.3 ± 1.0 vs. −2.2 ± 1.1, P = .004. In Figure 3, significant reductions in SBP, DBP, and levels of blood glucose and HbA1c are given (129.7 ± 13.1 mmHg vs. 123.4 ± 11.9 mmHg, P = .001; 80.8 ± 8.8 mmHg vs. 78.2 ± 9.5 mmHg, P = .017; 94.0 ± 14.9 mg/dL vs. 91.0 ± 15.5 mg/dL, P = .036 and 5.7 ± 0.5 vs. 5.4 ± 0.9, P < .0001, respectively). Levels of ALP, SGOT, SGPT, and γGT remained unchanged (Supplementary Table S1).
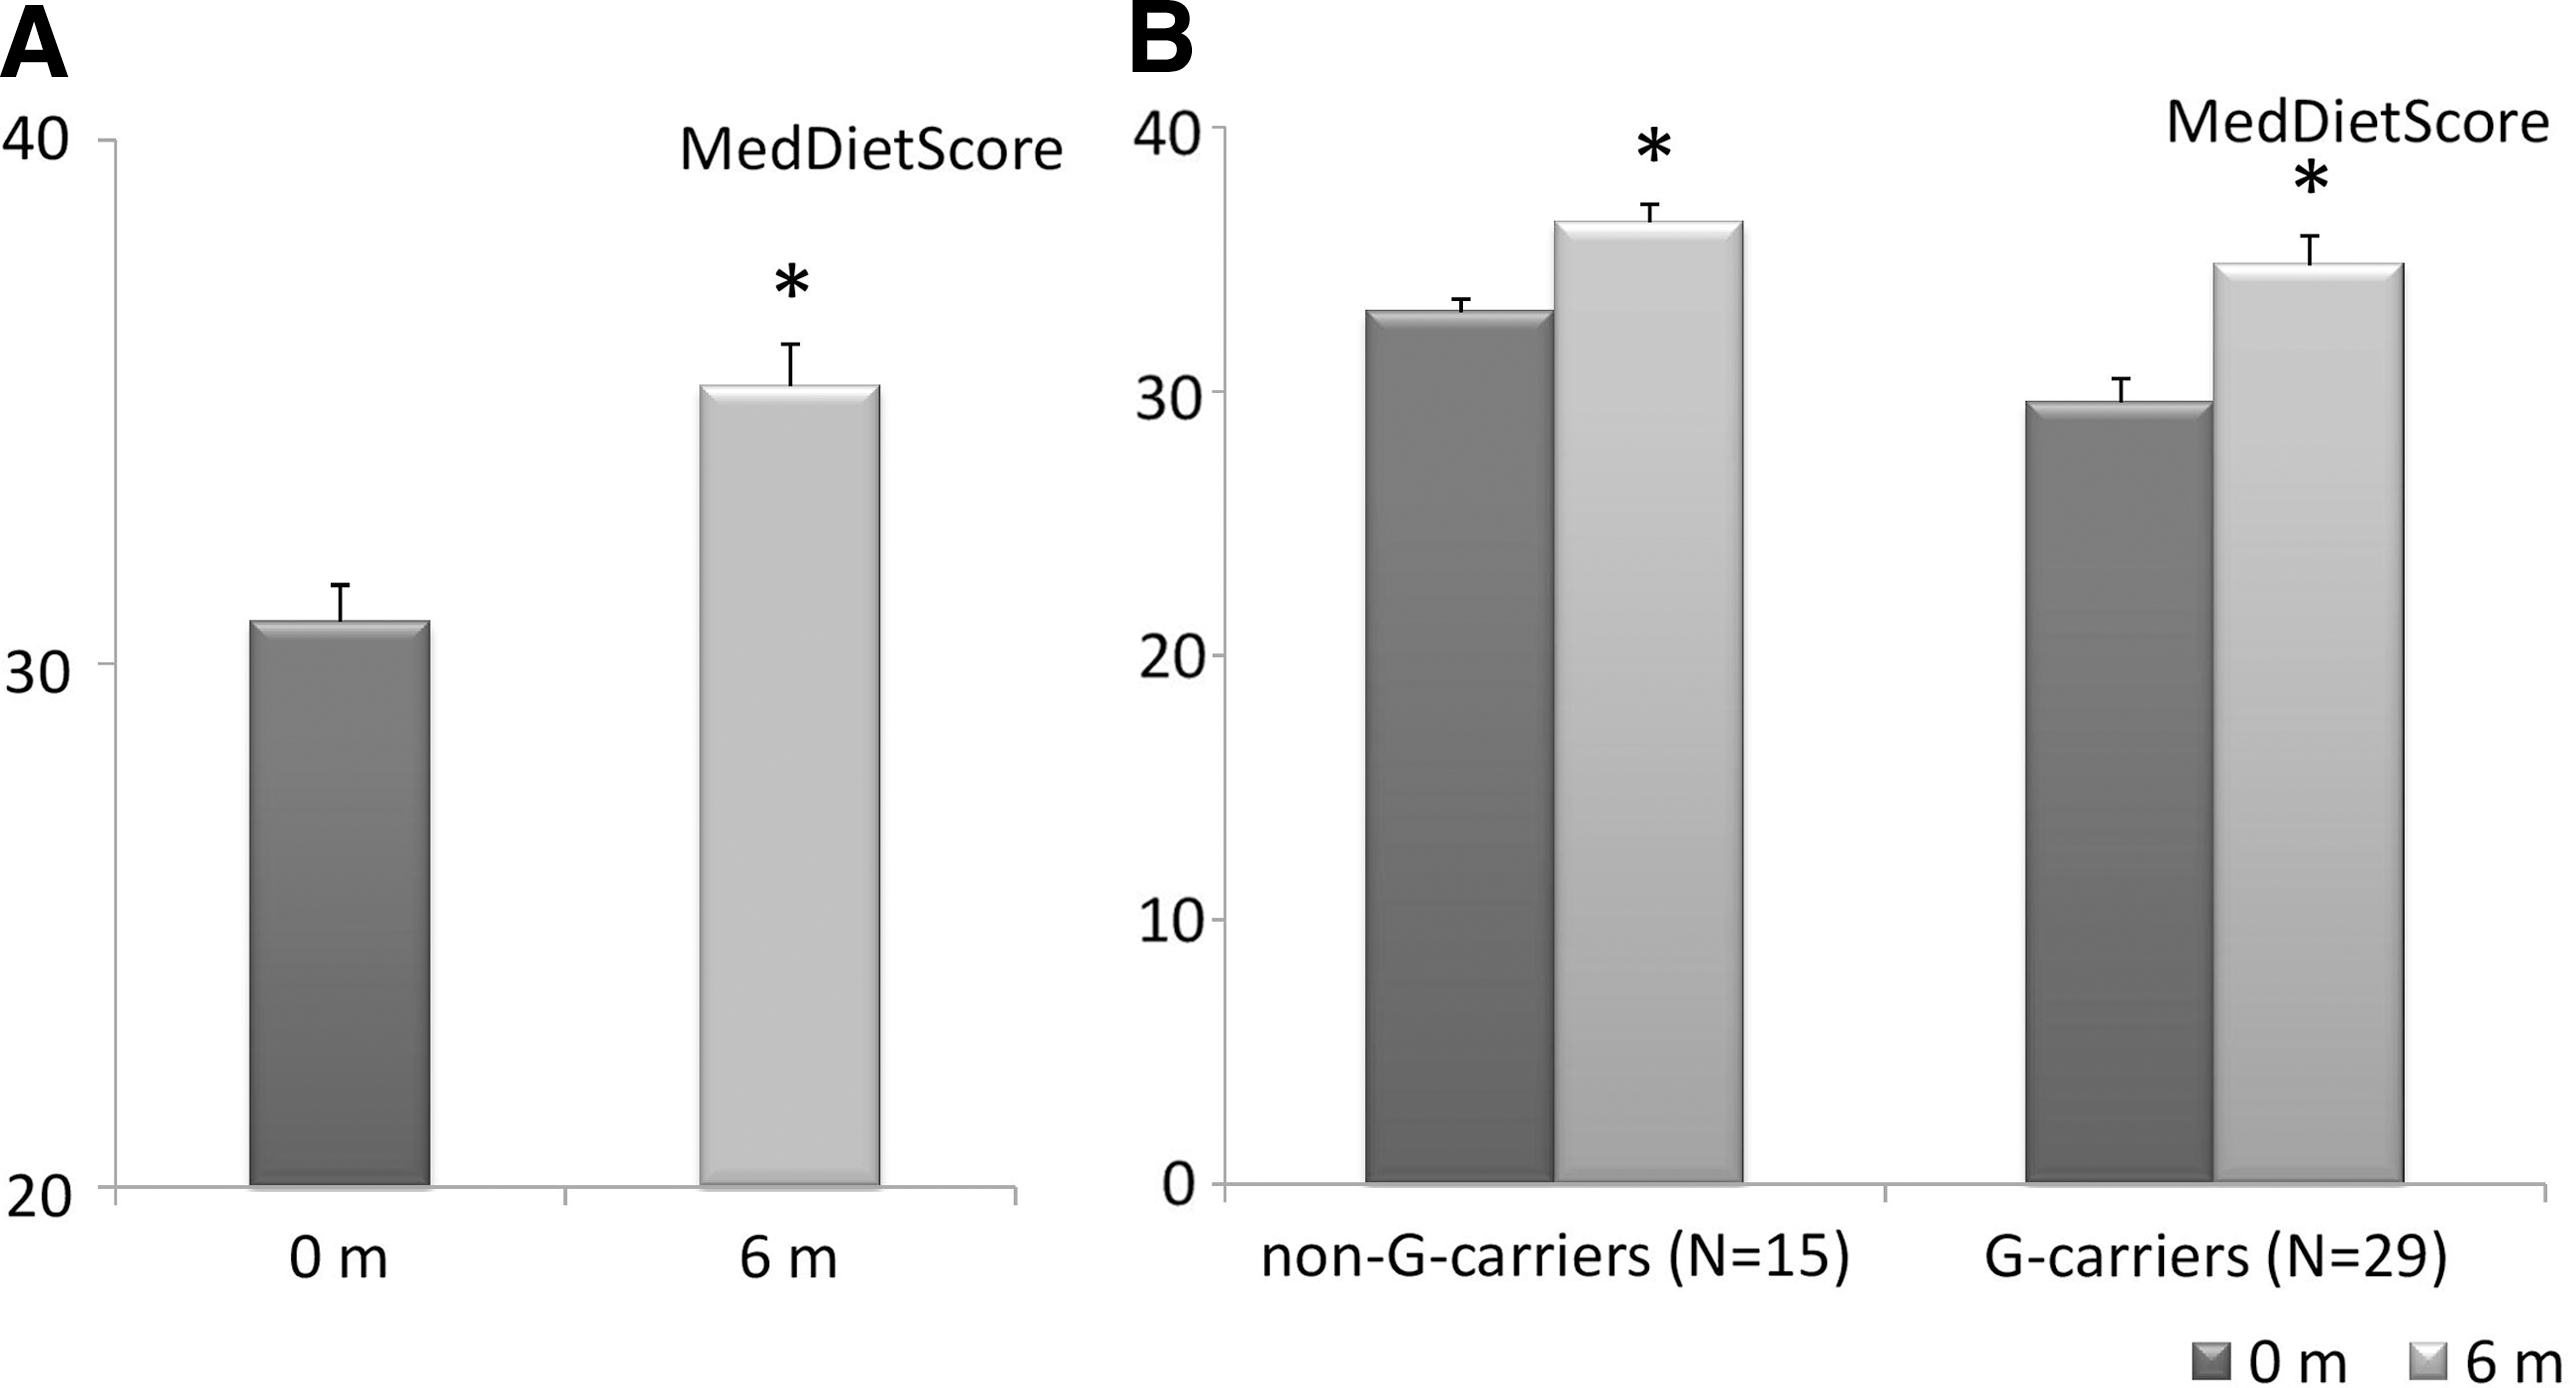
MedDietScore values at the beginning (0 months) and the endpoint of the trial (6 months):
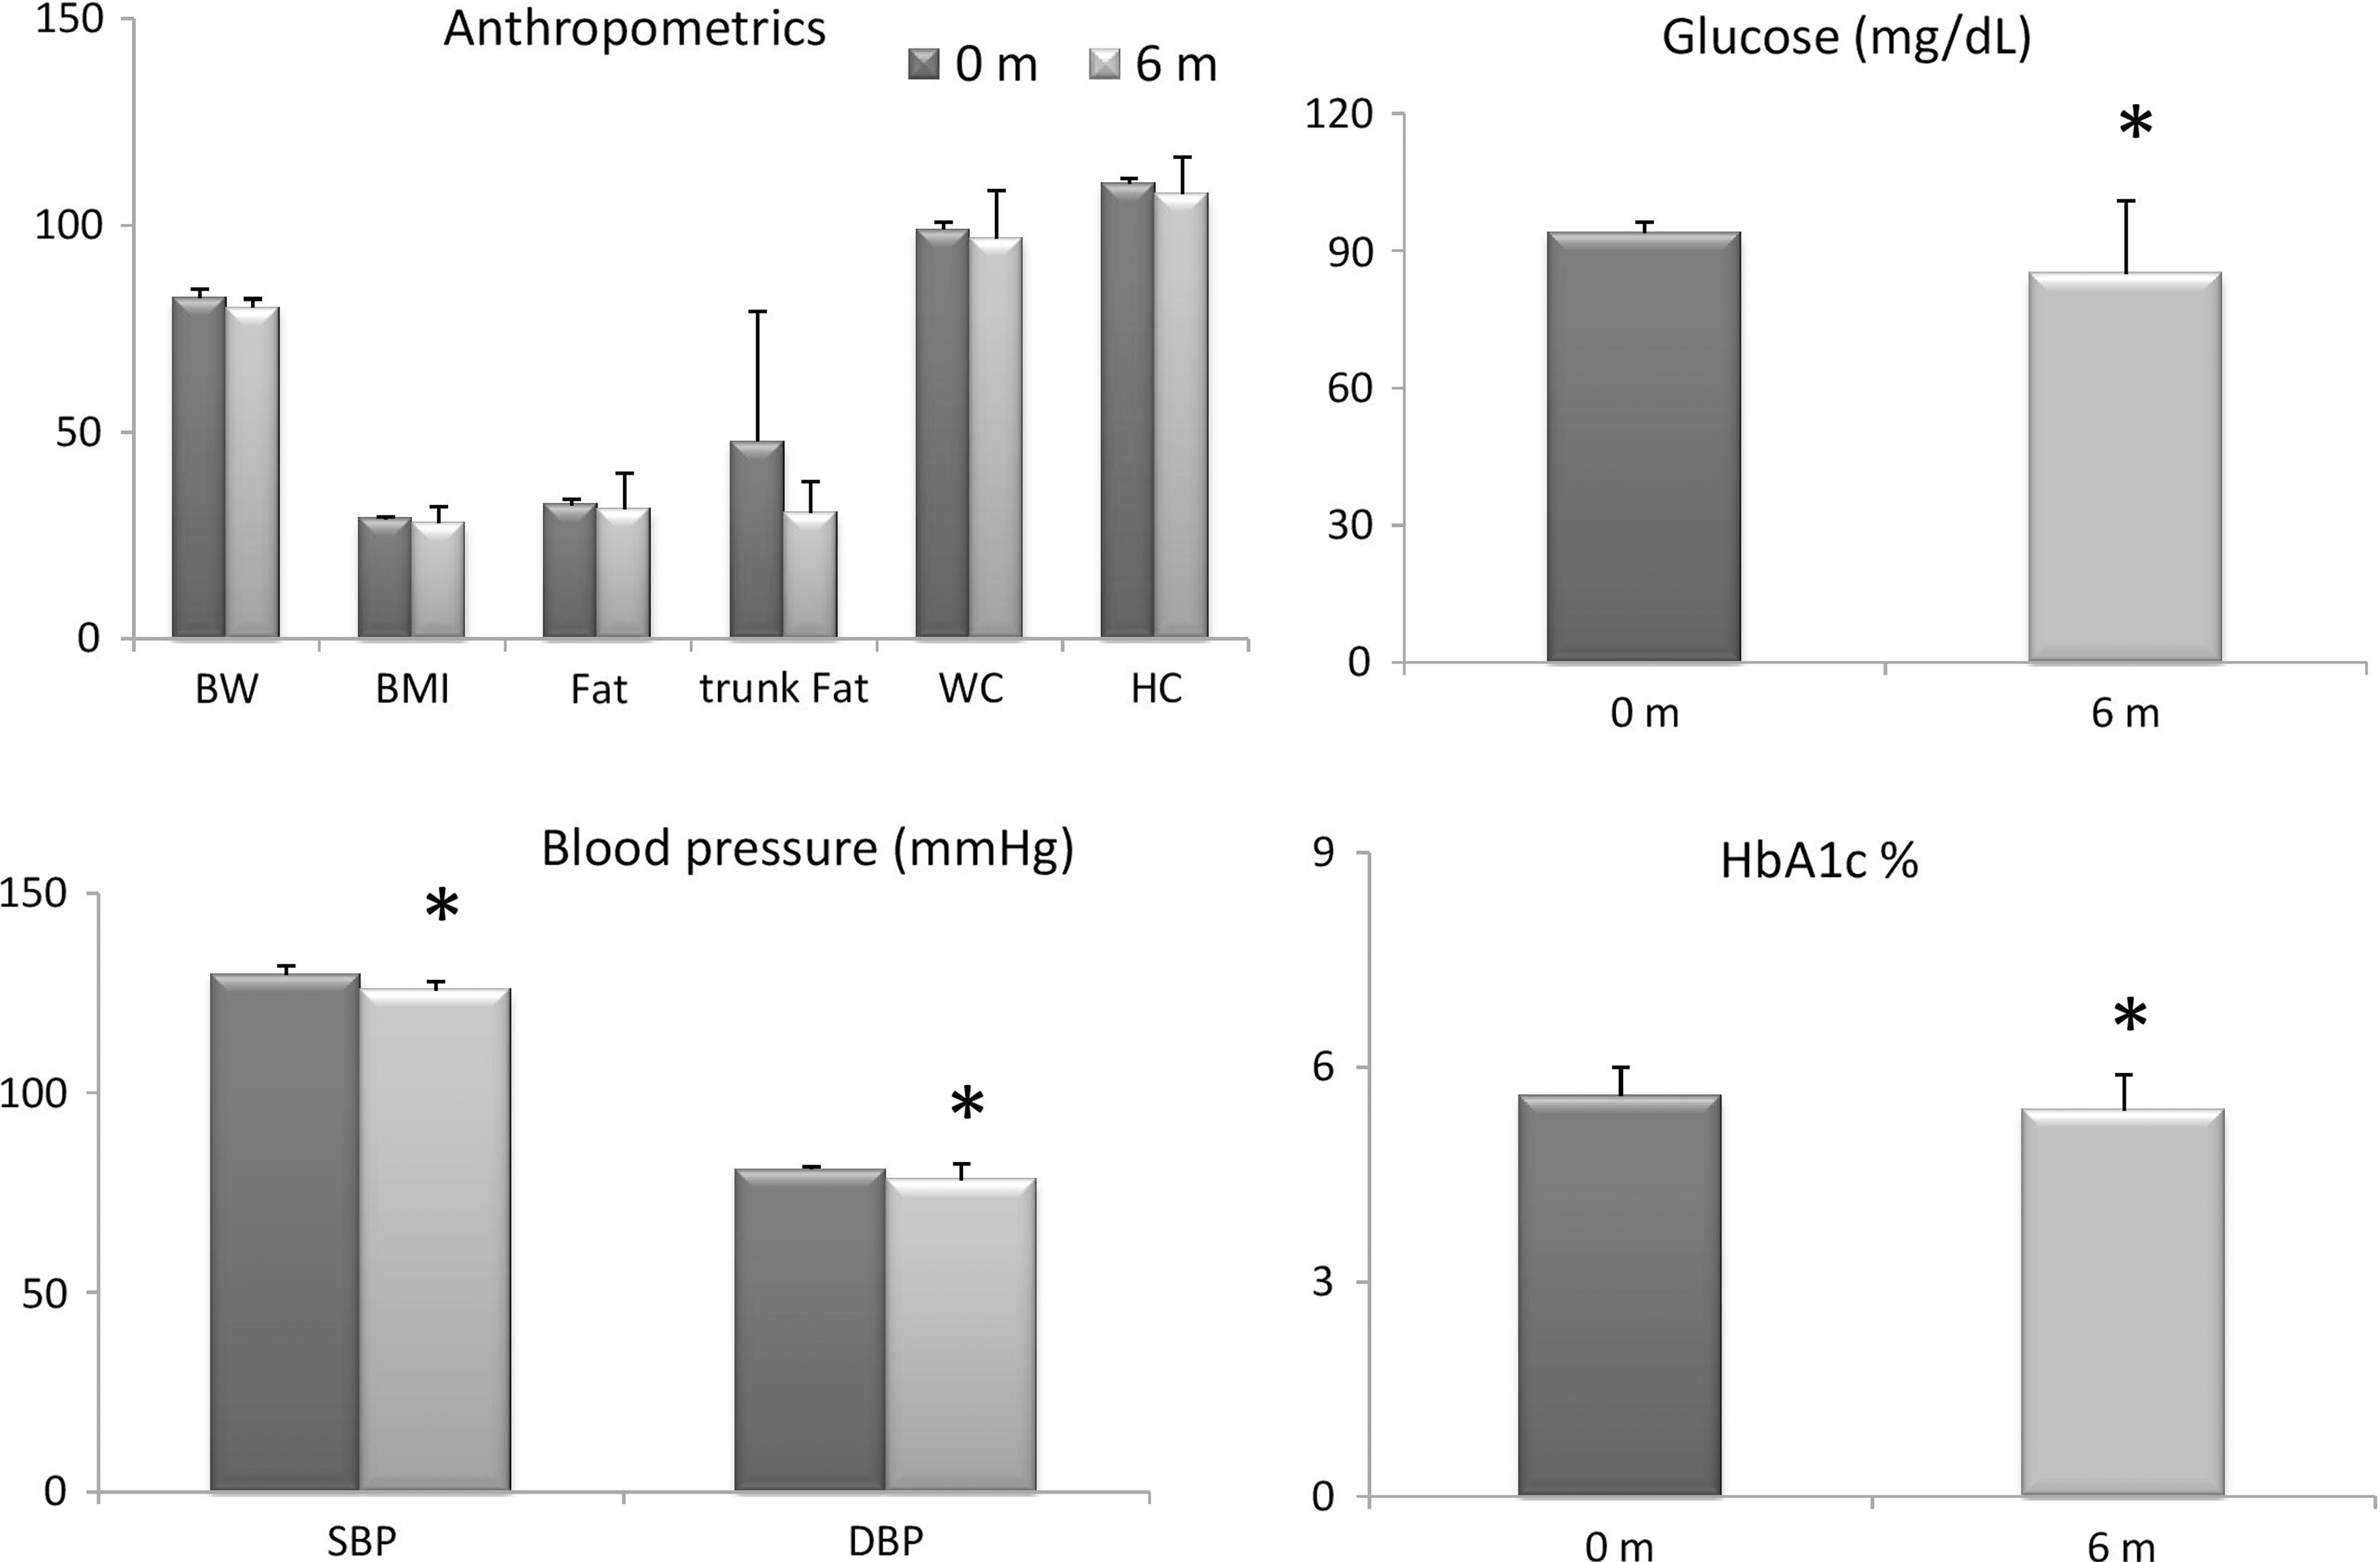
Anthropometrics and biochemical indices at the beginning (0 months) and the endpoint of the trial (6 months) for all 44 NAFLD patients. Data are given as mean ± SD; P values: comparison with the baseline values by *the paired samples t test or the Wilcoxon test. Level of significance was set at P < .05. BMI, body mass index; BW, body weight; DBP, diastolic blood pressure; HbA1c, glycated hemoglobin; HC, hip circumference; SBP, systolic blood pressure; WC, waist circumference.
In Figure 4, changes in CRP, visfatin, and oxLDL levels are presented. They were all significantly reduced at the end of the trial (2537.7 ± 2732.3 ng/mL vs. 833.7 ± 897.6 ng/mL, P < .0001; 9.0 ± 4.2 ng/mL vs. 7.6 ± 4.1 ng/mL, P = .022 and 131.9 ± 28.4 U/L vs. 120.5 ± 30.2 U/L, P < .030, respectively), but levels of leptin remained unchanged (80.1 ± 67.6 ng/mL vs. 69.8 ± 60.9 ng/mL, P = .192). In our sample of nonfibrotic NAFLD patients, systemic levels of IL-6 and TNF-α did not alter (1.6 ± 2.5 pg/mL vs. 1.1 ± 1.1 pg/mL, P = .131; 1.1 ± 0.9 pg/mL vs. 1.0 ± 0.9 pg/mL, P = .653, respectively).
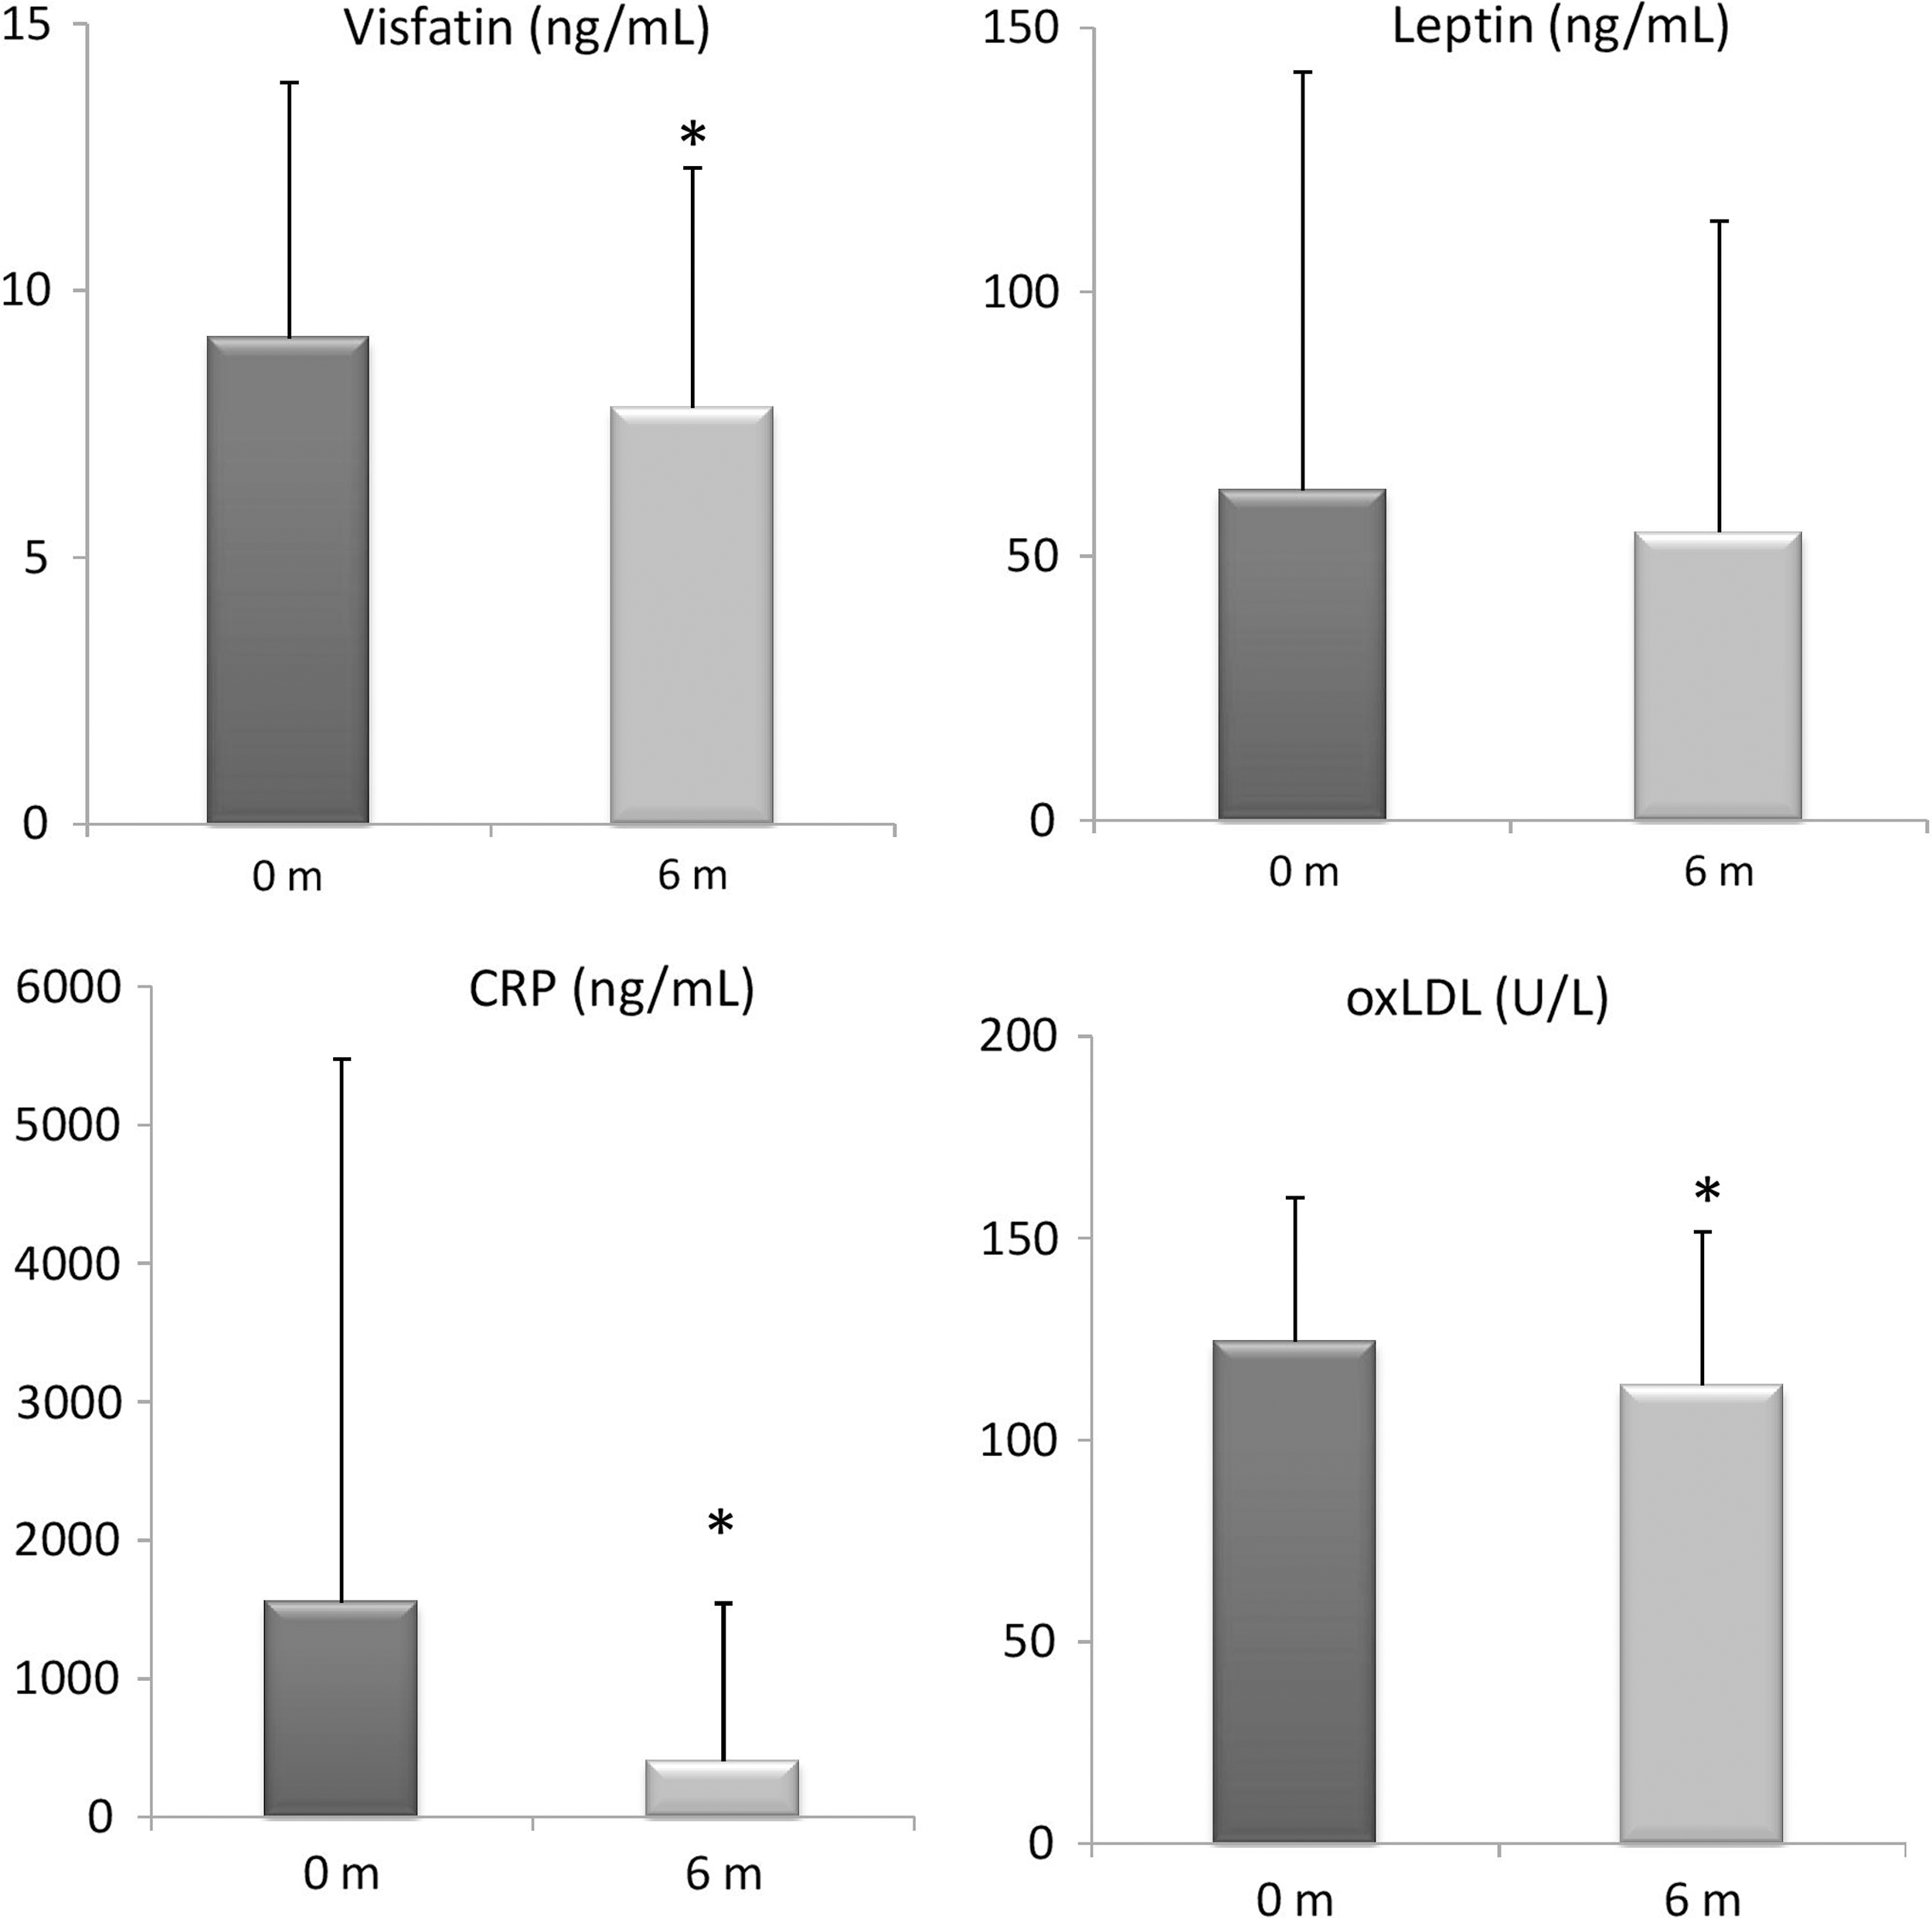
Inflammatory indices at the beginning (0 months) and the endpoint of the trial (6 months) for all 44 NAFLD patients. Data are given as mean ± standard deviation (SD); P values: comparison with the baseline values by *the paired samples t test or the Wilcoxon test. Level of significance was set at P < .05. CRP, C-reactive protein; oxLDL, oxidized low-density lipoprotein.
The effect of Mediterranean Diet according to STAT3 rs2293152 genotype
For further analysis, the sample was split into two groups according to their STAT3 rs2293152 genotype: the G (risk)-allele carriers and the non-G-carriers. Overall, G-carriers constituted 65.9% of the sample and as presented in Tables 2 and 3, G-carriers experienced more beneficial changes than the non-G-carriers at the end of the 6-month trial compared with baseline.
Anthropometrics of Non G-Carriers and G-Carriers at Baseline and After 6 Months of Nutritional Counseling
Data are given as mean ± SD.
P values: comparison with the baseline values by *the paired samples t test or # the Wilcoxon test; last column: comparison of mean differences between groups (6-0 months) by *independent samples t test or #Mann–Whitney U test; level of significance was set at P < .05 (given in bold).
Clinical and Biochemical Indices of Non-G-Carriers and G-Carriers at Baseline and After 6 Months of Nutritional Counseling
Data are given as mean ± SD.
P values: comparison with the baseline values by *the paired samples t test or #the Wilcoxon test; last column: comparison of mean differences between groups (6-0 months) by *independent samples t test or #Mann–Whitney U test; level of significance was set at P < .05 (given in bold).
As given in Figure 2, G- and non-G-carriers increased both their MedDietScore compared with baseline (33.0 ± 1.9 vs. 36.4 ± 2.6, P = .011 and 29.6 ± 4.8 vs. 34.8 ± 6.0, P < .000, respectively) and decreased BW, BMI, ultrasound result, HbA1c, and SBP (Tables 2 and 3). A significant reduction in albumin levels was observed in both groups, but was not considered of clinical significance. Body fat percentage, WC, HC, EUS, NFS, and fasting glucose levels were significantly ameliorated in the G-carrier group (Tables 2 and 3). According to Figure 5, reductions in CRP and leptin levels were observed only in the G-carrier group compared with baseline (2787.1 ± 2877.1 ng/mL vs. 881.6 ± 954.9 ng/mL, P = .001 and 90.6 ± 78.7 ng/mL vs. 73.9 ± 71.9 ng/mL, P = .011, respectively), whereas visfatin concentration was decreased only in the non-G-carriers (10.9 ± 4.6 ng/mL vs. 6.6 ± 5.0 ng/mL, P = .001). Levels of IL-6, TNF-α, or oxLDL did not change for both groups (Supplementary Table S2).
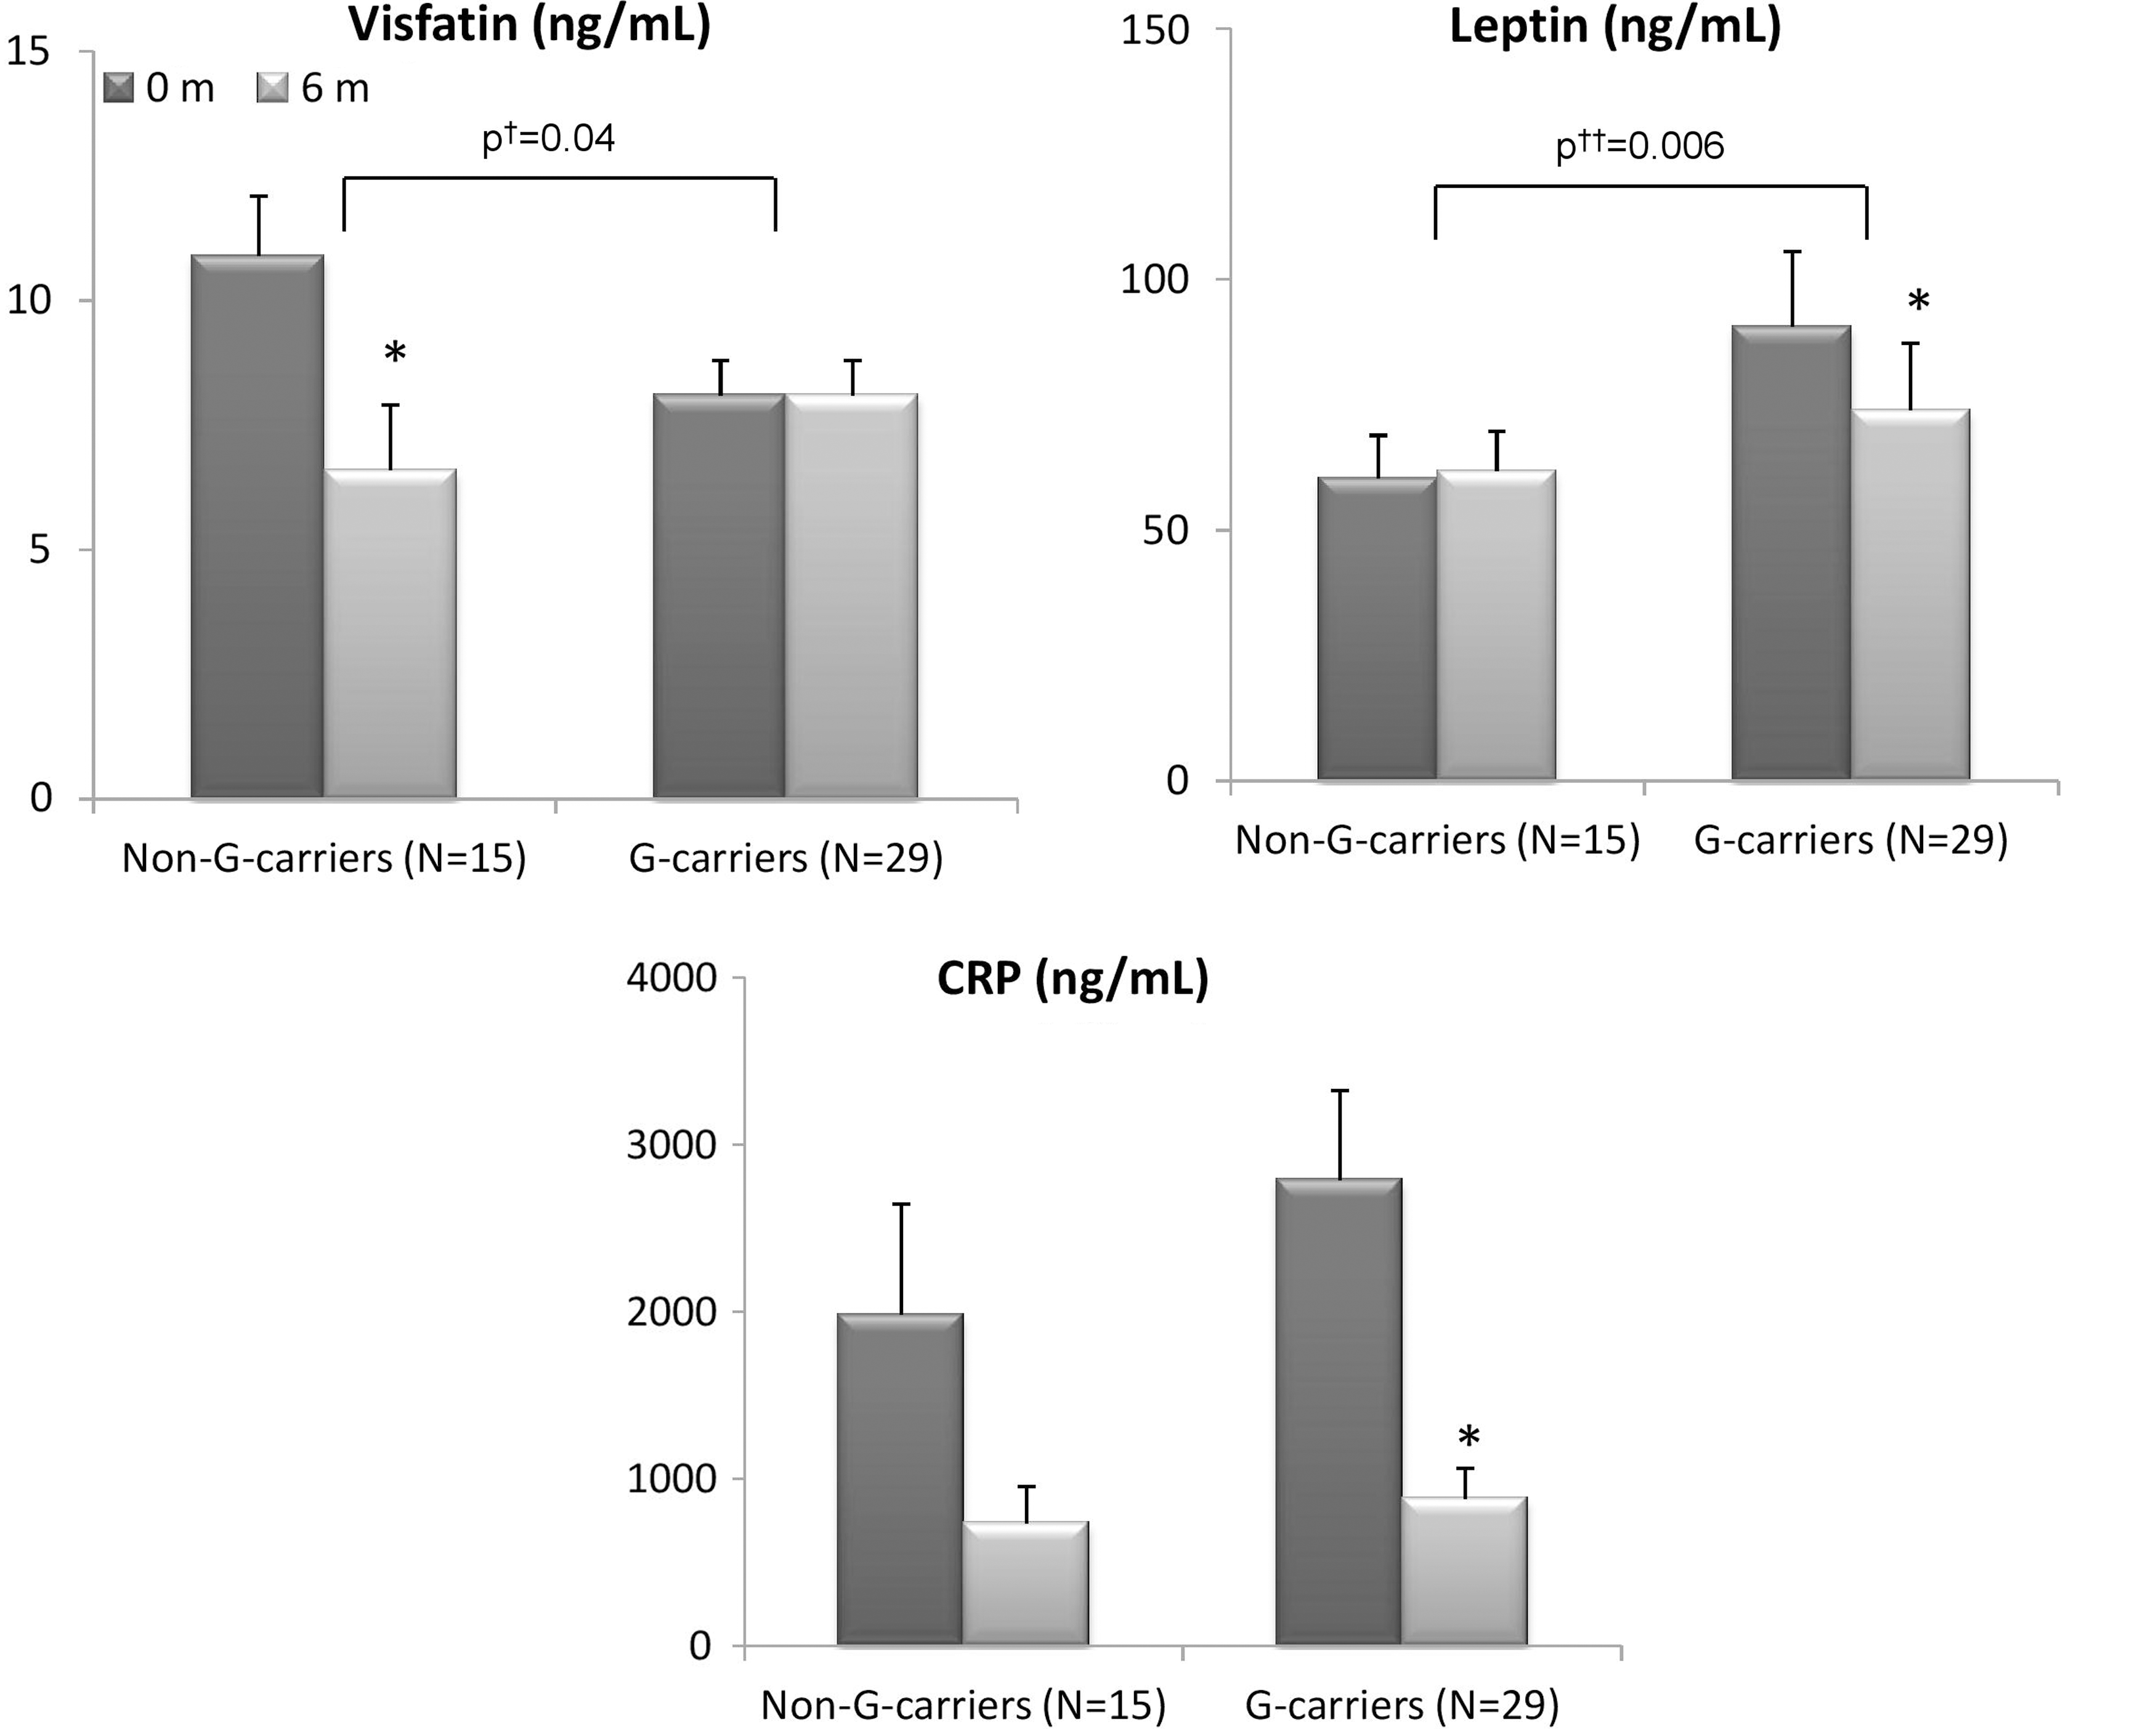
Inflammatory indices at the beginning (0 months) and the endpoint of the trial (6 months) for non-G- and G (risk)-allele carriers; data are given as mean ± standard deviation (SD); P values: comparison with the baseline values by *the paired samples t test or the Wilcoxon test. P † value, comparison of mean differences between groups (6-0 months) by independent samples t test; P †† value, comparison of mean differences between groups (6-0 months) by Mann–Whitney U test. Level of significance was set at <.05.
When comparing the differences of mean(6-0)m changes of all aforementioned anthropometric and clinical traits between the two genotype groups, only visfatin and leptin changes were found significantly different between the groups (P = .04 and P = .006, respectively) (Fig. 5). At the completion of the trial, visfatin levels were not altered in the G-carriers but were significantly ameliorated in the non-G-carrier group (mean difference = −4.2 ± 3.9 ng/mL vs. −0.0 ± 4.6 ng/mL, P = .04, respectively). On the contrary, leptin concentration was significantly decreased in G-carriers, whereas no changes were detected for the non-G-carrier group (mean difference +1.5 ± 22.2 ng/mL vs. −15.4 ± 32.3 ng/mL, P = .006, respectively). However, after adjusting for the main confounding factors age, gender, and BMI(6-0)m change, carrying the risk allele was associated with a 3.4 ± 1.5 ng/mL increase of visfatin levels (P = .028). No significant association was found between the G-allele and the decrease of leptin levels (P = .181) (Table 4).
Multiple Linear Regression Models for the Association of rs229315 G-Carriers with Visfatin and Leptin Change After a 6-Month Nutritional Counseling Period
Data are given as mean ± SD.
Model is adjusted for age, gender, and BMI(6-0)m change.
Level of significance was set at P < .05 (given in bold).
SE, standard error.
Discussion
In this study, a 6-month adherence to the MedDiet resulted in significant amelioration of NAFLD-related biomarkers in 44 no steatosis NAFLD patients. In addition, STAT3 rs2293152 G-allele carriers showed a different response in MedDiet as regards visfatin levels compared with the noncarriers at the end of the trial, indicative of a nutrigenetic effect of this intervention. All NAFLD patients enrolled increased MedDietScore (P < .0001), reduced BW by almost 3% (P < .0001), reduced WC and HC (P < .05), and improved body fat composition (P < .05). No changes in liver enzyme levels were observed, which however are not sensitive for the diagnosis of NAFLD and may not be found elevated in patients with NAFLD. Diet is considered a potent environmental contributor to NAFLD. 20 Not only the energy consumed but also diet composition is determinant for the development and progression of NAFLD. Diets rich in saturated fat, cholesterol, and low in polyunsaturated fat, fiber, and antioxidant vitamins C and E have been associated with NASH. 20 On the contrary, MedDiet has been associated with a reduction of steatosis, of insulin resistance, and reduced iron stores. 21,22 In this study, energy restriction did not reach statistical significance (P > .05), but the amount of saturated fat and crude fiber consumed at the end of the trial were significantly improved in all subjects compared with baseline (P < .05) (Supplementary Table S3). The significant change in BMI is indicative of the profound role of MedDiet in NAFLD patients after the dietary intervention. Oxidative stress has been recognized as the main contributor to hepatocyte injury and NAFLD progression. 23 NAFLD patients are expected to have a higher risk of cardiovascular diseases, with LDL oxidation in arterial walls playing a key role in atherogenesis. 24 –26 Oxidative stress markers are elevated in NAFLD and NASH and oxidative stress has been correlated with the levels of NASH activity markers. 27,28 Herein elevated oxidative stress expressed as high oxLDL levels was reported in patients at baseline; however, adherence to MedDiet resulted in significant amelioration (P < .05).
CRP is often used as an independent predictor of cardiovascular events. 29 –31 In a recent meta-analysis of 17 enrolled randomized controlled trials, adoption of a healthier dietary pattern was associated with significant reduction in CRP. 32 A correlation between CRP and NAFLD has been reported. 33 –35 In this study, all enrolled participants responded to nutritional counseling by decreasing CRP levels by 73.9% (P < .0001). Despite the decrease in CRP in our sample of nonfibrotic NAFLD patients systemic levels of leptin, IL-6, and TNF-α did not alter (P > .05). Systemic levels of proinflammatory proteins are found increased in NASH and are increasing in accordance with disease severity. 36,37 The effect of MedDiet in inflammatory markers in NAFLD is evident in some trials, whereas in others it is not. 20 On the contrary, concentration of visfatin, a hormone whose plasma levels are associated with obesity, type 2 diabetes mellitus, and metabolic syndrome, 38,39 was significantly improved (P < .05). All the above-mentioned observations were accompanied by amelioration of liver imaging and fibrosis score (P < .05) and these results indicate that adopting MedDiet could have a beneficial outcome in the NAFLD phenotype.
Association of STAT3 polymorphism with diet composition and NAFLD features
Genetic factors, such as STAT polymorphisms may influence liver disease progression. STAT proteins play pivotal roles in cytokine signaling pathways and are involved in regulating cell growth and differentiation. Among STAT members, STAT3 is closely associated to NAFLD and progression to HCC. 13,40 The gene encoding STAT3 is located on chromosomal region 17q21, whereas the STAT3 rs2293152 G-allele is considered as a risk allele for NAFLD development and progression. The STAT3 rs2293152 G-allele frequency in Europeans is 40%, 41 whereas in our sample it was 65.9%.
As expected, 12 G-carriers experienced more beneficial changes at the end of the intervention compared with baseline; however, the results of this study showed no association of STAT3 polymorphism with diet composition, obesity, and glucose-related traits. Both G-carriers and non-G-carriers increased significantly their adherence to MedDiet, the difference in increase was however insignificant at follow-up (Supplementary Table S4). Patients carrying the risk allele experienced a significant decrease in saturated fatty acid (SFA) intake, whereas the non-G carriers showed no significant change (Supplementary Table S3). High dietary SFA intake magnifies the genetic predisposition to abdominal obesity and individuals with certain STAT3 genotypes are more sensitive to SFA, thus they benefit more from dietary manipulation to reduce dietary SFA intake. 42 The highest SFA consumption has been found to increase the risk of abdominal obesity by 32% in patients with more than two STAT3 risk allele carriers compared with those carrying one or fewer risk alleles. On the contrary, a dietary MUFA or PUFA composition does not modulate the genetic susceptibility to abdominal obesity, suggesting a modulating role for SFA and a novel gene–diet interaction for STAT3 polymorphisms and SFA. 42 Herein, although no significant association between genotype and changes in anthropometric characteristics is recorded, most probably because of the low number of participants, modulated anthropometric characteristics are observed in G-carriers who also had significantly decreased SFA intake.
When comparing the mean changes in circulating CRP, IL-6, TNF-α, and oxLDL between G- and C-carriers after the 6-month intervention, no significant difference was reported. However, we found a significant association between the genotype and visfatin levels. The mean difference of visfatin levels at the endpoint of the trial was significantly lower in C-carriers compared with the risk allele carriers (P < .05). The C-carriers responded to the healthier eating plan by lowering visfatin concentration by 39.4% (P < .05) compared with baseline. In fact, multivariate linear regression analysis showed that carrying the G-allele was associated with a 3.4 ng/dL (±1.5) increase of visfatin levels, after adjusting for age, gender, and BMI change at the end of intervention (P < .05). No association was detected between the polymorphism and changes in leptin levels (P > .05), although a significant amelioration was observed in the risk allele group at the endpoint of the intervention compared with C-carriers. STAT3 gene variants have been shown to correlate with dietary fat intake, anthropometric indices, blood lipid profile, and insulin resistance, but with conflicting outcomes. 42 –44 In addition, STAT3 gene polymorphisms have been associated with susceptibility to various autoimmune diseases in different ethnic groups. 45 –50 However, there is no study elaborating on the associations between STAT3 gene variants and NAFLD-related markers. To the best of our knowledge, this is the first study to report an association between STAT3 rs2293152 and visfatin levels in response to increase in MedDiet adherence in nonfibrotic NAFLD patients. As regards the nutrigenetic affect investigated, sample size is a major limitation of this study and larger cohort studies need to be conducted to make safe conclusions about the associations between NAFLD-related SNPs and metabolic and inflammatory profile.
The main outcome of this nonrandomized and open-label, 24-week prospective intervention trial was that higher adherence to MedDiet exhibited beneficial effects in NAFLD patients. Diet composition, anthropometric indices, clinical and biochemical markers, and inflammatory mediators were improved, whereas liver imaging was significantly ameliorated in response to nutritional counseling. With reference to STAT3 rs2293152 genotype, risk-allele carriers experienced more beneficial changes at the end of the intervention compared with the baseline, but this was not associated with diet composition. Nevertheless, comparisons of mean differences between G- and C-carriers at the endpoint of the trial showed that only visfatin was significantly associated with the STAT3 genotype and carrying the G-allele was associated with an increase of the visfatin levels. Our work generates an important finding in the field of nutrigenetics. Despite this important finding in the field of nutrigenetics, it is tricky to generalize this effect unless larger studies are conducted.
Ethical Standards
The study was approved by the Ethics Committees of both Harokopio University of Athens and General Hospital of Athens “Laiko,” based on the Declaration of Helsinki. Upon its completion, the trial has been registered in
Footnotes
Acknowledgments
I.P.K. and G.V.D. were funded by “Research Project for Excellence IKY/SIEMENS.” This study was partially funded by the “Obesity and metabolic syndrome: dietary intervention with Greek raisins in NAFLD/NASH. Investigation of molecular mechanisms” reviewed and approved by the Greek Secretariat for Research and Technology (Cooperation 890/2009). In addition, this study was reviewed by Harokopio University and Laiko General Hospital, Athens University Medical School Institutional Review Boards.
Authors' Contributions
A.C.K. and G.V.D. had the concept and designed this study; A.C.K., A.K., and G.V.D. coordinated the study. A.G., A.D., and I.P.K. collected, analyzed, and interpreted the data; I.P.K. and A.G. undertook the statistical analysis; A.C.K. and A.G. drafted the article. All authors reviewed and commented on subsequent drafts of the article.
Author Disclosure Statement
There are no conflicts to declare.
Supplementary Material
Supplementary Table S1
Supplementary Table S2
Supplementary Table S3
Supplementary Table S4
References
Supplementary Material
Please find the following supplemental material available below.
For Open Access articles published under a Creative Commons License, all supplemental material carries the same license as the article it is associated with.
For non-Open Access articles published, all supplemental material carries a non-exclusive license, and permission requests for re-use of supplemental material or any part of supplemental material shall be sent directly to the copyright owner as specified in the copyright notice associated with the article.
