
Abstract
In this study, we investigated the antioxidant and protective effect of Lindera glauca stem (LGS) extracts against oxidative stress. We compared antioxidant properties of water extract (LGSW) with ethanol extract (LGSE) by determining the contents responsible for antioxidant activities such as polyphenols and flavonoids. Antioxidant properties were also determined by 2,2′-azinobis-(3-ethylbenzothiazoline-6-sulfonic acid) (ABTS) radical scavenging activity and ferric reducing antioxidant power (FRAP). Lipid peroxidation was estimated using ferric thiocyanate (FTC) and thiobarbituric acid (TBA) method. Both LGSW and LGSE strongly inhibited lipid peroxidation. Especially, LGSE showed a protective effect through increasing cell viability, decreasing intracellular reactive oxygen species (ROS) against tert-butyl hydroperoxide-induced oxidative stress in Chang cells. Furthermore, LGSE increased antioxidant related enzyme activities such as catalase, glutathione S-transferase, glutathione peroxidase, and superoxide dismutase gene expression against oxidative stress in a zebrafish model. Our findings suggest that LGSE could be useful for developing potential therapeutic agents with protective effects against oxidative stress.
Introduction
L
Previous phytochemical studies on L. glauca have determined the isolation and characterization of few compounds, including five alkaloids, (+)-3-chloro-N-formylnornantenine, (+)-N-formylnornantenine, (+)-norboldinelo, (−)-norboldine, and lysicamine; one butanolide, akolactone A; one benzenoid, methylparaben; one diterpene, phytol; one triterpene, squalene; and five steroids, β-sitosterol, β-sitostenone, stigmasta-4,22-dien-3-one, 6β-hydroxy-β-sitostenone, 6β-hydroxystigmasterone, and β-sitosteryl-D-glucoside, two aryl-tetralin lignan glycosides; linderanosides A and B, and one dihydrobenzofuran neolignan glycoside; linderanoside C. 4,5 Despite the long history of using L. glauca for folk medicine, the effects of L. glauca extracts have not been well studied, except for phytochemical studies. Hence, the purpose of this work was to investigate the antioxidant activities of L. glauca stem extract and protective effect against oxidative stress.
Reactive oxygen species (ROS) production at physiological levels is known to play a significant regulatory pivotal role in cell proliferation, differentiation, and metabolism. However, excessive ROS production can lead to damage of the cells, consequently affecting the onset and development of a variety of diseases such as inflammation, immune suppression, cardiovascular diseases, organ damage, and cancer. Oxidative stress means an imbalance of ROS production and cellular antioxidant defense systems. 6 It is widely known that oxidative stress from excessive ROS production contributes to the development of chronic disease. 7 Therefore, regulation of intracellular ROS is crucial to maintaining a healthy life, and antioxidant research has been important to find natural compounds with these properties.
Due to its physiological similarities with mammals, the zebrafish model has been commonly experimented on developmental biology, toxicology, drug, and genetics studies. 8 The zebrafish have many benefits, such as small size, fecundity, inexpensive, and rapid embryonic development. 9 For these reasons, zebrafish has been recently used in many areas of research, including oxidation stress studies, drug development, and toxicology research.
In this study, we proved antioxidant activities and protective effects of L. glauca stem extracts on tert-butyl hydroperoxide (t-BHP)-induced oxidative stress in Chang cells and zebrafish model. Therefore, this study not only provides evidence for the antioxidant activity of LGSE but also provides basic data on the antioxidative effect of LGSE against oxidative stress, which has not yet been studied.
Materials and Methods
Materials
2,2-diphenyl-1-picrylhydrazyl (DPPH), N-acetyl-L-cysteine (NAC), 5,5-dimethyl-1-pyrroline N-oxide (DMPO), (4-pyridyl-1-oxide)-N-tert-butylnitrone (4-POBN), 2,2-azobis(2-amidinopropane) hydrochloride (AAPH), Folin–Ciocalteau reagent, 2,2′-azino-bis(3-ethylbenzothiazoline-6-sulfonic acid) diammonium salt (ABTS), 6-hydroxy-2,5,7,8-tetramethylchroman-2-carboxylic acid (Trolox), 2,6-di-tert-butyl-4-methylphenol (BHT), rhodamine 123, 2,4,6-tris(2-pyridyl)-s-triazine (TPTZ), t-BHP, 2′,7-dichlorofluorescein diacetate (DCF-DA), propidium iodide (PI), and 3-(4,5-dimethylthiazol-2-yl)-2,5-diphenyltetrazolium bromide (MTT) were purchased from Sigma-Aldrich (St. Louis, MO, USA). Annexin V FITC Apoptosis Detection Kit was purchased from BD Biosciences (San Jose, CA, USA). L. glauca was obtained from Jecheon Hanbang Yakcho (Jecheon, Chungbuk, South Korea). Other reagents used in the experiment were the highest commercial grade reagents.
Preparation of Lindera glauca stem extracts
Lindera glauca stem (LGS) extracts were carried out by two extraction methods: water and 70% ethanol. The water extract was decocted for 1 h, and ethanol extract was prepared by refluxing 70% ethanol twice a day at room temperature (RT) and filtered with filter paper (Whatman No. 41). The filtrate was concentrated at 50°C using an evaporator (EYELA, Tokyo, Japan). The water and ethanol extracts were lyophilized using a freeze dryer to make powders for further works.
Determination of total polyphenol content
Total polyphenol content of LGS extract was measured using modified Folin–Ciocalteau assay. 10 Briefly, the test samples (200 μL) were mixed with 50% Folin–Ciocalteau reagent (100 μL), incubated at RT for 3 min, and added 20% sodium carbonate (Na2CO3, 300 μL). After incubating reaction mixture at RT for 30 min, the absorbance of mixtures was determined using an UV spectrophotometer (Thermo Scientific Multiskan GO, Thermo Scientific™, Waltham, MA, USA) at 700 nm. Total phenolic contents of LGS extracts were expressed as mg of gallic acid equivalents (GAE) per gram of sample.
Determination of total flavonoid content
Total flavonoid content of LGS extract was measured using the aluminum colorimetric method with minor modification. In brief, the test samples (150 μL) were mixed with 5% NaNO2 (45 μL) to react for 5 min. Then, 10% AlCl3 (90 μL) was added to reaction mixtures and incubated for 5 min at RT. Finally, 1 M NaOH (300 μL) and DW (165 μL) were added to the reaction mixtures and incubated for another 10 min at RT; the absorbance of mixtures was determined using an UV spectrophotometer at 510 nm. The total flavonoid contents were expressed as milligram catechin equivalents per gram of extract.
Various free radical scavenging activities
DPPH radical scavenging activity
The DPPH radical scavenging activity was determined using an electron spin resonance (ESR) spectrometer (JES-FA machine; JOEL, Tokyo, Japan). Various concentrations of each sample (60 μL) were mixed with DPPH solution (60 μL). The reaction mixtures were transferred to a Teflon capillary tube and loaded into the ESR spectrometer. The DPPH radical spectra were measured by ESR spectrometer after 2 min under the following conditions: central field, 3475G with a modulation frequency of 100 kHz. The modulation amplitude was set to 2G with a microwave power of 5mW; gain, 6.3 × 10 5 ; at a temperature of 298K.
Scavenging activity of alkyl radical
In this experiment, alkyl radicals were generated with AAPH. The reaction mixtures consist of phosphate-buffered saline (PBS, pH 7.4) with 40 mM AAPH and 40 mM 4-POBN, and the various concentrations of samples were incubated in a water bath at 37°C. After 30 min of incubation, the reaction mixture was transferred to a Teflon capillary tube. The spin adducts were determined using an ESR spectrometer. The measurement conditions of ESR spectrometer were the same as mentioned above.
Scavenging activity of hydroxyl radical
The hydroxyl radical (·OH) scavenging activity was determined using an ESR spectrometer. Spin trapping method using DMPO has been commonly utilized for measuring the hydroxyl radical scavenging activity of a sample, because it reacts with O-, N-, S-, and C-centered radicals. A reaction mixture containing different concentrations of the test samples (0.2 mL), 0.3 M DMPO (0.2 mL), 10 mM FeSO4 (0.2 mL), and 10 mM H2O2 (0.2 mL, pH 7.2) was transferred to a Teflon capillary tube. The ESR spectra were recorded after 2.5 min using an ESR spectrometer. Experiments were conducted under following conditions: central field of 3475G, a modulation frequency of 100 kHz, a modulation amplitude of 2G, a microwave power of 1 mW, and a temperature of 298 K.
Scavenging activity of ABTS radical
Total antioxidant activities of LGS water and ethanol extracts were measured using ABTS radical cations. The ABTS working solution was prepared by mixing the ABTS solution (7.4 mM) and potassium persulfate solution (2.4 mM) in equal quantities and allowing them to react overnight at RT in absence of light. 11
The generated radical cation solution diluted to be the absorbance at 734 nm is 1.50 ± 0.02. The antioxidant activity was determined after mixing of ABTS reagent (0.9 mL) with sample (0.1 mL) and incubating for 10 min at 734 nm. The ABTS radical scavenging activity of LGS extracts was expressed as Trolox equivalent antioxidant capacity (TEAC, mM Trolox eq./mg extract).
Ferric reducing antioxidant power assay
The ferric reducing antioxidant power (FRAP) assay was performed according to our previous publication. 12 Briefly, FRAP reagent (3 mL), made up with 300 mM of acetate buffer (pH 3.6), 10 mM of TPTZ (dissolved in 40 mM HCl), and 20 mM of FeCl3 (10:1:1 v/v/v), was combined with each LGS extract (1 mL), and then the absorbance was measured at 593 nm after 5 min of incubating at 37°C. The absorbance of the samples was compared to a FeSO4 standard curve, and the FRAP values were expressed as mM FeSO4 equivalent per mg extract.
Oxygen radical absorption capacity assay
Oxygen radical absorption capacity (ORAC) is one of the methods to measure the antioxidant capacity of biological samples in vitro. Fluorescein is the most commonly used fluorescent probe for ORAC assay now. We have performed with a minor modification of the ORAC method of Ou et al.
13
LGS extracts and Trolox solution were prepared using 75 mM of phosphate buffer (pH 7.4). A 50 μL of blank, extract, or Trolox standard was mixed with 78 nM fluorescein solution (50 μL) and incubated for 15 min at 37°C. Upon addition of 221 mM AAPH (25 μL), the fluorescence intensity was measured for about 120 min (excitation wavelength 485 nm, emission wavelength 535 nm) at 5 min time interval using a spectrofluorometer (SpectraMax M2/M2e, CA, USA). The final ORAC values of the LGS extracts were calculated by applying the net area under the decay curves (AUC) in the following formula and were expressed as μmol Trolox equivalent per milligram extract (μmol TE/mg extract).
Lipid peroxidation inhibition activity
Ferric thiocyanate method
The lipid peroxidation inhibitory activities of LGS extracts were evaluated using the ferric thiocyanate (FTC) method as previously performed by Kikuzaki and Nakatani. 14 A reaction solution was prepared by adding 1.0 mg/mL of LGS extracts (4.0 mL), 2.51% linoleic acid in ethanol (4.1 mL), phosphate buffer (0.05 M, pH 7.0, 8.0 mL), and distilled water (3.9 mL). The reaction solution was incubated in the dark at 40°C for 10 days. FTC was measured every 2 days by the following method with the reaction solution. Seventy five percent ethanol (9.7 mL) and 30% ammonium thiocyanate (0.1 mL) and the reaction solution (0.1 mL) were mixed. Then, 0.02 M ferrous chloride (in 3.5% HCl) (0.1 mL) was added, and the absorbance of the reaction mixture was determined at 500 nm. Vitamin C and vitamin E were used as positive controls, and the sample-free mixture was used as negative control.
Thiobarbituric acid assay
The slightly modified thiobarbituric acid (TBA) assay of Ottolenghi 15 was used to evaluate the lipid peroxidation inhibitory activities of LGS extracts. A reaction mixture was prepared by adding 20% trichloroacetic acid (TCA, 2.0 mL), 0.67% 2-thiobarbituric acid (TBA, 2.0 mL), and reaction solution (1.0 mL). This reaction mixture was boiled for 10 min and then cooled on ice. After centrifugation at 13,400 g for 15 min, the absorbance of the supernatant was measured at 532 nm. Vitamin C and vitamin E were used as positive controls, and the sample-free mixture was used as negative control.
Cell culture and cell viability
Chang liver cells were purchased from American Type Culture Collection (ATCC CCL-13™) and were maintained according to the manufacturer's protocol. In brief, the cells were maintained in DMEM containing 10% fetal bovine serum and antibiotics in a humidified incubator at 37°C supplied with 5% CO2. Effects of LGS extracts on the Chang cell viability were measured using MTT assay, which was used to study the normal metabolic status of cells based on mitochondrial activities. Chang liver cells were seeded in a 48-well plate at a concentration of 7.0 × 10 3 cells/well. After 24 h, different concentrations of Lindera glauca stem water extract (LGSW) and Lindera glauca stem ethanol extract (LGSE) were treated to the cells and further incubated for 1 h. Then, 100 μM of t-BHP was added and incubated for 24 h more. After removing of medium, 200 μL of MTT solution (0.2 mg/mL in DMEM) was added to the cells and further incubated for 2 h. The supernatants were removed, and the resulting formazan crystals in each well were dissolved in 200 μL of DMSO. One hundred fifty microliters of dissolved formazan crystals were transferred to a 96-well plate, and the absorbance was measured at 540 nm. Cell viability was expressed as percentages of the control.
Flow cytometric analysis of cell cycle
Cell cycle analysis was determined by quantitation of DNA content using PI staining. For flow cytometry analysis, the cells were collected after incubation with the treatments and washed twice with PBS buffer solution (pH 7.4). The resultant cells were fixed in fixing solution overnight and washed twice and further resuspended in PBS, which contains 50 μg/mL of PI solution and 5 μg/mL of ribonuclease A for 30 min. PI stained cells were analyzed by a flow cytometer (Becton & Dickinson Co., USA).
Intracellular ROS measurement
The Chang cells were seeded in a 96-well black plate at a concentration of 8 × 10 4 cells/well. After 24 h, cells were treated with various concentrations of LGSE or NAC for 1 h, then added 200 μM of t-BHP and further incubated for 30 min. Then, cells were further incubated with DCF-DA (5 μg/mL) for 30 min at 37°C in a dark environment. After washing the cells with cold PBS twice, the intracellular ROS was determined using a spectrofluorometer (excitation wavelength of 485 nm and emission wavelength of 535 nm).
Mitochondrial membrane potential measurement
The mitochondrial membrane potential (MMP) was determined using rhodamine123 (mitochondrial specific fluorescent dye). It is a cell-permeable cationic dye that selectively permeates into mitochondria based on the highly negative MMP. Depolarization of MMP causes loss of rhodamine123 in the mitochondria and reduces fluorescence intensity at intracellular space. 16 As described previously, the cells were pretreated with LGSE for 1 h and then treatment of t-BHP (100 μM) for 24 h. Rhodamine123 (10 μM) was added and further incubated at 37°C during half hour. Then, the cells were harvested and analyzed of MMP using flow cytometry.
Determination of apoptosis assay
The cells were seeded in six-well plate (1 × 10 5 /well) and, after 24 h, pretreated with LGSE (50, 100, and 200 μg/mL) for 1 h and then treated with t-BHP (100 μM) for 24 h. For apoptosis assay, the harvested cells were washed with PBS twice, suspended in binding buffer and double stained using Annexin V and PI solution for 15 min, and analyzed by flow cytometry.
Determination of morphological changes
As previously described, Chang cells were seeded in a six-well plate (1 × 10 5 cells/well) and incubated at 37°C under 5% CO2 for 24 h. Following 24 h incubation t-BHP (100 μM) with 1 h pretreatment of LGSE (50, 100, and 200 μg/mL), the morphologic alterations of the cells were observed by a phase-contrast microscope (Nikon, Japan). Images of changes in cell shape were taken at 200 × magnification.
Zebra fish model
Fish care and maintenance
Zebra fish were upheld on a 14-h light/10-h dark cycle in a temperature-controlled room. Fish tank temperature was maintained at 28°C, and water quality was monitored every day. Adult zebra fish were fed with a mixture containing brine shrimp and flake food twice daily. Animal experiments were conducted at the Konkuk University facility under the approval of the Institutional Animal Care and Use Committees (KU17159).
Sample exposure
Nine females and nine males of zebra fish were used for breeding. The embryos obtained post-spawning were staged and maintained in embryo media (included with 60 mg/L of sea salt). We divided five groups as follows: control group, damage group (t-BHP, 1 mM), low-dose LGSE (50 μg/mL) group, high-dose LGSE (100 μg/mL) group, and positive control (NAC, 100 μM) group, and each group contained 40 embryos. At 48 h postfertilization (hpf), the embryos and larvae were pretreated with LGSE or NAC for 1 h and then treated with the t-BHP for 24 h to measure changes in antioxidant related genes.
RNA isolation and reverse transcription
At 72 hpf, the RNA from zebra fish embryos was isolated to examine expression of antioxidant related response genes. Briefly, about 30 embryos were collected from each group, and RNA was isolated. RNA concentration of each group was quantified using a μDrop spectrophotometer (Thermo Fisher Scientific), and 2500 ng of RNA was reverse transcribed to cDNA using the cDNA Reverse Transcription Kit (Thermo Fisher Scientific). The synthesized cDNA was kept at −20°C until use.
Quantitative real-time PCR
Quantitative PCR analyses of various genes were performed using a LightCycler qPCR system (Roche Diagnostics, Meylan, France). The PCR volumes were 20 μL, containing 10 μL of 2 × qPCRmix (Bio-Rad), 6 μL of DEPC-treated water, 2 μL of each primer, and 2 μL of cDNA template. The primers used in this study are shown in Table 1. Data were analyzed using the LightCycler software, and the fold changes for each gene expression were determined using the ΔΔCT method. Glyceraldehyde 3-phosphate dehydrogenase (GAPDH) was used as the housekeeping gene.
Sequences of Primers Used for Real-Time Polymerase Chain Reaction
Information from Reference. 28
On-line high-performance liquid chromatography-ABTS screening
The on-line high-performance liquid chromatography (HPLC)-ABTS screening was carried out using the method developed by Koleva et al. 17 with some modifications. LGS extracts (20 μL) were monitored using an Inspire C18 column (250 × 4.6 mm i.d., 5 μm particle size) on HPLC Waters 1525 series instrument with a diode array detector (DAD). The solvent A of the mobile phase was 0.1% acetic acid in water, and solvent B of the mobile phase was 100% acetonitrile. The gradient program of HPLC run was as follows: 100% of solvent A for 5 min, followed by 100% to 50% of solvent A for 35 min, to 100% of solvent B for 40 min and maintained 100% of solvent B at 45 min. Spectral data from all peaks were determined at a range of 200–800 nm, UV–Vis chromatograms were recorded at 254 nm, and the negative peaks (ABTS radical scavenging chromatogram) were measured by DAD at 734 nm.
Statistical analysis
All the experiments were carried out in triplicate. Statistical analysis was performed using analysis of variance (ANOVA) by Tukey's test (GraphPad Prism 5) to obtain the significant differences that exist among the evaluated samples (P < .05).
Results
Extraction yields, total polyphenol, and flavonoid contents of LGS extract
Table 2 shows the extraction yields of LGS extract. The extraction yields of LGSW and LGSE were 5.05% and 5.72%, respectively. The total polyphenol contents of LGSW and LGSE were 98.04 ± 0.89 mg GAE/g extract and 120.25 ± 1.30 mg GAE/g extract, respectively. Total flavonoid contents of LGSW and LGSE were reported to be 44.48 ± 0.44 mg GAE/g extract and 63.97 ± 2.35 mg GAE/g extract, respectively. Ethanol extract showed higher polyphenol content and flavonoid content compared with water extract.
Extraction Yields, Total Polyphenol, and Total Flavonoid Contents of the LGS Extracts
Values represent mean ± SD (n = 3)
GAE, gallic acid equivalents; CE, catechin equivalents;
Free radical scavenging activity by ESR measurements
The LGSW and LGSE both displayed similar DPPH radical scavenging activity, to be exact LGSW IC50 value was 11.920 ± 0.213 and LGSE IC50 value was 13.357 ± 0.312 μg/mL (Table 3). Inconsistent with above results, LGSW and LGSE both showed similar alkyl radical scavenging activities, resulting in IC50 values of 54.348 ± 2.124 μg/mL for LGSW and 56.716 ± 2.223 μg/mL for LGSE. The LGSW and LGSE showed high hydroxyl radical scavenging activities, respectively, where IC50 values were 4.436 ± 0.141 and 2.868 ± 0.124 mg/mL. These results indicate that LGS extracts have strong radical scavenging activities.
Various Radical Scavenging Activity (DPPH, Alkyl, and Hydroxyl) of the Lindera glauca Stem Extracts by Electron Spin Resonance Measurement
Values represent mean ± SD (n = 3).
ABTS radical scavenging activity
The ABTS scavenging activities of the LGS extracts were compared with the standard quantity of Trolox. The calculated results as TEAC value showed that LGSE has a higher TEAC value (0.932 ± 0.001 TEAC value) compared with LGSW (0.833 ± 0.003 TEAC value) (Table 4). These results showed that LGS extract has antioxidant activity with high TEAC value.
Values for ABTS Radical Scavenging, Ferric Reducing Antioxidant Power, and Oxygen Radical Antioxidant Capacity of the Lindera glauca Stem Extracts
Values represent mean ± SD (n = 3).
FRAP assay
The FRAP assay is one of the most widely used methods to measure antioxidant potential in samples using the reduction of ferric iron (Fe3+) to ferrous iron (Fe2+). The current results showed that LGSW (1.020 ± 0.031 mM FeSO4 eq./mg extract) and LGSE (1.169 ± 0.049 mM FeSO4 eq./mg extract) both have strong antioxidant powers (Table 4).
ORAC assay
Oxygen radical absorbance capacity of the LGS extract measured using the ORAC method was two times higher compared with BHT (positive control) (Table 4). The ORAC values obtained for LGSW and LGSE were similar and quantitatively they were 42.439 ± 0.165 μM TE/mg extract and 42.503 ± 0.414 μM TE/mg extract, respectively.
Lipid peroxidation inhibition activities
Lipid peroxidation inhibition activities of LGSW and LGSE were evaluated using FTC and TBA methods. The FTC method mainly measures the amount of peroxide in the early stages of lipid peroxidation. Low absorbance value in the FTC method indicates strong lipid peroxidation inhibitory activity. Control showed that lipid peroxidation was increased until sixth day in FTC method (Fig. 1A). The lipid peroxidation inhibition activities of LGSW and LGSE in this method were higher compared with vitamin C and vitamin E. In TBA method, formation of malondialdehyde is the basis for calculating the lipid peroxidation in the late stages. In the condition of low pH and high temperature (100°C), malondialdehydes and TBAs form red complexes and these can be evaluated at 532 nm. The increasing amount of these complexes is associated with the lipid peroxidation. The blank control showed highest absorbance value on the eighth day, and LGSW and LGSE exhibited significant antioxidant activities compared to vitamin C and vitamin E (Fig. 1B) on the same day. Therefore, the lipid peroxidation inhibition activities of LGSW and LGSE were found to be superior to those of vitamin C and E in both methods.
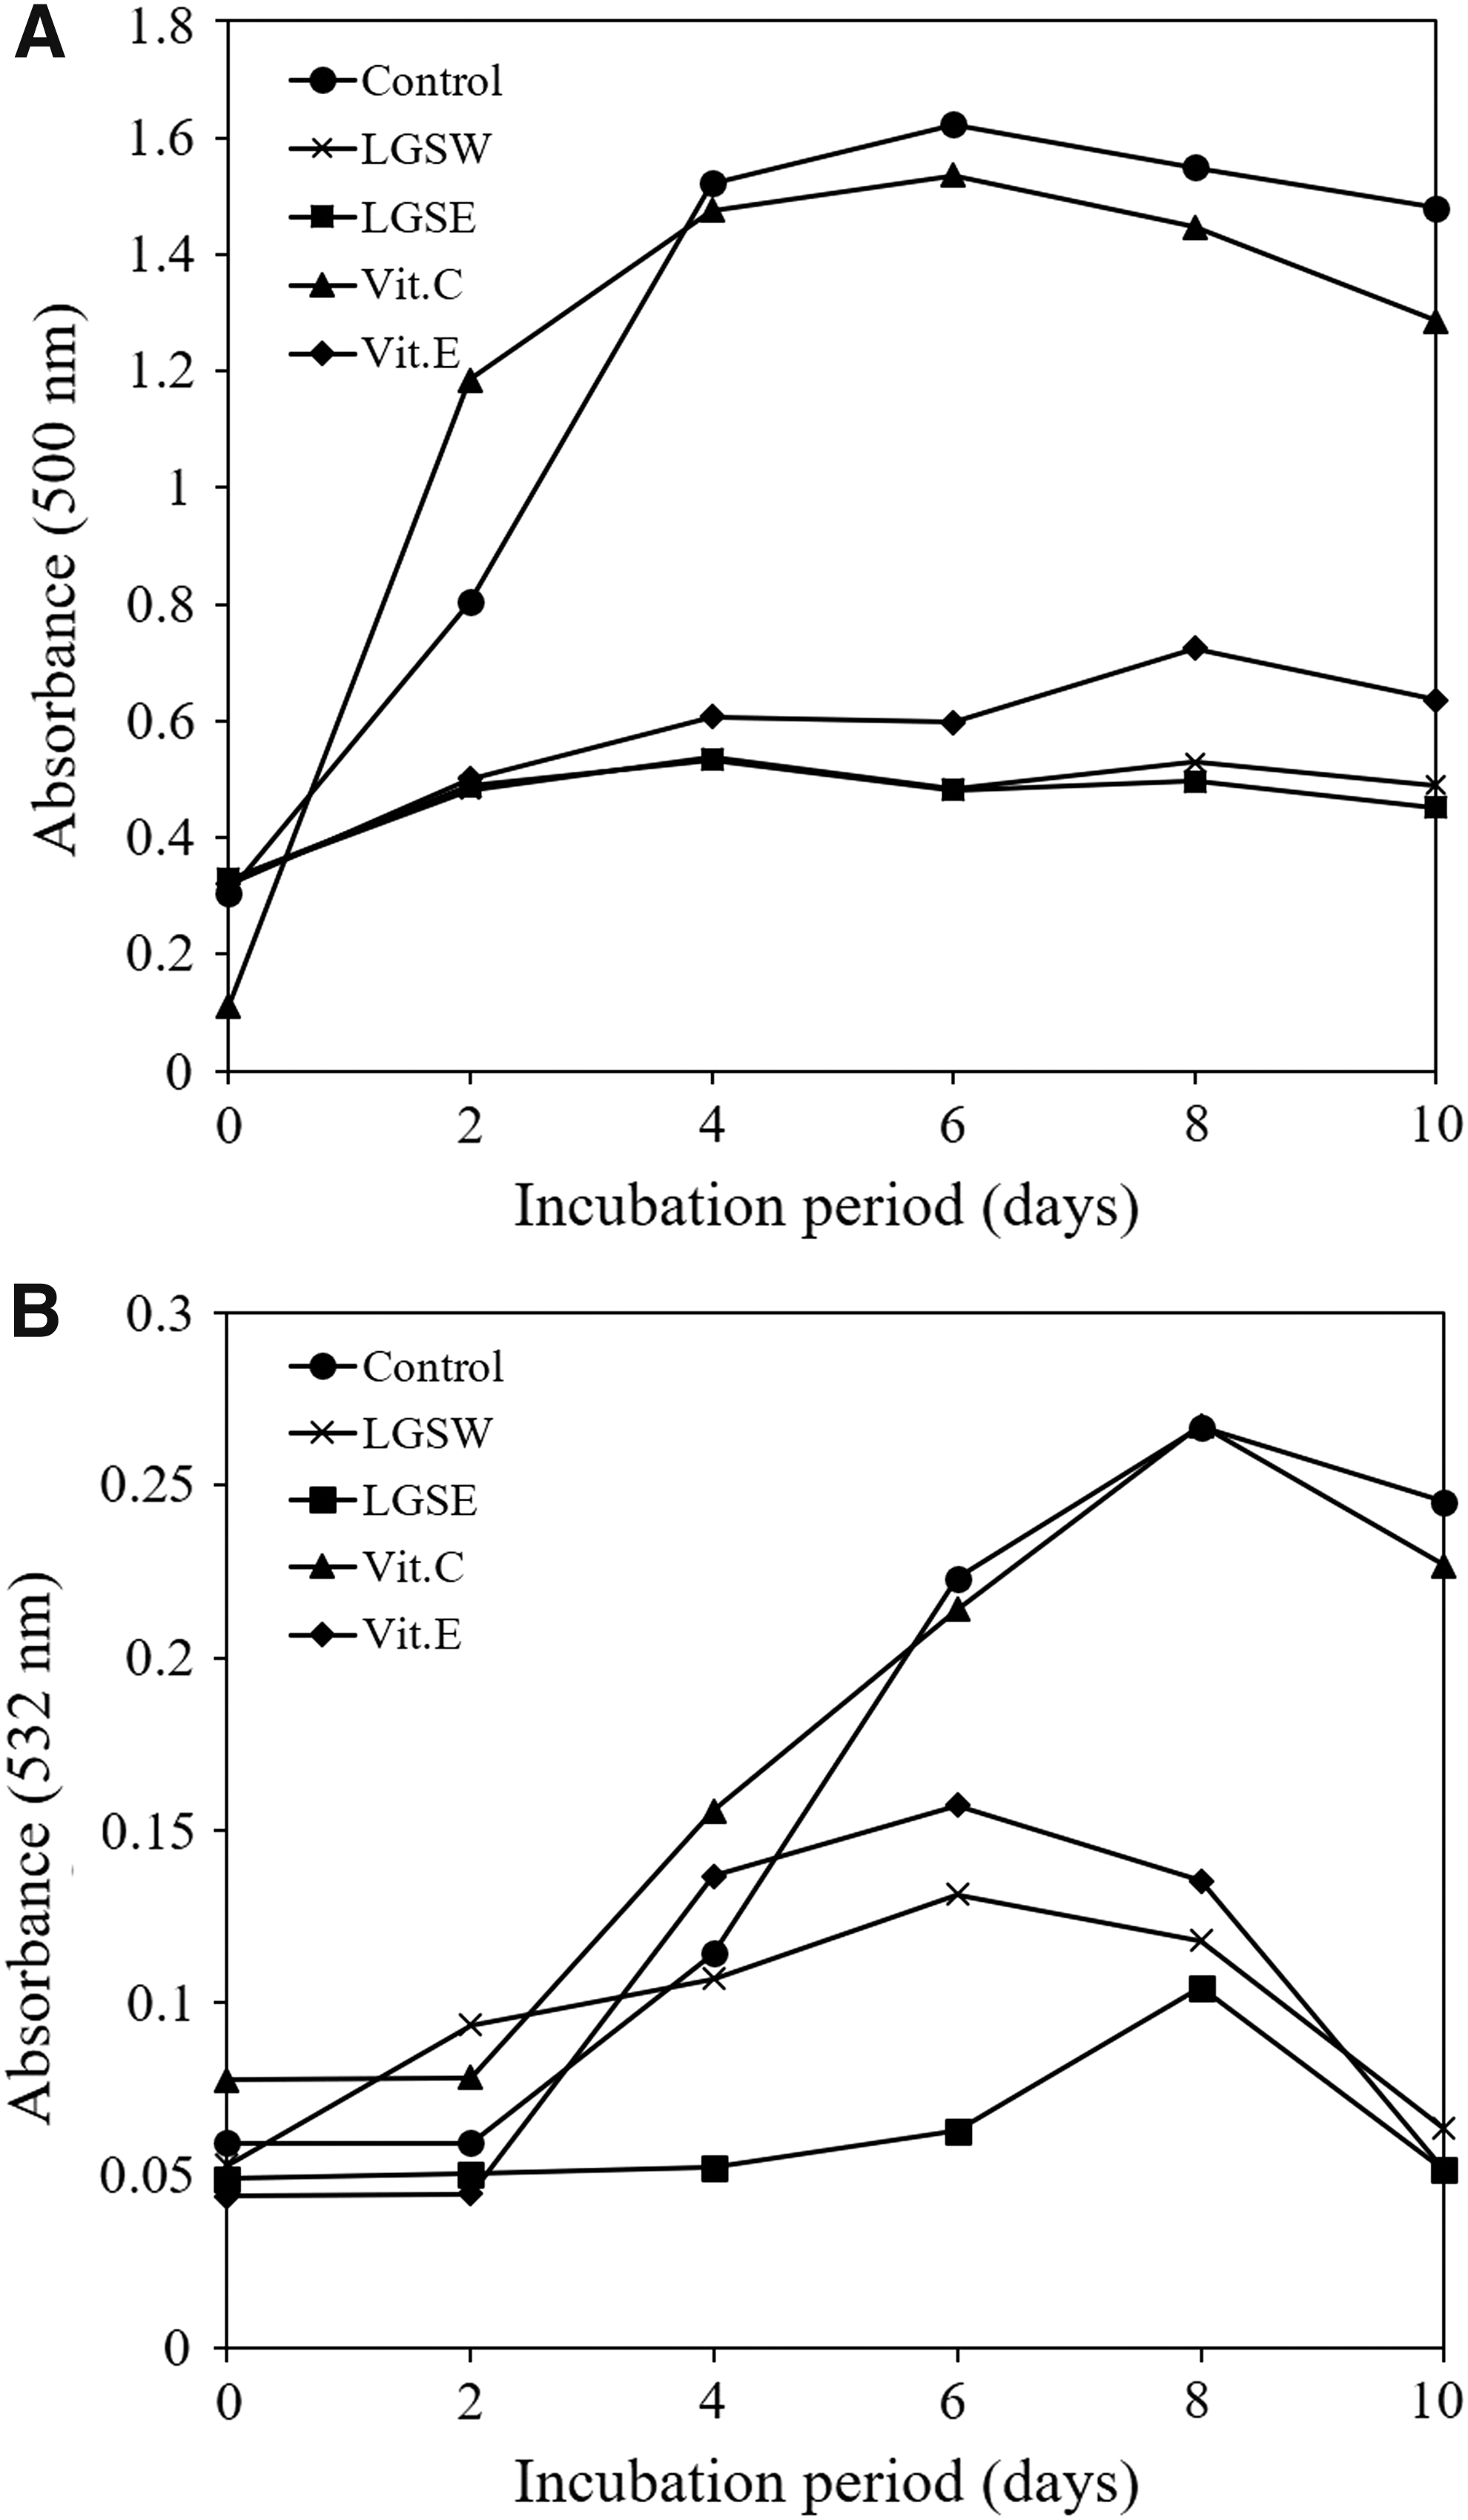
Inhibitory effects of LGSW and LGSE on lipid peroxidation. Lipid peroxidation activities in the presence of LGSW, LGSE, vitamin C, and vitamin E were measured by FTC assay
Cell viability
Before investigating the protective effect of LGS extract, we assessed the cell viability of Chang cells treated with LGS extracts at 0–200 μg/mL, and they had no significant effects on the cell viability (data not shown). The protective effect of LGS extract was studied using cytotoxicity induced by t-BHP, a chemical that produces alkoxyl/peroxyl radicals that cause oxidative stress in the cellular system. 18 Treatment of 100 μM t-BHP on Chang cells significantly decreased their cell viability up to 65.55% (Fig. 2). LGSE treatment dose dependently prevented against t-BHP-induced oxidative stress. LGSE (200 μg/mL) exerted its protective effect against oxidative stress as strong as NAC (positive control). However, LGSW had no significant protective effect to improve the cell viability of Chang cells. Therefore, based on these findings, we conducted further experiments with LGSE to investigate its protective effects.
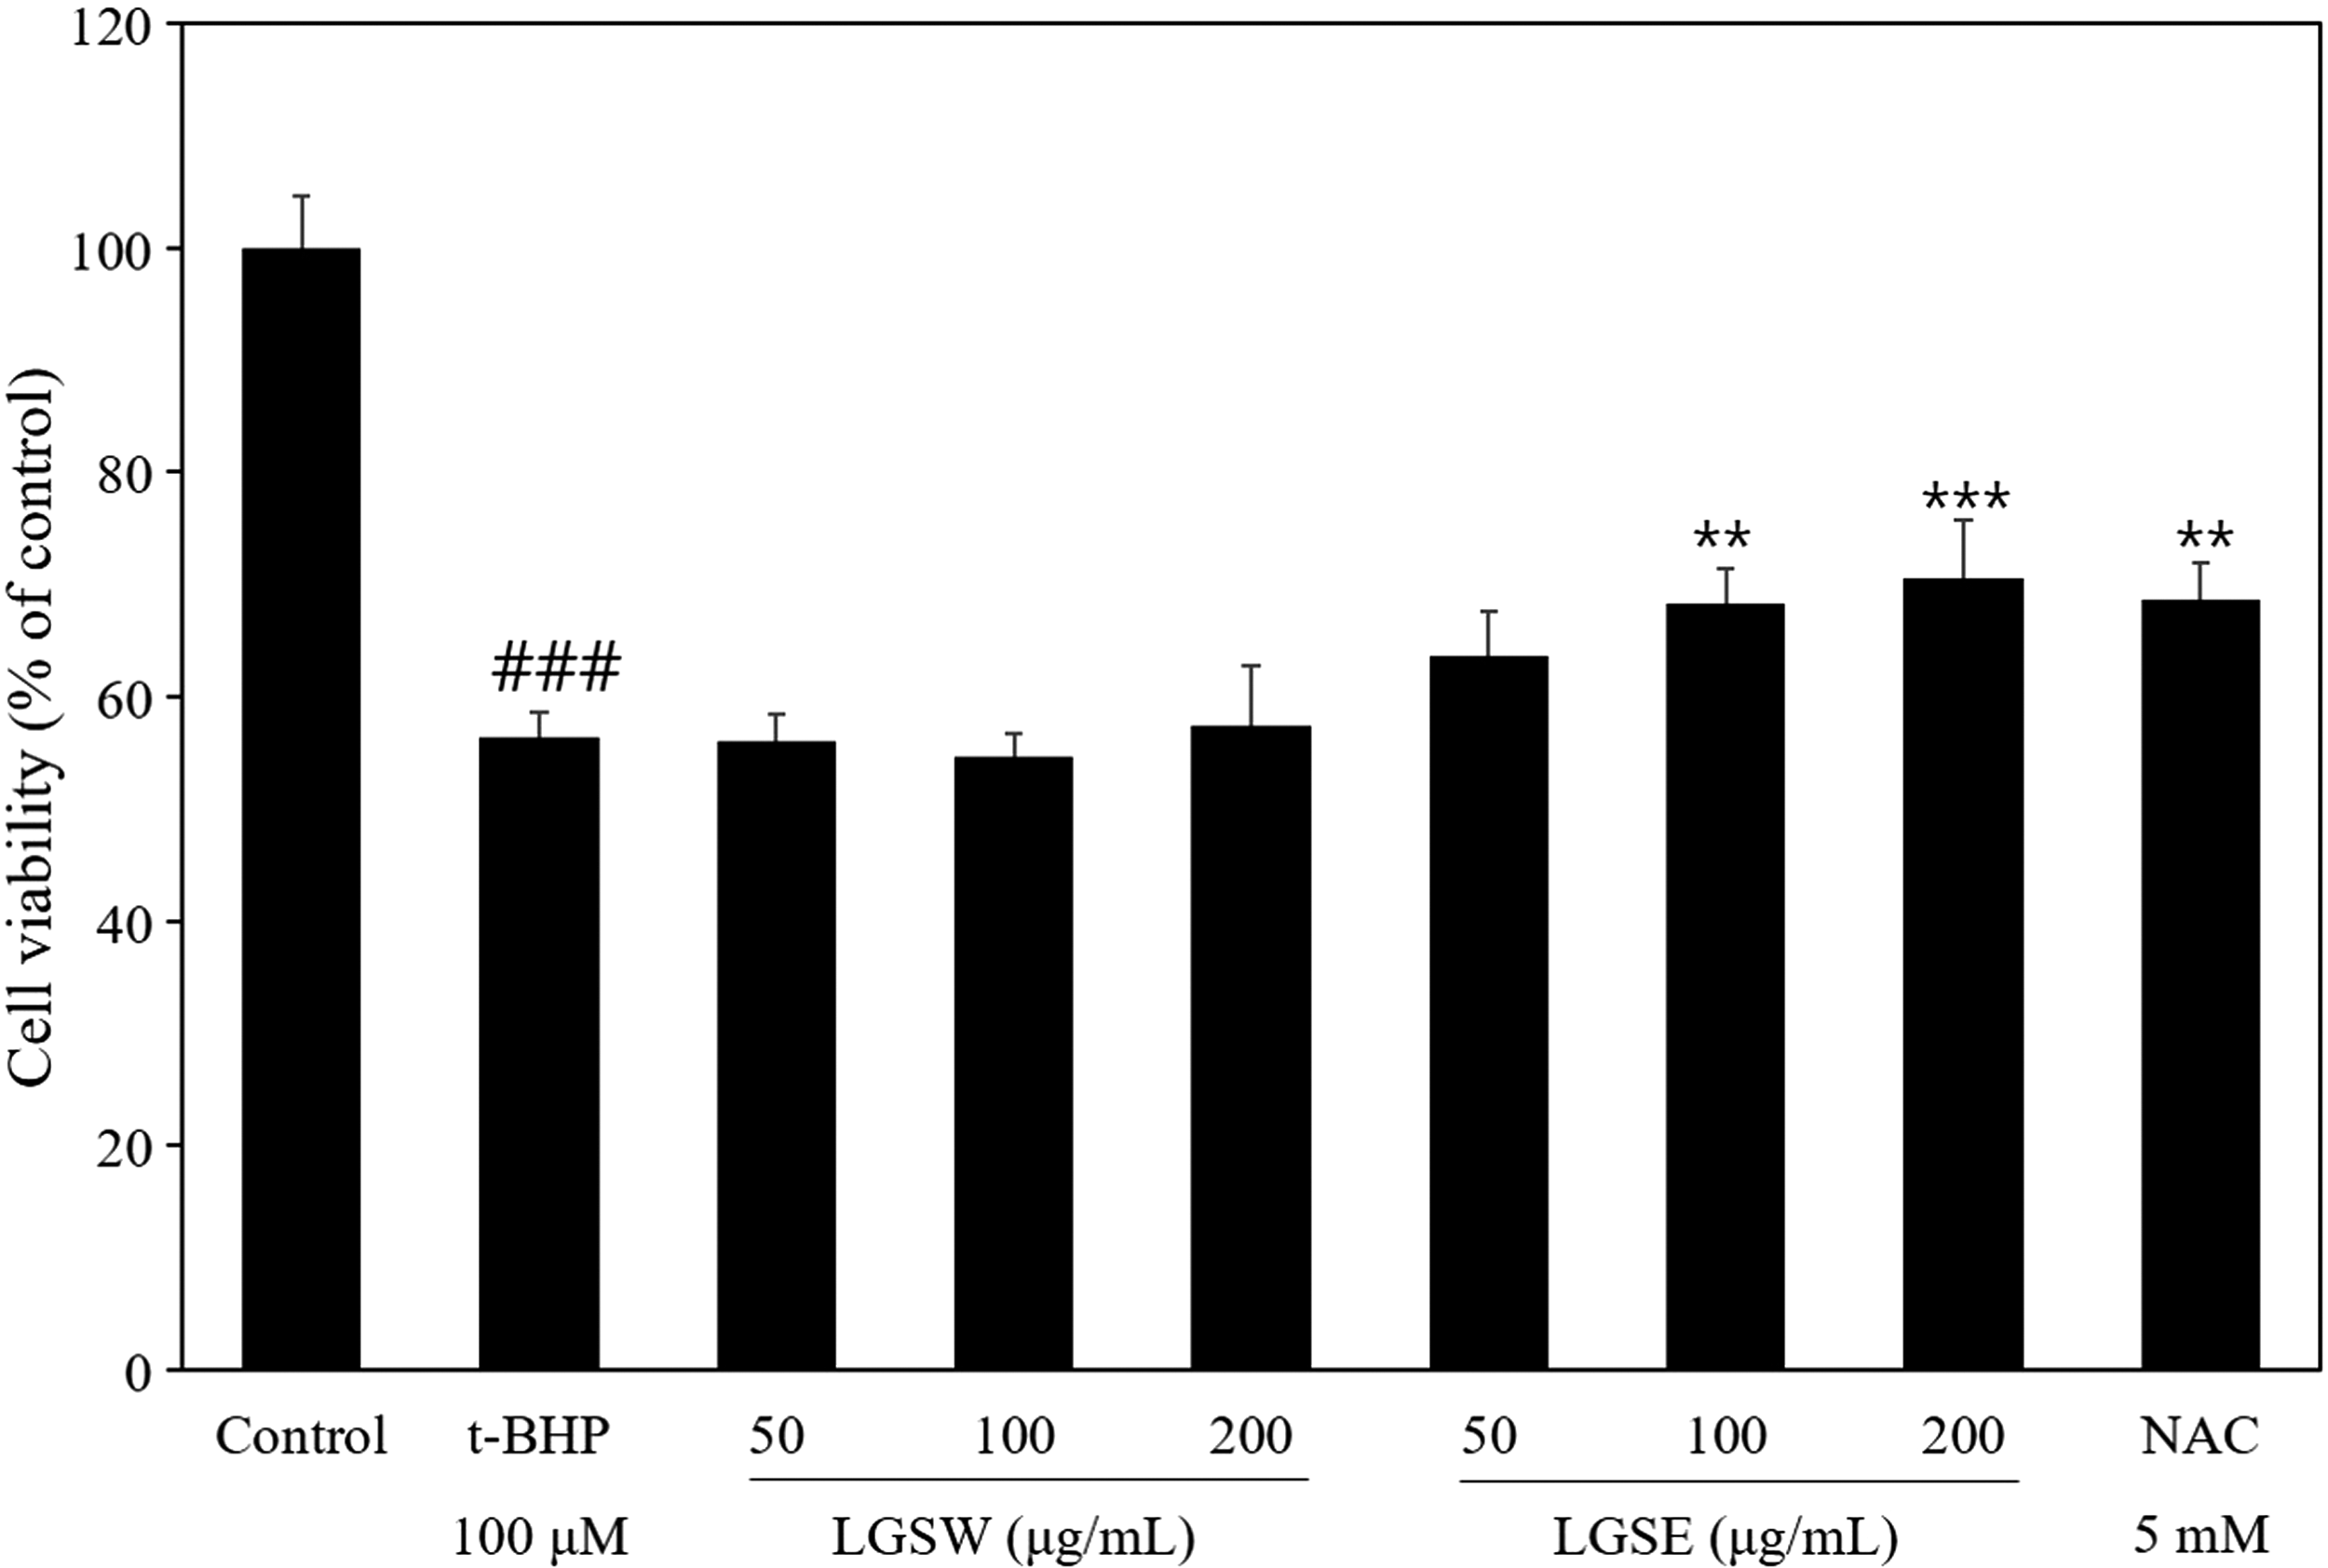
Effect of LGS extracts on the cell viability. Chang cells were pretreated with indicated LGSW/LGSE/NAC at indicated concentrations and induced with t-BHP treatment or treated t-BHP alone, and the cell viability was assessed by MTT assay. Data are shown as mean ± SD of three independent experiments. ### P < .001 versus control. **P < .01, ***P < .001 versus t-BHP. t-BHP, tert-butyl hydroperoxide.
Cell cycle analysis
To examine the protective effect of LGSE on t-BHP-induced cell death, apoptotic cells were examined using PI staining. As shown on Figure 3, t-BHP significantly induced the accumulation of cells in the sub-G1 phase of the cell cycle compared with control group. Pretreatment with LGSE reduced t-BHP induced accumulation of cells in the sub-G1 phase of the cell cycle dose-dependently. In the NAC treatment group, the same protective effect was observed.
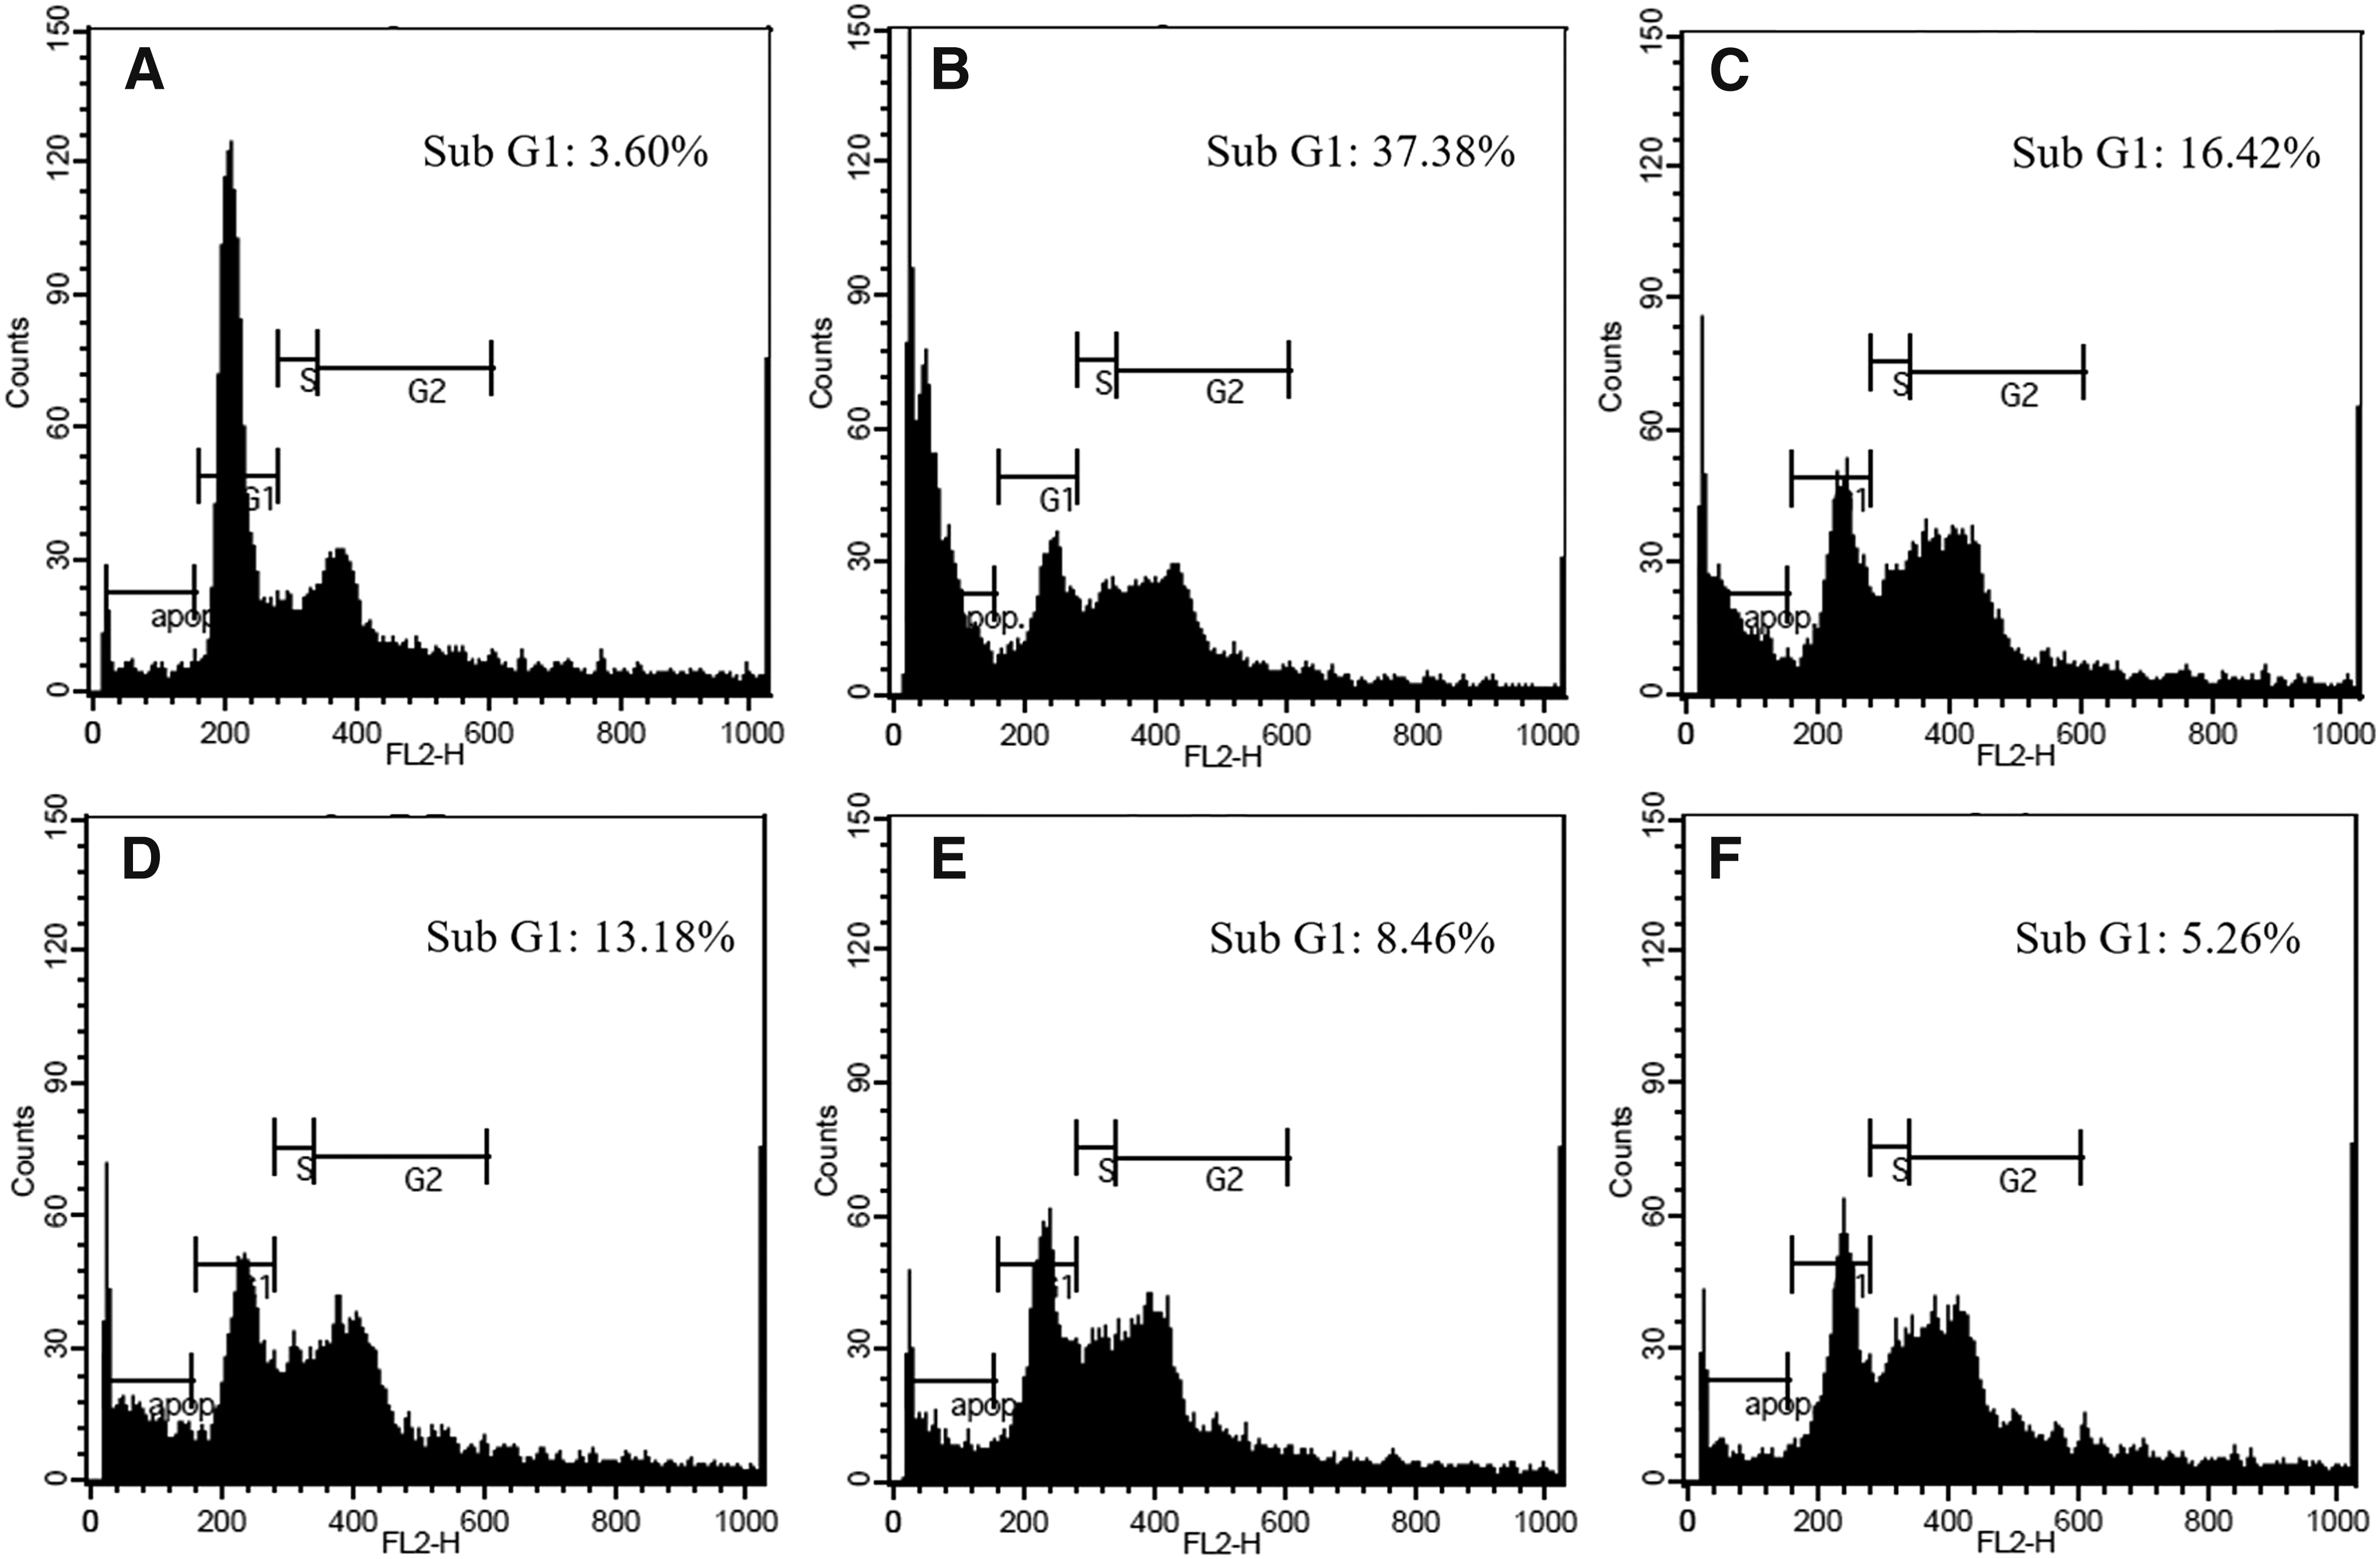
Effect of LGSE pretreatment on the cell cycle of Chang cells. Chang cells were pretreated with
Intracellular ROS content
To determine the effect of LGSE on intracellular ROS generation, intracellular ROS content was detected using DCF-DA dye. The t-BHP treatment group showed a marked increase in intracellular ROS production, six times compared to the control group (Fig. 4). LGSE treatment dose-dependently attenuated the intracellular ROS production. These results indicate that t-BHP induces the excessive accumulation of intracellular ROS, which leads to Chang cell death, and pretreatment of LGSE could prevent t-BHP-induced cell death by decreasing intracellular ROS levels.
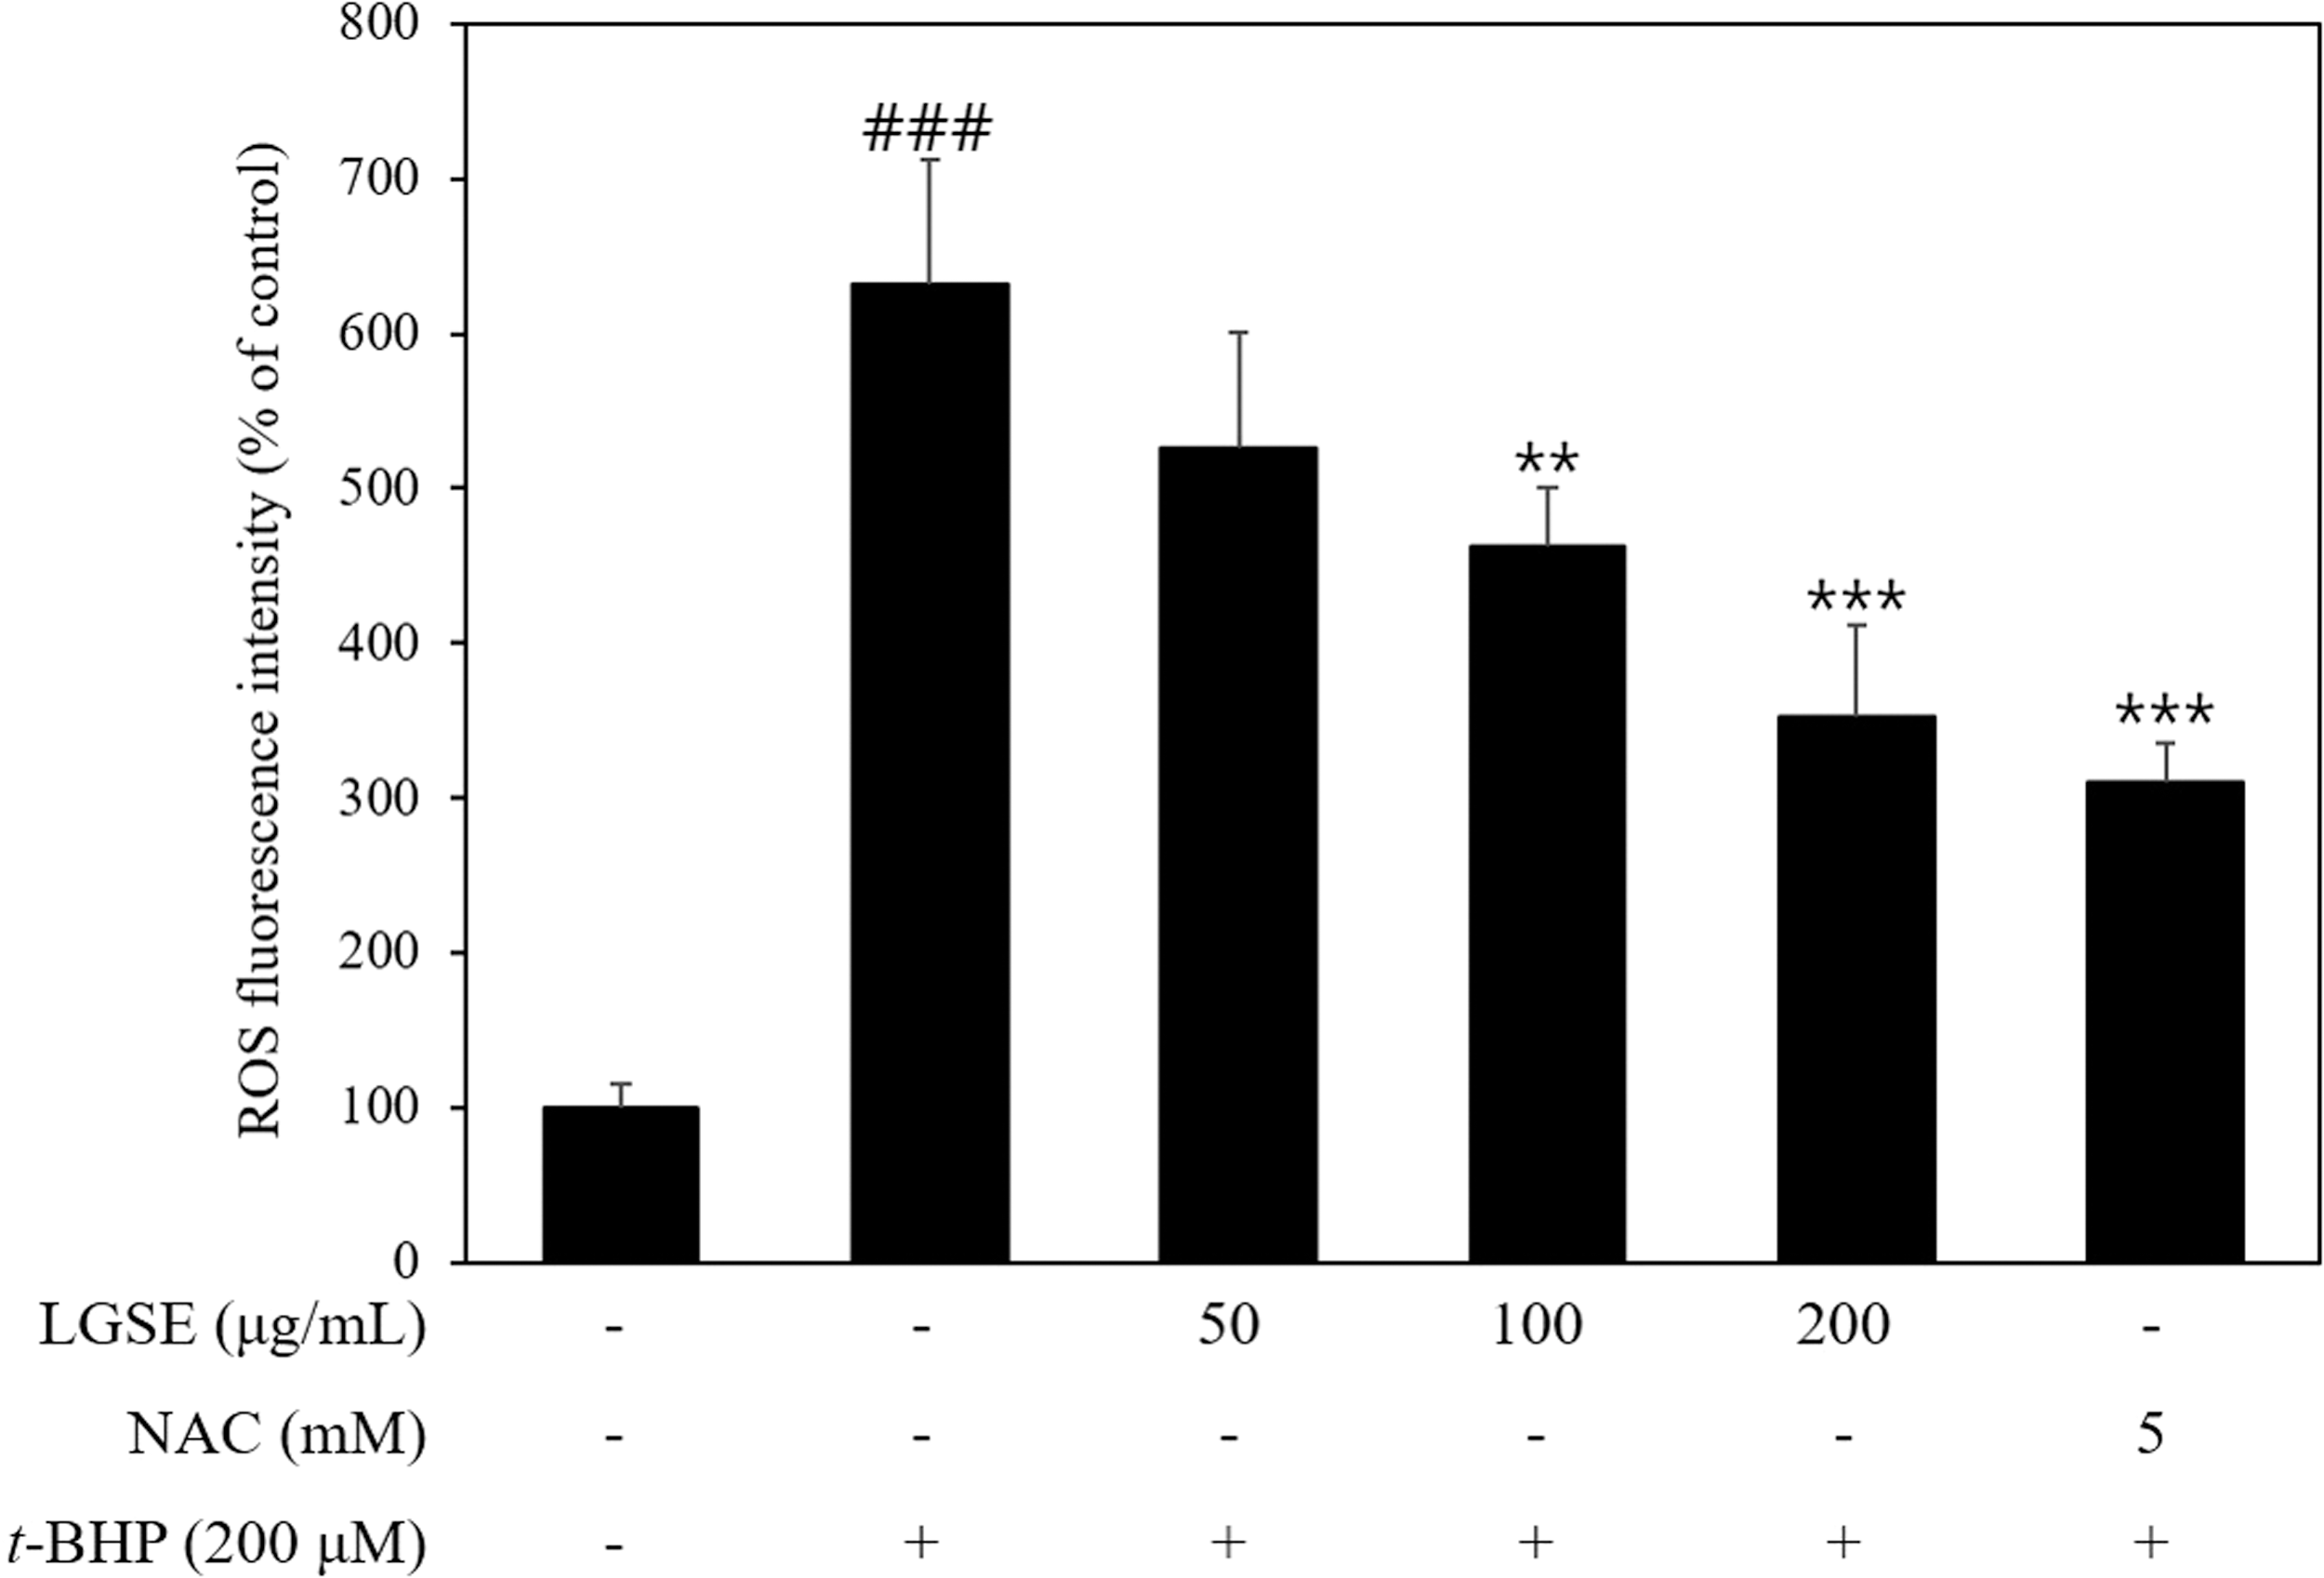
The protective effect of LGSE on t-BHT induced ROS production in Chang cells. Chang cells were pretreated with indicated concentrations of LGSE/NAC and induced with t-BHP or treated t-BHP alone, and intracellular ROS production was measured using a spectrofluorometer. Data are shown as mean ± SD of three independent experiments. ### P < .001 versus control. **P < .01, ***P < .001 versus t-BHP. ROS, reactive oxygen species.
Measurement of MMP
In Figure 5, the MMP levels were detected in pretreatment of LGSE and t-BHP in Chang cells. The results showed that Chang cells exposed to t-BHP led to 62.51% ± 1.37% reduction (P < .01) in MMP levels. Pretreated cells with LGSE (50, 100, 200 μg/mL) increased the levels of MMP, as indicated by the decreases in fluorescence intensities down to 30.76% ± 2.24%, 22.15% ± 2.20%, and 18.97% ± 2.12%, respectively.
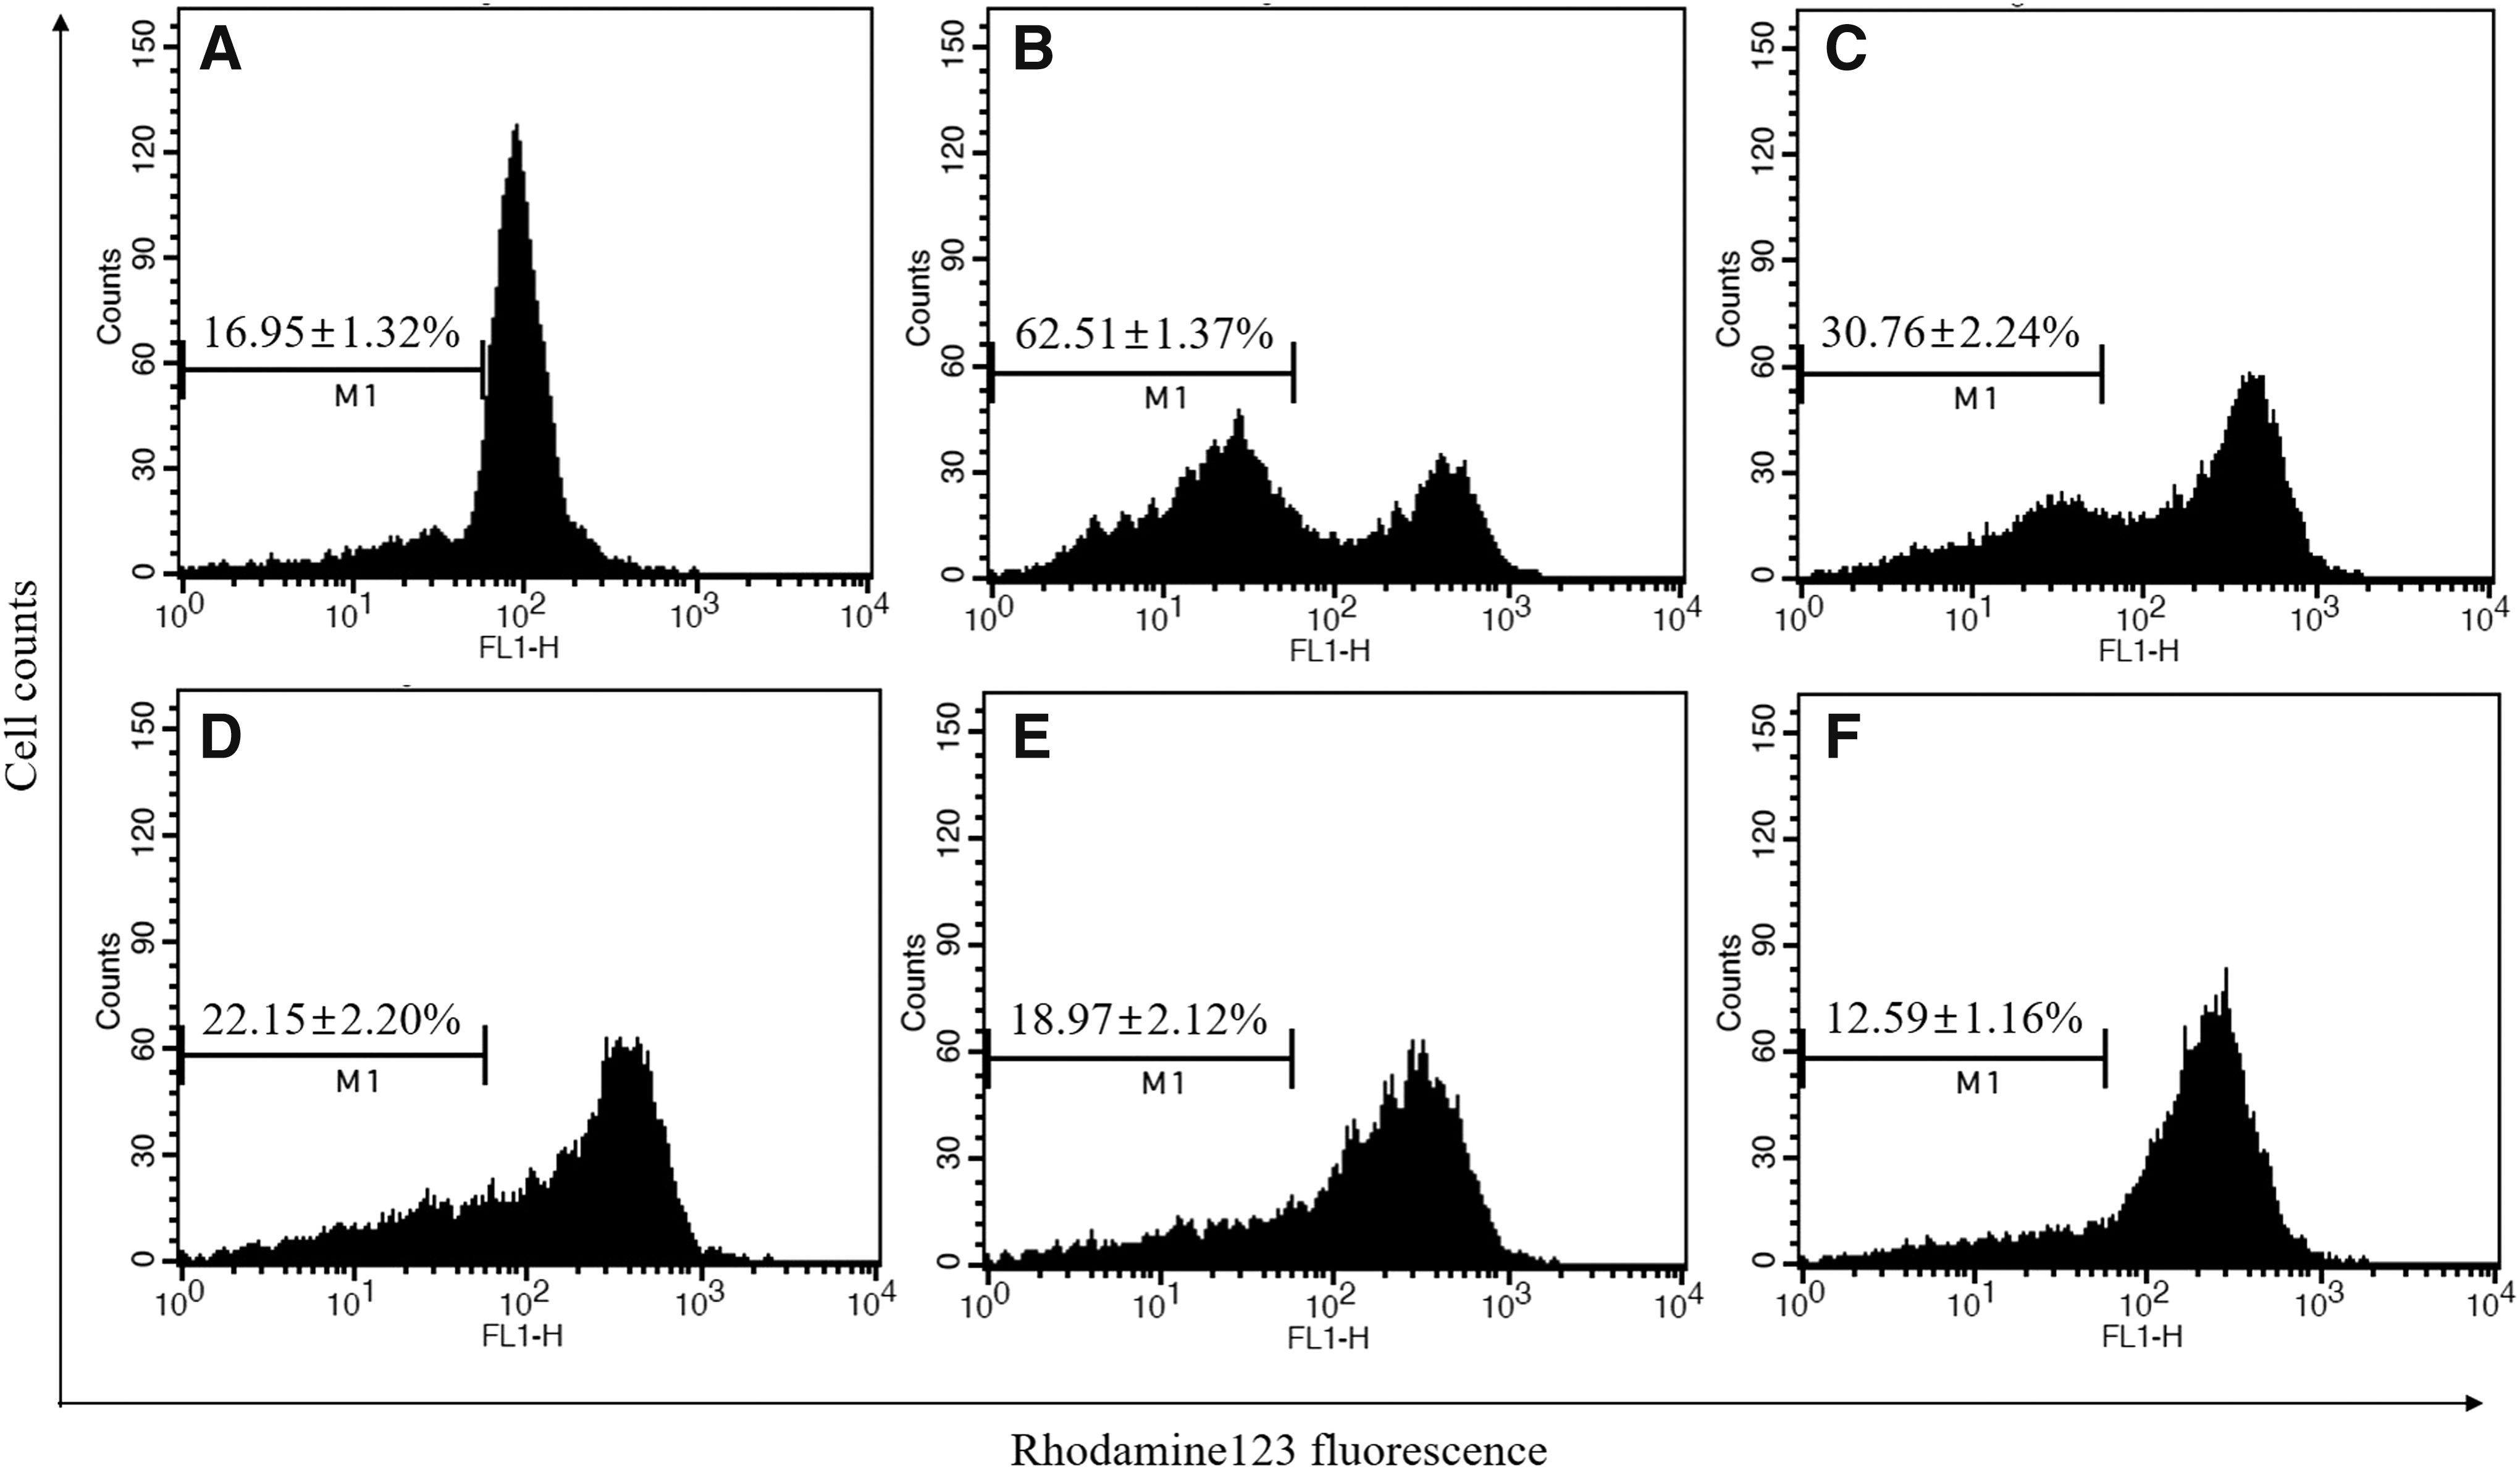
Effect of LGSE pretreatment on MMP/ΔΨ in Chang cells. Chang cells were treated with
Annexin V/PI staining
To examine whether the LGSE could efficiently prevent the damage in Chang cells due to t-BHP treatment, the relative amounts of Annexin V and/or PI stained cells were measured by flow cytometry analysis. In Figure 6, t-BHP treatment increased the levels of late apoptotic cells and necrotic cells significantly as indicated by increasing the number of Annexin V-positive/PI-positive and Annexin V-negative/PI-positive cells. However, pretreatment with LGSE decreased the numbers of apoptotic cells and necrotic cells dose-dependently.
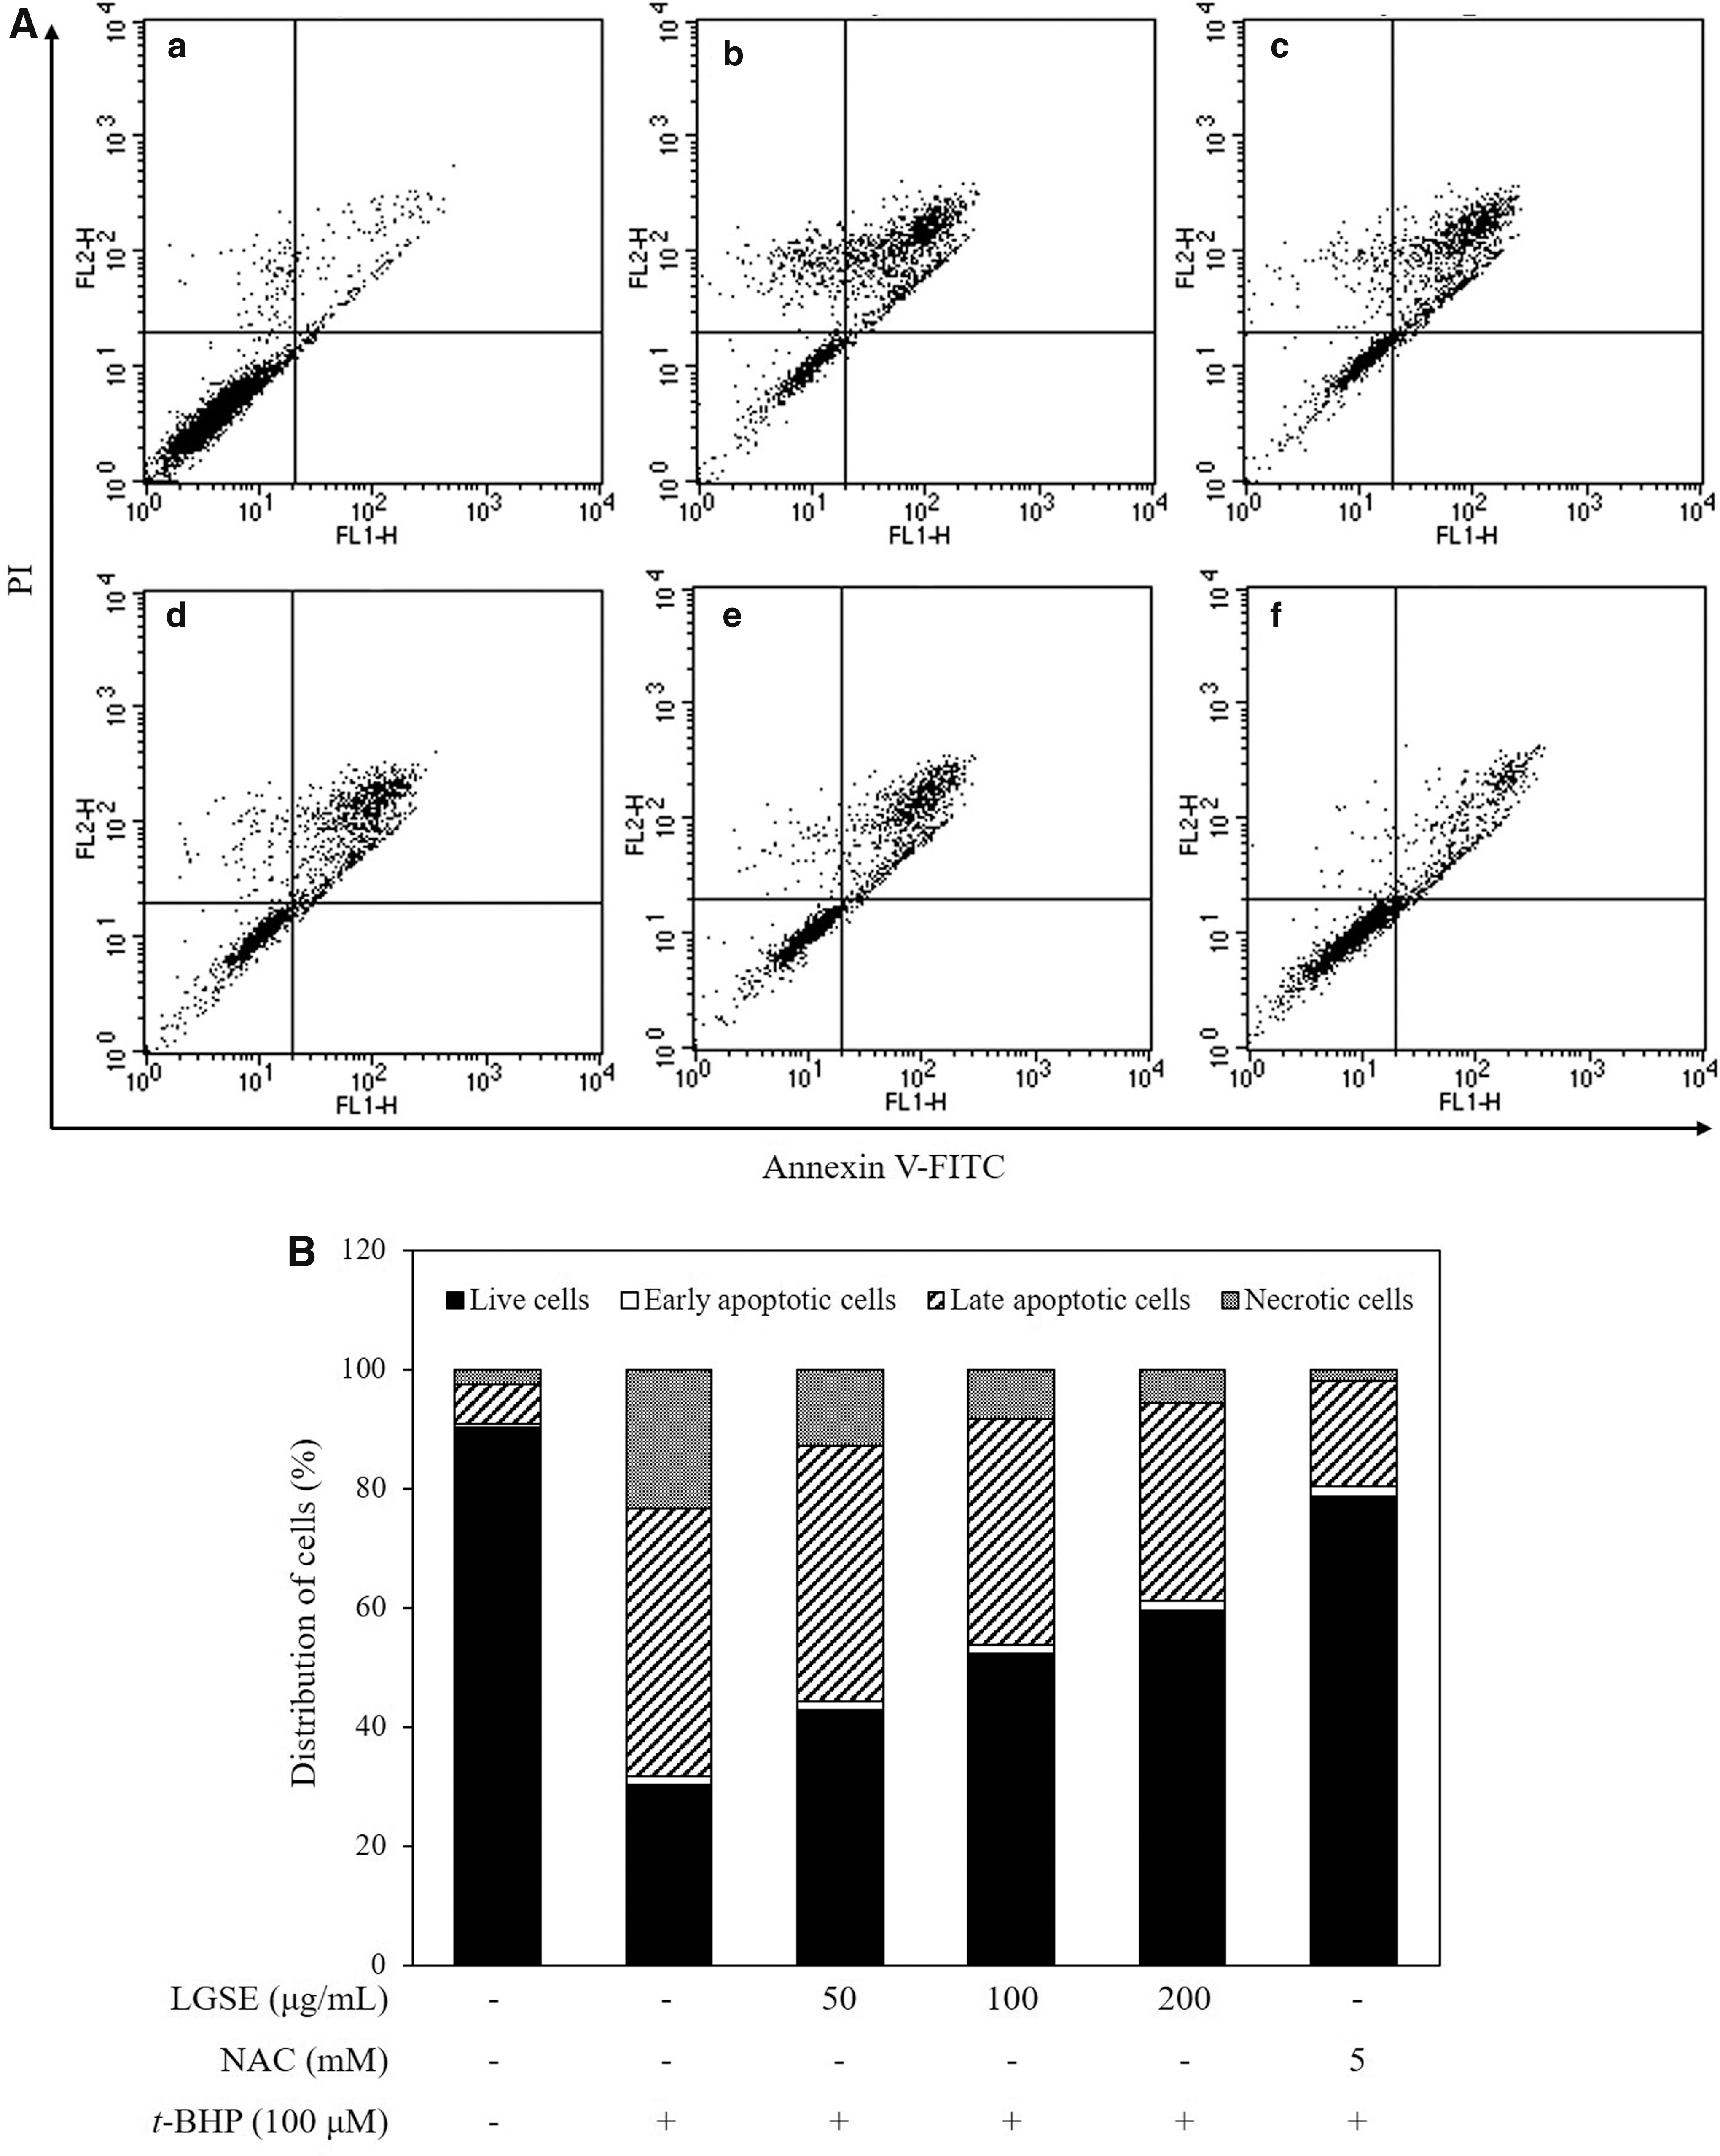
Protective effect of LGSE pretreatment on oxidative stressed Chang cells induced by t-BHP.
Morphological changes in Chang cells
Figure 7 shows the morphological changes observed using light microscopy. The t-BHP-induced oxidative stress group showed apoptotic morphological changes such as cell shrinkage, rounding of cells, and many cell deaths (arrows). However, pretreatment with LGSE and positive control (NAC) remarkably reduced the cell shrinkage and rounding of cells. This tendency may be because LGSE and NAC could protect the cells from oxidative stress.
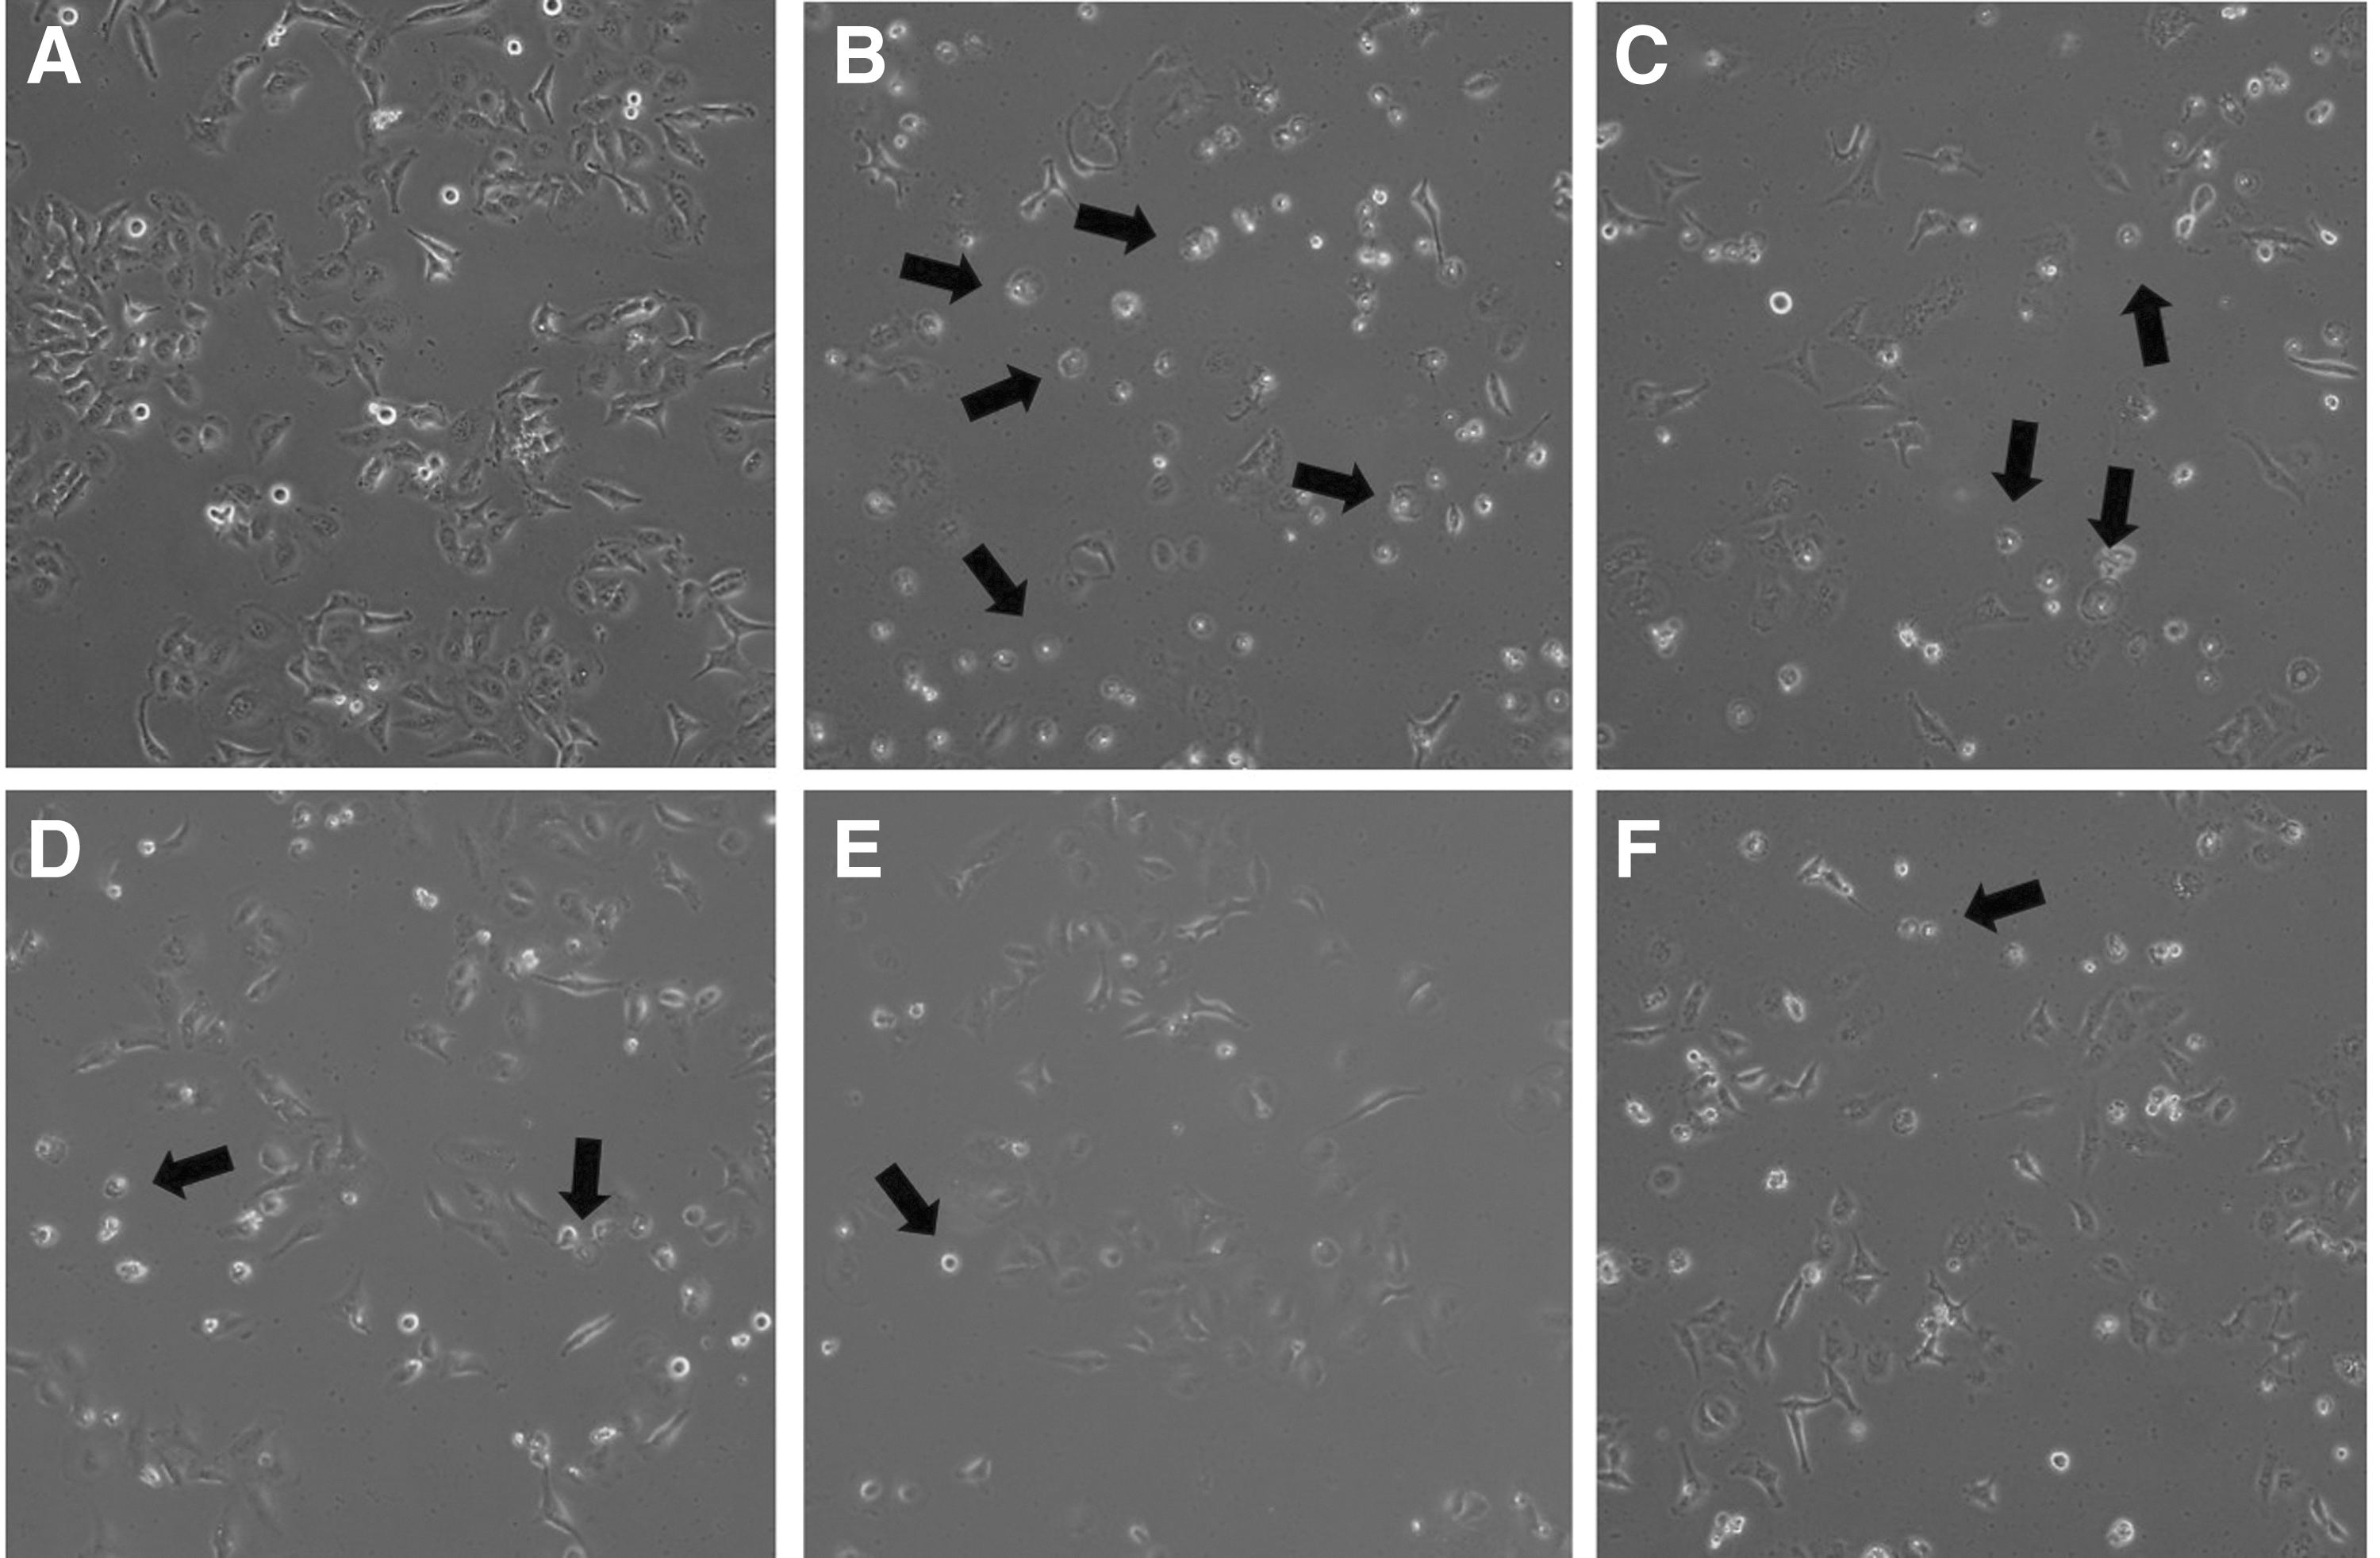
Effects of LGSE pretreatment on cellular morphology of oxidative stressed Chang cells induced by t-BHP. Images show morphological changes in Chang cells treated with
The antioxidant enzyme related mRNA expression level in zebrafish embryo
The t-BHP treated group (1 mM) significantly inhibited the transcription of antioxidant related genes (CAT1, GSTr1, GPx1a, and SOD1), which were observed within 24 h (P < .001) (Fig. 8). In the LGSE treatment group (50 μg/mL, 100 μg/mL dose group), mRNA expression of CAT1, GSTr1, GPx1a, and SOD1 significantly increased (Fig. 8A–D). NAC treated group (as positive control) also showed recovery of the gene expression of CAT1, GSTr1, and GPx1a except of SOD1 expression against oxidative stress. In particular, the high-dose LGSE (100 μg/mL) treated group exhibited a higher antioxidant-related gene expression than the positive control.
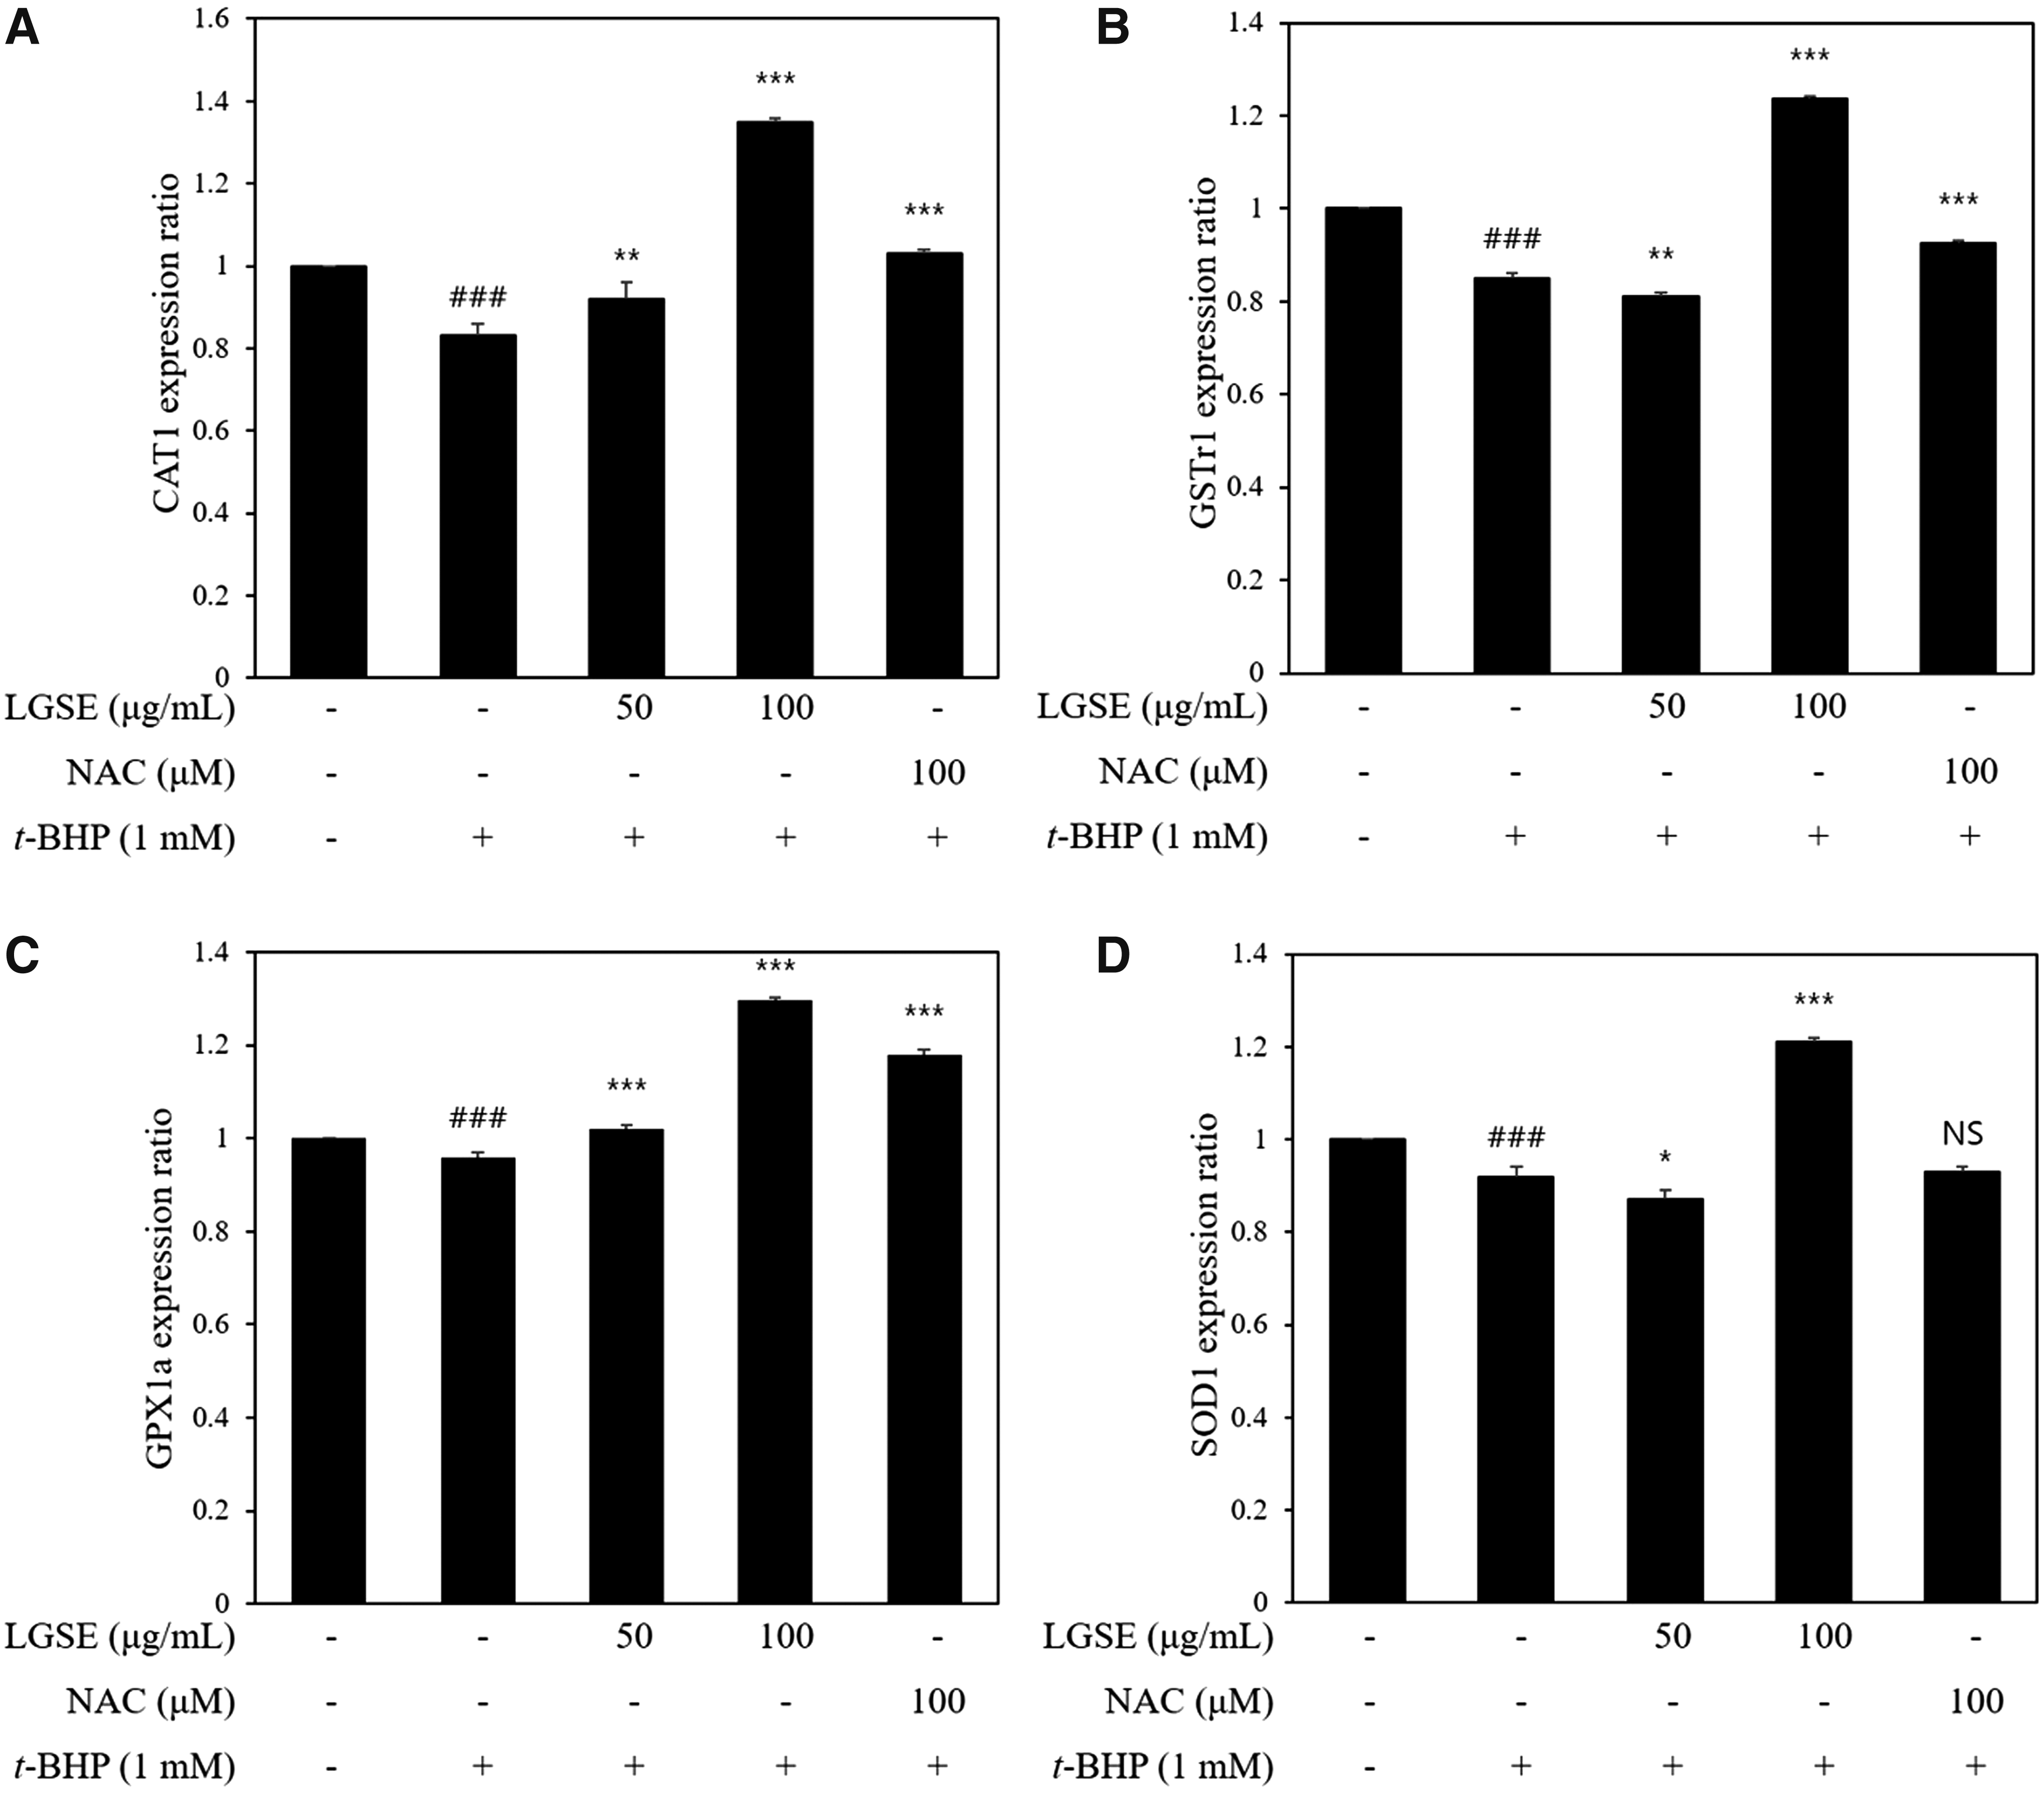
Real-time PCR analysis of mRNA expression levels of CAT1
Comparisons of chromatographic peaks
Figure 9 shows the results of HPLC analysis of main compounds and ABTS radical scavenging activity peaks of LGS extracts. Interestingly, on the retention time, we found out that the main free radical scavenging peaks were slightly different from ethanol extract and water extract of LGS. We have detected the different retention times of main peaks from ethanol extract (at 21 min) and water extracts (at 23 min) using the combined chromatograms for UV (positive peak, 254 nm) and ABTS+ quenching chromatograms (negative peak, 734 nm). The 23 min peak of water extract (0.3 AU) and ethanol extract (0.3 AU) showed similar peak height, as well as similar radical scavenging activity. Especially, main peak of ethanol extract (21 min, 0.42 AU) showed higher peak than water extract (0.14 AU) at same retention time. In addition, the major peak of the ethanol extract (21 min peak, ABTS peak (−0.42 AU)) showed stronger radical scavenging activity than 23 min peak (ABTS peak (−0.27 AU)). The separation of free radical scavenging compounds from the active peaks is underway and will be published in further studies.
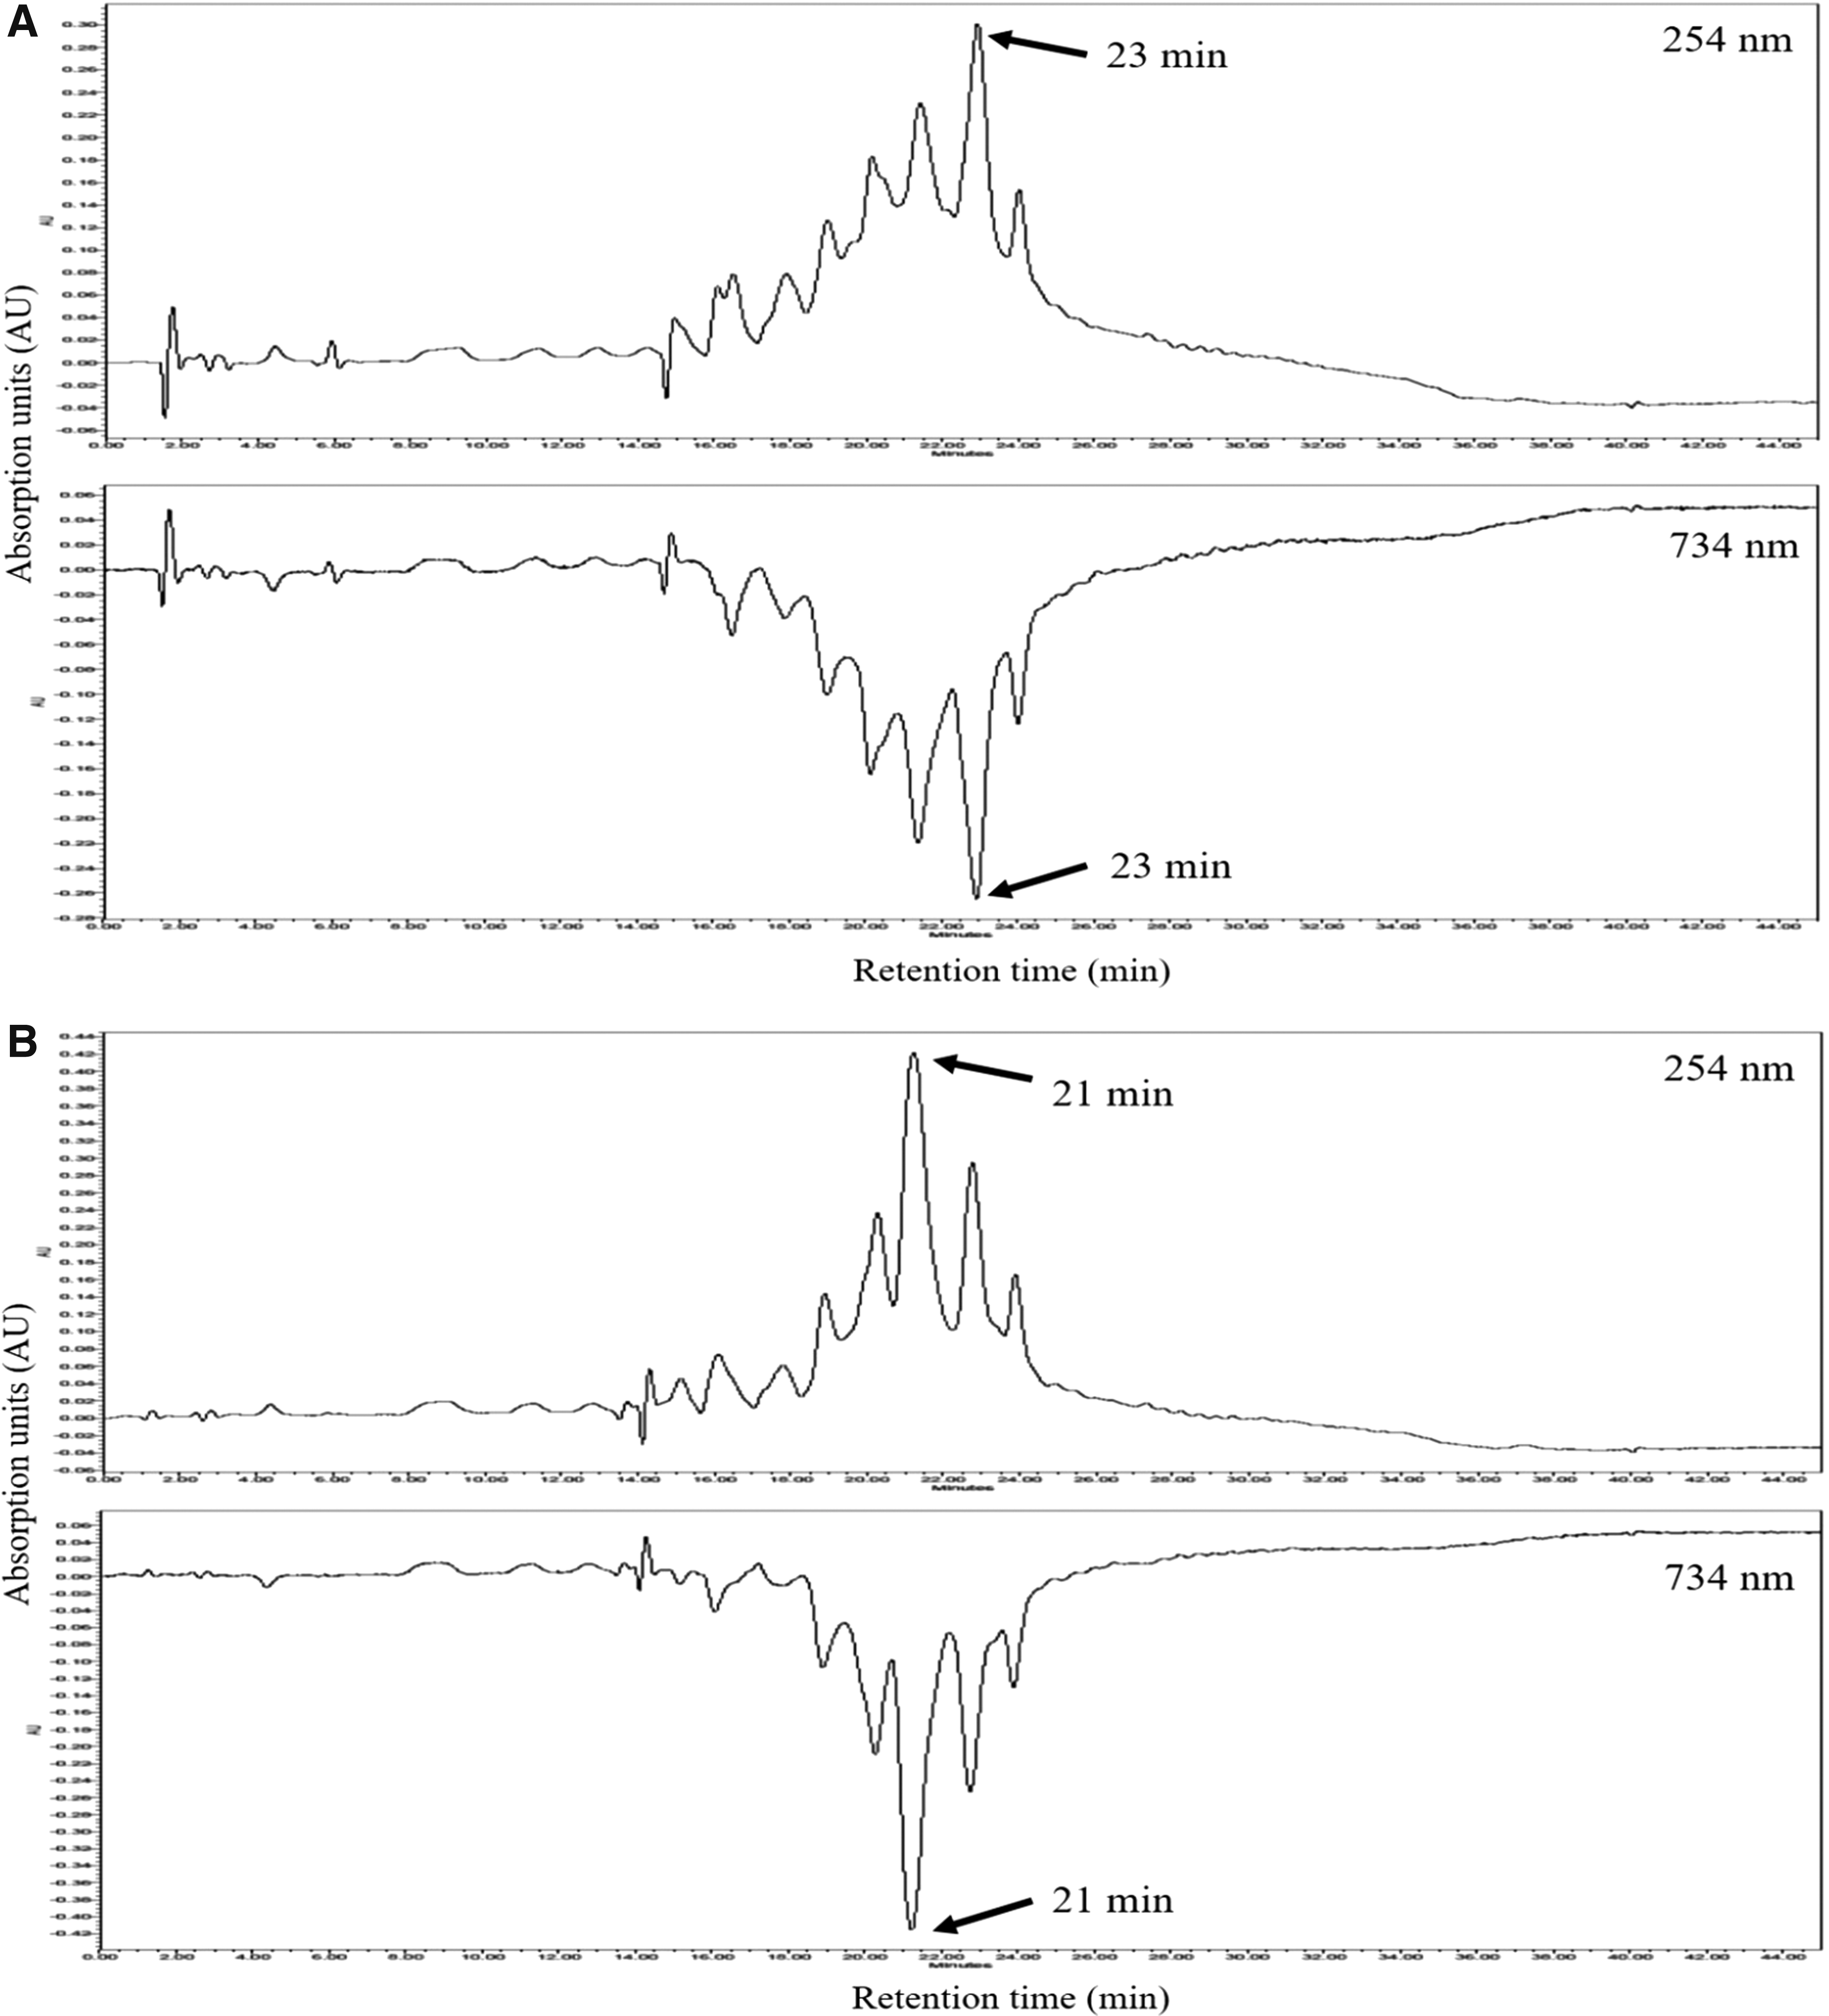
On-Line HPLC chromatograms of LGS extracts detected at 254 nm at 734 nm. The ABTS radical scavenging chromatogram (negative peaks) at 734 nm was aligned with reverse-phase HPLC chromatogram (positive peak).
Discussion
Oxidative stress and the excessive ROS generation led to a pathophysiological condition in the body. 19 Oxidative stress is the underlying basis of imbalance among ROS productions and cellular antioxidant defense system. 20 The ROS generation and mitochondrial dysfunction have been powerfully related with cell death mediated aging and various diseases. 21 The overproduction of intracellular ROS leads to mitochondrial damage, including loss of MMP and resulting in apoptosis. 22 Therefore, study of regulation of ROS production is a significant key in the development of antioxidant materials.
The excellent antioxidant activity of the LGS extract was observed by evaluating its TEAC, FRAP, and ORAC values and inhibition of lipid peroxidation, as well as various scavenging capacities (DPPH, alkyl, and hydroxyl radicals). These results indicate that both LGSW and LGSE possess enormous potential in application as natural antioxidants. When comparing LGSE with LGSW, LGSE has a superior capacity than LGSW in the protective effect against oxidative stress in Chang cells. To understand the causal roles of LGSE antioxidant activity in t-BHP-induced oxidative stress, the cell viability, production of intracellular ROS, cell cycle analysis, MMP, and annexin V/PI staining were determined. Our study showed that LGSE effectively scavenged ROS production, decreased apoptosis, and protected MMP.
The antioxidant defense system includes nonenzymatic antioxidants (such as vitamin E and GSH) and antioxidant enzymes (such as CAT, GPx, GST, and SOD), which play an important role in inhibiting ROS production and protecting cells against oxidative stress. 23,24 SOD and CAT are crucial antioxidant enzymes, which play a pivotal role in antioxidant defense. 25 SOD catalyzes the highly reactive superoxide anion from oxidative stress to H2O2 that can further be degraded into oxygen and water by CAT or GPx. 23 GSH and its related enzymes (such as GPx and GST) play a crucial role in detoxifying the reactive metabolites and maintaining the intracellular redox balance. 26 GSH not only acts as a substrate or cofactor for GPx and GST but also can scavenge the free radicals directly. 27 However, these multifunctional protection systems cannot totally prevent the harmful effects of ROS, which consequently can lead to molecular injury. 28
Therefore, antioxidant supplement, which can help to improve biological defense systems, is necessary to regulate the excessive ROS production. To develop additional antioxidants, a number of previous researches have attempted to demonstrate the protective effect of cells through the modulation of antioxidant enzymes using natural materials such as flavonoids.
To better understand the protective effects exerted by LGSE, we determined changes in the expression of antioxidant-related genes using qRT-PCR in zebra fish. We found out that treatment of zebra fish embryos with 1 mM t-BHP induced significant decreases in the mRNA expression of CAT1, GSTr1, GPx1a, and SOD1 compared to the control group. However, during pretreatment of LGSE (50, 100 μg/mL) or NAC for 24 h, the decreasing of antioxidant-related gene expression was suppressed. In these results, regulation of the CAT1, GSTr1, GPx1a, and SOD1 genes by pretreatment of LGSE obviously indicates the ability of the protective effect of LGSE to respond to an oxidative stress. However, further research is needed to determine the mechanism by which LGSE affects antioxidant enzyme activity.
Conclusion
In all these results, LGS extracts (LGSW and LGSE) showed antioxidant activities and protective effects against oxidative stress through suppression of ROS. Especially, LGSE significantly increased the antioxidant related genes reduced by t-BHP induced oxidative stress in the zebrafish model. Therefore, we suggest that LGSE can be used as a potential natural and functional food in preventing oxidative stress induced damage.
Footnotes
Acknowledgment
This work was supported by the National Research Foundation of Korea (NRF) grant funded by the Korea government (Ministry of Education) (No. NRF-2016R1A6A3A11935423).
Author Disclosure Statement
The authors declare that there is no conflict of interest regarding the publication of this article.