




Abstract
Orostachys japonicus A. Berger and Momordica charantia Linn have been widely used as an alternative medicine. Recently, patients with type 2 diabetes (T2D) have paid increasing attention to medical nutrition therapy due to its safety and cost-effectiveness. Therefore, we have developed a new health functional food that consists of a mixed extract of O. japonicus and M. charantia. The aim of this study is designed to assess the antidiabetic efficacy of O. japonicus and M. charantia extracts (OME, in an 8:2 ratio), especially focusing on the effects of O. japonicus via in vivo and in vitro experiments. Seven-week-old C57BL/Ksj-db/db (db/db; a genetic animal model of T2D) mice were used for inducing diabetes. Mice were administered with various concentrations of OME (OME 0, 100, 200, or 400 mg/kg/day) for 6 weeks. Metabolic parameters, fasting blood glucose and glycosylated hemoglobin levels were measured. Histopathologic analysis and the levels of serum or hepatic biochemicals were assessed to evaluate diabetic liver injury and steatosis. The expression levels of lipogenic and gluconeogenic genes were determined by quantitative real-time polymerase chain reaction. Activation of Akt was assessed by western blot analysis. Administration of OME significantly improved metabolic parameters in db/db mice, and also reduced diabetic liver injury and steatosis were observed by OME administration in db/db mice as confirmed by histopathologic and serum or hepatic biochemical analysis. Consistently, treatment of OME significantly increased Akt activation resulting in decreased expression levels of lipid-accumulation or gluconeogenesis-related genes. Similar results were observed in in vitro experiments using single extract of O. japonicus and using OME. OME has antidiabetic effects with increased insulin sensitivity, and may be a safe alternative therapy for the management of T2D.
Introduction
Recently, the incidence of type 2 diabetes (T2D) has gradually increased and become a threat to global public health. T2D is a chronic metabolic disorder that is characterized by increased insulin resistance (IR) against insulin-targeting tissues, hyperglycemia, hyperinsulinemia, and, gradually, reduced insulin-producing capacity of pancreatic β cells. 1 Numerous onset factors of T2D have been proposed by clinical and experimental researchers, who suggest that genetic background, epigenetic predisposition, and lifestyle factors such as over-nutrition and insufficient exercise accelerate the development of T2D mellitus. 2 Investigators have reported that these metabolic disorders lead to many serious complications including renal and liver injury, blindness, nerve damage, and atherosclerosis. 3 Of these, diabetic liver injury has been of increasing research interest recently because the liver is one of the main regulatory organs of glucose and lipid metabolism. 3 Additionally, persistent and chronic diabetic liver injury leads to severe inflammation and liver fibrosis, and therefore, T2D and its related metabolic syndrome are well-known risk factors for the development of hepatocellular carcinoma. 2,4
Traditional medicinal plants are known to contain numerous prophylactic compounds that have been used over thousands of years for treating many diseases. Of these, Orostachys japonicus A. Berger, known as wa-song in Korean, is a traditional herb of the Crassulaceae family and widely used for reducing pain and swelling and for preventing or treating several chronic diseases and cancer. 5,6
Recently, researchers have reported that O. japonicus has various flavonoids including gallic acid, epicatechin, quercetin, and kaempferol, and derivatives that have numerous biological activities including antioxidative effects. 7,8 Among various pathophysiological activities of these flavonoids, antidiabetic effects have been broadly examined using several rodent models of type 1 diabetes (T1D) and T2D 9 –15 investigators have demonstrated that its regulatory effects on oxidative stress and inflammation play critical roles in the severity of T1D and T2D. Furthermore, (−)-Epicatechin-3,5-O-digallate (ECDG) from O. japonicus has an inhibitory effect on α-glucosidase, a crucial factor in controlling blood glucose levels. 16 Based on these results, recent study showed that O. japonicus might be a promising antidiabetic compound due to its ability to decrease hyperglycemia and hyperlipidemia through modulating antioxidative responses in T1D mellitus. 17 However, the effects of O. japonicus on the development and progression of T2D remain unclear.
Despite the various pharmacological trials dedicated to treating T2D, the incidence of unwanted complications has been high. 18 Therefore, complementary and alternative medicines and medical nutrition therapy are emerging as parts of T2D managements because of their low toxicity and low cost. 18,19 For this reason, we developed a new health food that consists of a mixture of O. japonicus and Momordica charantia Linn (M. charantia, bitter melon) extracts. Because it has been well documented that M. charantia possesses antidiabetic effects by increasing insulin secretion and insulin sensitivity, 12,20 the purpose of this study was to evaluate the antidiabetic efficacy of our newly developed product, especially focusing on O. japonicus. To induce T2D in mice, we used C57BL/Ksj-db/db (db/db) mice that were genetically leptin receptor-deficient obese because these mice are known to exhibit similar key features to those of human T2D. 21
Materials and Methods
Preparation of O. japonicus and M. charantia extracts
The O. japonicus and fruit of M. charantia were purchased from Farming Association Corporation in Namwon, Republic of Korea. The dried and powdered aerial parts (1 kg) of O. japonicus and M. charantia were refluxed twice with distilled water (a sample/water ratio of 1:10 [w/w]) by stirring overnight using a homogenizer. The herbs yielded dark brown O. japonicus (187 g) and dark green M. charantia (146 g) extracts that were further lyophilized to complete dryness. In the experiment we used the dried samples containing the O. japonicus and M. charantia extracts (OME) in an 8:2 ratio. The main components of OME were quantitatively analyzed by high-performance liquid chromatography analysis. And the results are shown in Table 1.
High-Performance Liquid Chromatography Analysis
Animals and experimental protocol
We used 5-week-old male db/db mice and age-matched wild-type C57BL/Ksj-db/+ (db/+) mice for this study. The mice were purchased from Taconic Farms, Inc. (Samtako Bio Korea, O-San, South Korea) and maintained in standard conditions (24°C ± 2°C, 50 ± 5% humidity). They were fed a sterile standard chow diet and provided water ad libitum. We performed all experimental and animal management procedures in accordance with the requirements of the Animal Care and Ethics Committees of Chonbuk National University (CBNU 2018-038). After 2 weeks of adaptation period, db/+ (n = 6 per group) or db/db (n = 8 per group) mice were randomly divided into four groups by OME concentration as follows: 0, 100, 200, and 400 mg/kg/day (OME 0, OME 100, OME 200, and OME 400). OME was dissolved in normal saline, and the mice were orally administered either saline (vehicle, OME 0) or OME (100, 200, or 400 mg/kg/day) to db/+ or db/db mice once a day for 5 days per week during the experimental period of 6 weeks). Before necropsy, animals were fasted for 8 h. Standard necropsy techniques were used, and tissues were collected and prepared for future analysis.
Serum and hepatic biochemical measurements
We measured serum alanine aminotransferase (ALT) and aspartate aminotransferase (AST) using AM101-K spectrophotometric assay kits (ASAN Pharmaceutical, Hwasung, Korea). We determined triglyceride (TG) and total cholesterol (TC) contents in liver by an AM202-K spectrophotometric assay kit (ASAN Pharmaceutical). We quantified the absorbance of the samples at wavelengths of 490 or 550 nm using an EMax spectrophotometer (Molecular Devices, Sunnyvale, CA, USA).
Oral glucose tolerance test
The db/+ or db/db mice were fasted over 8 h and orally administered glucose at a dosage of 2 g/kg. Blood samples were obtained from the tail veins at 0, 30, 60, 90, and 120 min after glucose administration. Blood glucose concentrations were evaluated using a glucose analyzer (ACCU-CHEK; Roche, Basel, Switzerland).
Measurement of glycosylated hemoglobin levels
We hemolyzed the anticoagulant-treated whole blood samples and measured the concentrations of glycosylated hemoglobin (HbA1c) using Mouse HbA1c Assay Kits (Crystal Chem., Inc., Elk Grove Village, IL, USA) according to the manufacturer's instruction. We quantified the absorbance of the samples at a wavelength of 700 nm using an EMax spectrophotometer (Molecular Devices).
Histopathologic examination
For histological evaluations were made in hematoxylin and eosin (H&E)-stained liver sections by light microscopy (BX-51; Olympus Corp., Tokyo, Japan), tissues were fixed in neutral buffered formalin solution, routinely processed, and then embedded in paraffin. Tissue sections (4 μm thick) were prepared using a microtome (HM-340E; Thermo Fisher Scientific, Inc., Waltham, MA, USA) and placed on glass slides. We performed H&E staining according to standard techniques. We analyzed total pancreas section images using a light microscope and digital image software (cellSens Standard; Olympus Corp.). Data are expressed as mean of islet area of per field in pancreas.
Oil Red-O staining
To detect cellular lipid contents, we performed Oil Red-O staining using a commercial staining kit (Scytek Lab., Logan, UT, USA) according to the manufacturer's protocol. Briefly, frozen liver sections were washed with propylene glycol for 5 min at room temperature, stained with heated (60°C) Oil Red-O solution for 20 min, and counterstained with hematoxylin for 1 min. Total liver section images were analyzed using a light microscope and digital image software (analySIS TS; Olympus Corp.). Data are expressed as percentages of the Oil Red O-positive area per field.
Immunohistochemistry
For immunohistochemistry (IHC) staining, livers were fixed in neutral buffered formalin solution, routinely processed, and then embedded in paraffin. Sections (4 μm thick) were then cut and placed on glass slides. Before the staining protocol proceeded, slides were deparaffinized, rehydrated, and submerged in antigen retrieval solution (Dako, Santa Clara, CA, USA) for 30 min at 100°C. Nonspecific binding was blocked with 3% peroxidase solution followed by 10% normal goat serum. These sections were then incubated with rabbit anti-mouse insulin antibody (Ab; Cell Signaling, Beverly, MA, USA) or rabbit anti-mouse glucagon antibody (Cell Signaling) overnight at 4°C. Negative control slides were incubated with nonimmune immunoglobulin under the same conditions. These sections were further incubated with biotin-conjugated rabbit Ig secondary antibodies. Immune complexes were detected using a DAB Substrate Kit from Vector Laboratories (Burlingame, CA, USA) according to the manufacturer's instructions. Finally, tissues were counterstained with hematoxylin and mounted.
RNA isolation, reverse transcription, and quantitative real-time polymerase chain reaction
Total RNA was isolated from cells or tissues using the Easy-Spin Total RNA extraction kit (GeneAll, Seoul, Korea). Following degradation of remaining DNA using DNase I containing RNase inhibitor (Toyobo, Osaka, Japan), samples were transcribed using ReverTra Ace® quantitative polymerase chain reaction (qPCR) real-time (RT) Master Mix (Toyobo) according to the manufacturer's protocol. Complementary DNA (cDNA) was used for RT PCR on a CFX96™ RT PCR Detection System (Bio-Rad Laboratories, Hercules, CA, USA) using SYBR Green I as a double-strand DNA-specific binding dye (TOPreal™ qPCR 2 × PreMIX; Enzynomics, Inc., Daejeon, Korea). After the reaction was completed, specificity was verified by melting curve analysis. Quantification was performed by comparing cycle threshold (Ct) values of each sample normalized to Ct value of glyceraldehyde-3-phosphate dehydrogenase. Sequences of PCR primers are listed in Tables 2 and 3.
Mice Primer Sequence of Genes Used for Quantitative Real-Time Polymerase Chain Reaction
ACCα, acetyl-CoA carboxylase alpha; ACCβ, acetyl-CoA carboxylase beta; Apo B, apolipoprotein B; FAS, fatty acid synthase; G6Pase, glucose-6-phosphatase; GAPDH, glyceraldehyde 3-phosphate dehydrogenase; GLUT2, glucose transporter type 2; GLUT4, glucose transporter type 4; L-FABP, liver-type fatty acid-binding protein; LPL, lipoprotein lipase; LXRα, liver X receptor alpha; PEPCK, phosphoenolpyruvate carboxykinase; PPARα, peroxisome proliferator-activated receptor alpha; SCD1, stearoyl-CoA desaturase 1; SREBP-1, sterol regulatory element-binding protein-1; SREBP-2, sterol regulatory element-binding protein-2.
Human Primer Sequence of Genes Used for Quantitative Real-Time Polymerase Chain Reaction
hFAS, human fatty acid synthase; hG6Pase, human glucose-6-phosphatase; hGAPDH, human glyceraldehyde 3-phosphate dehydrogenase; hGLUT2, human glucose transporter type 2; hGLUT4, human glucose transporter type 4; hPEPCK, human phosphoenolpyruvate carboxykinase; hPPARα, human peroxisome proliferator-activated receptor alpha; hSCD1, human stearoyl-CoA desaturase 1; hSREBP-1, human sterol regulatory element-binding protein-1.
Western blot analysis
Liver tissues were directly homogenized for 5 min on ice with an extraction buffer (T-PER; Thermo Fisher Scientific, Inc.). After centrifugation at 13,000 g for 15 min at 4°C, protein concentrations in the supernatant were measured using BCA Protein Assay kit (Thermo Fisher Scientific, Inc.) according to manufacturer's protocol. Protein was subjected to sodium dodecyl sulfate–polyacrylamide gel electrophoresis and then transferred to polyvinylidene difluoride membranes. Blocking was carried out using 5% bovine serum albumin Tris-buffered saline (20 mM Tris, 150 mM NaCl, pH 7.4) with 0.05% Tween-20 for 1 h at room temperature. Primary antibodies were diluted 1:1000 in a blocking solution and incubated overnight at 4°C. The following primary antibodies were used: phosphor Akt (p-Akt; Cell Signaling) and Akt (Cell Signaling). To detect antigen antibody complexes, PVDF membranes were incubated for 90 min at room temperature with horseradish peroxidase (HRP)-conjugated anti-rabbit IgG antibodies (Santa Cruz Biotechnology, Inc., Dallas, TX, USA). Immune complexes were enhanced using a chemiluminescent substrate (Bio-Rad Laboratories) and were visualized using ImageQuant™ LAS 500 (GE Healthcare Life Sciences, Pittsburgh, PA, USA). Protein expression levels were quantified with ImageQuant TL software (GE Healthcare Life Sciences).
Cell culture
HepG2 (Human hepatocellular carcinoma) cell line was obtained from KCTC (Daejeon, Korea). The cells were cultured in Dulbecco's modified Eagle's medium (DMEM; WelGENE, Inc., Seoul, Korea), plus 10% fetal bovine serum and 100 IU/mL penicillin, and 100 μg/mL streptomycin at 37°C in 5% CO2 humidified incubator. To measure the viability of HepG2 cells, cells were seeded into a 96-well plate (100 μL per well, 1 × 10⁴ cells/mL) and incubated at 37°C in a 5% CO2 incubator for 24 h to allow them to adhere and grow. They were then treated with OME at the indicated concentrations. Following incubation of cells with various concentrations of OME or O. japonicus extract (OJE) for 24 h, cell viability was evaluated using MTS assay Promega, Madison, WI, USA). The absorbance of sample was quantified at a wavelength of 490 nm using an EMax spectrophotometer. For in vitro experiments, cells were incubated overnight in serum-free medium. Following incubation, cells were treated with 0.4 mM palmitic acid (PA) to induce IR in HepG2 cells and then treated with OME at doses of 0, 10, and 100 and 1 μg/mL in DMEM media.
Statistical analysis
All data are expressed as mean ± standard error. We compared differences between multiple groups with one-way analysis of variance using SAS version 9.1 (SAS Institute, Inc., Cary, NC, USA) and conducted individual comparisons using Duncan's multiple range test. We considered P < .05 statistically significant. We compared differences between two groups using a two-tailed Student's t test and again considered P < .05 statistically significant.
Results
Effects of OME on diabetic parameters
We measured initial fasting blood glucose in all mice, and the levels did not differ among the groups (data not shown). After the 6-week experimental period, fasting blood glucose was significantly higher in the db/db mice compared to db/+ mice, and these effects decreased markedly with higher doses of OME administration in the db/db mice (Fig. 1A). The changes in fasting blood glucose during the experimental period were significantly lower in the db/db mice that received high doses of OME (Fig. 1B). Next, we conducted the oral glucose tolerance test to clearly evaluate the effects of OME on regulating blood glucose. After oral administration of glucose at a dose of 2 g/kg body weight, the blood glucose levels in the db/db mice peaked at 30 min. The increased blood glucose was recovered at 120 min in db/db mice treated with OME, whereas the vehicle-treated db/db mice failed to return to baseline after 120 min (Fig. 1C). Consistent with these findings, high-dose OME effectively decreased HbA1c in db/db mice (Fig. 1D).
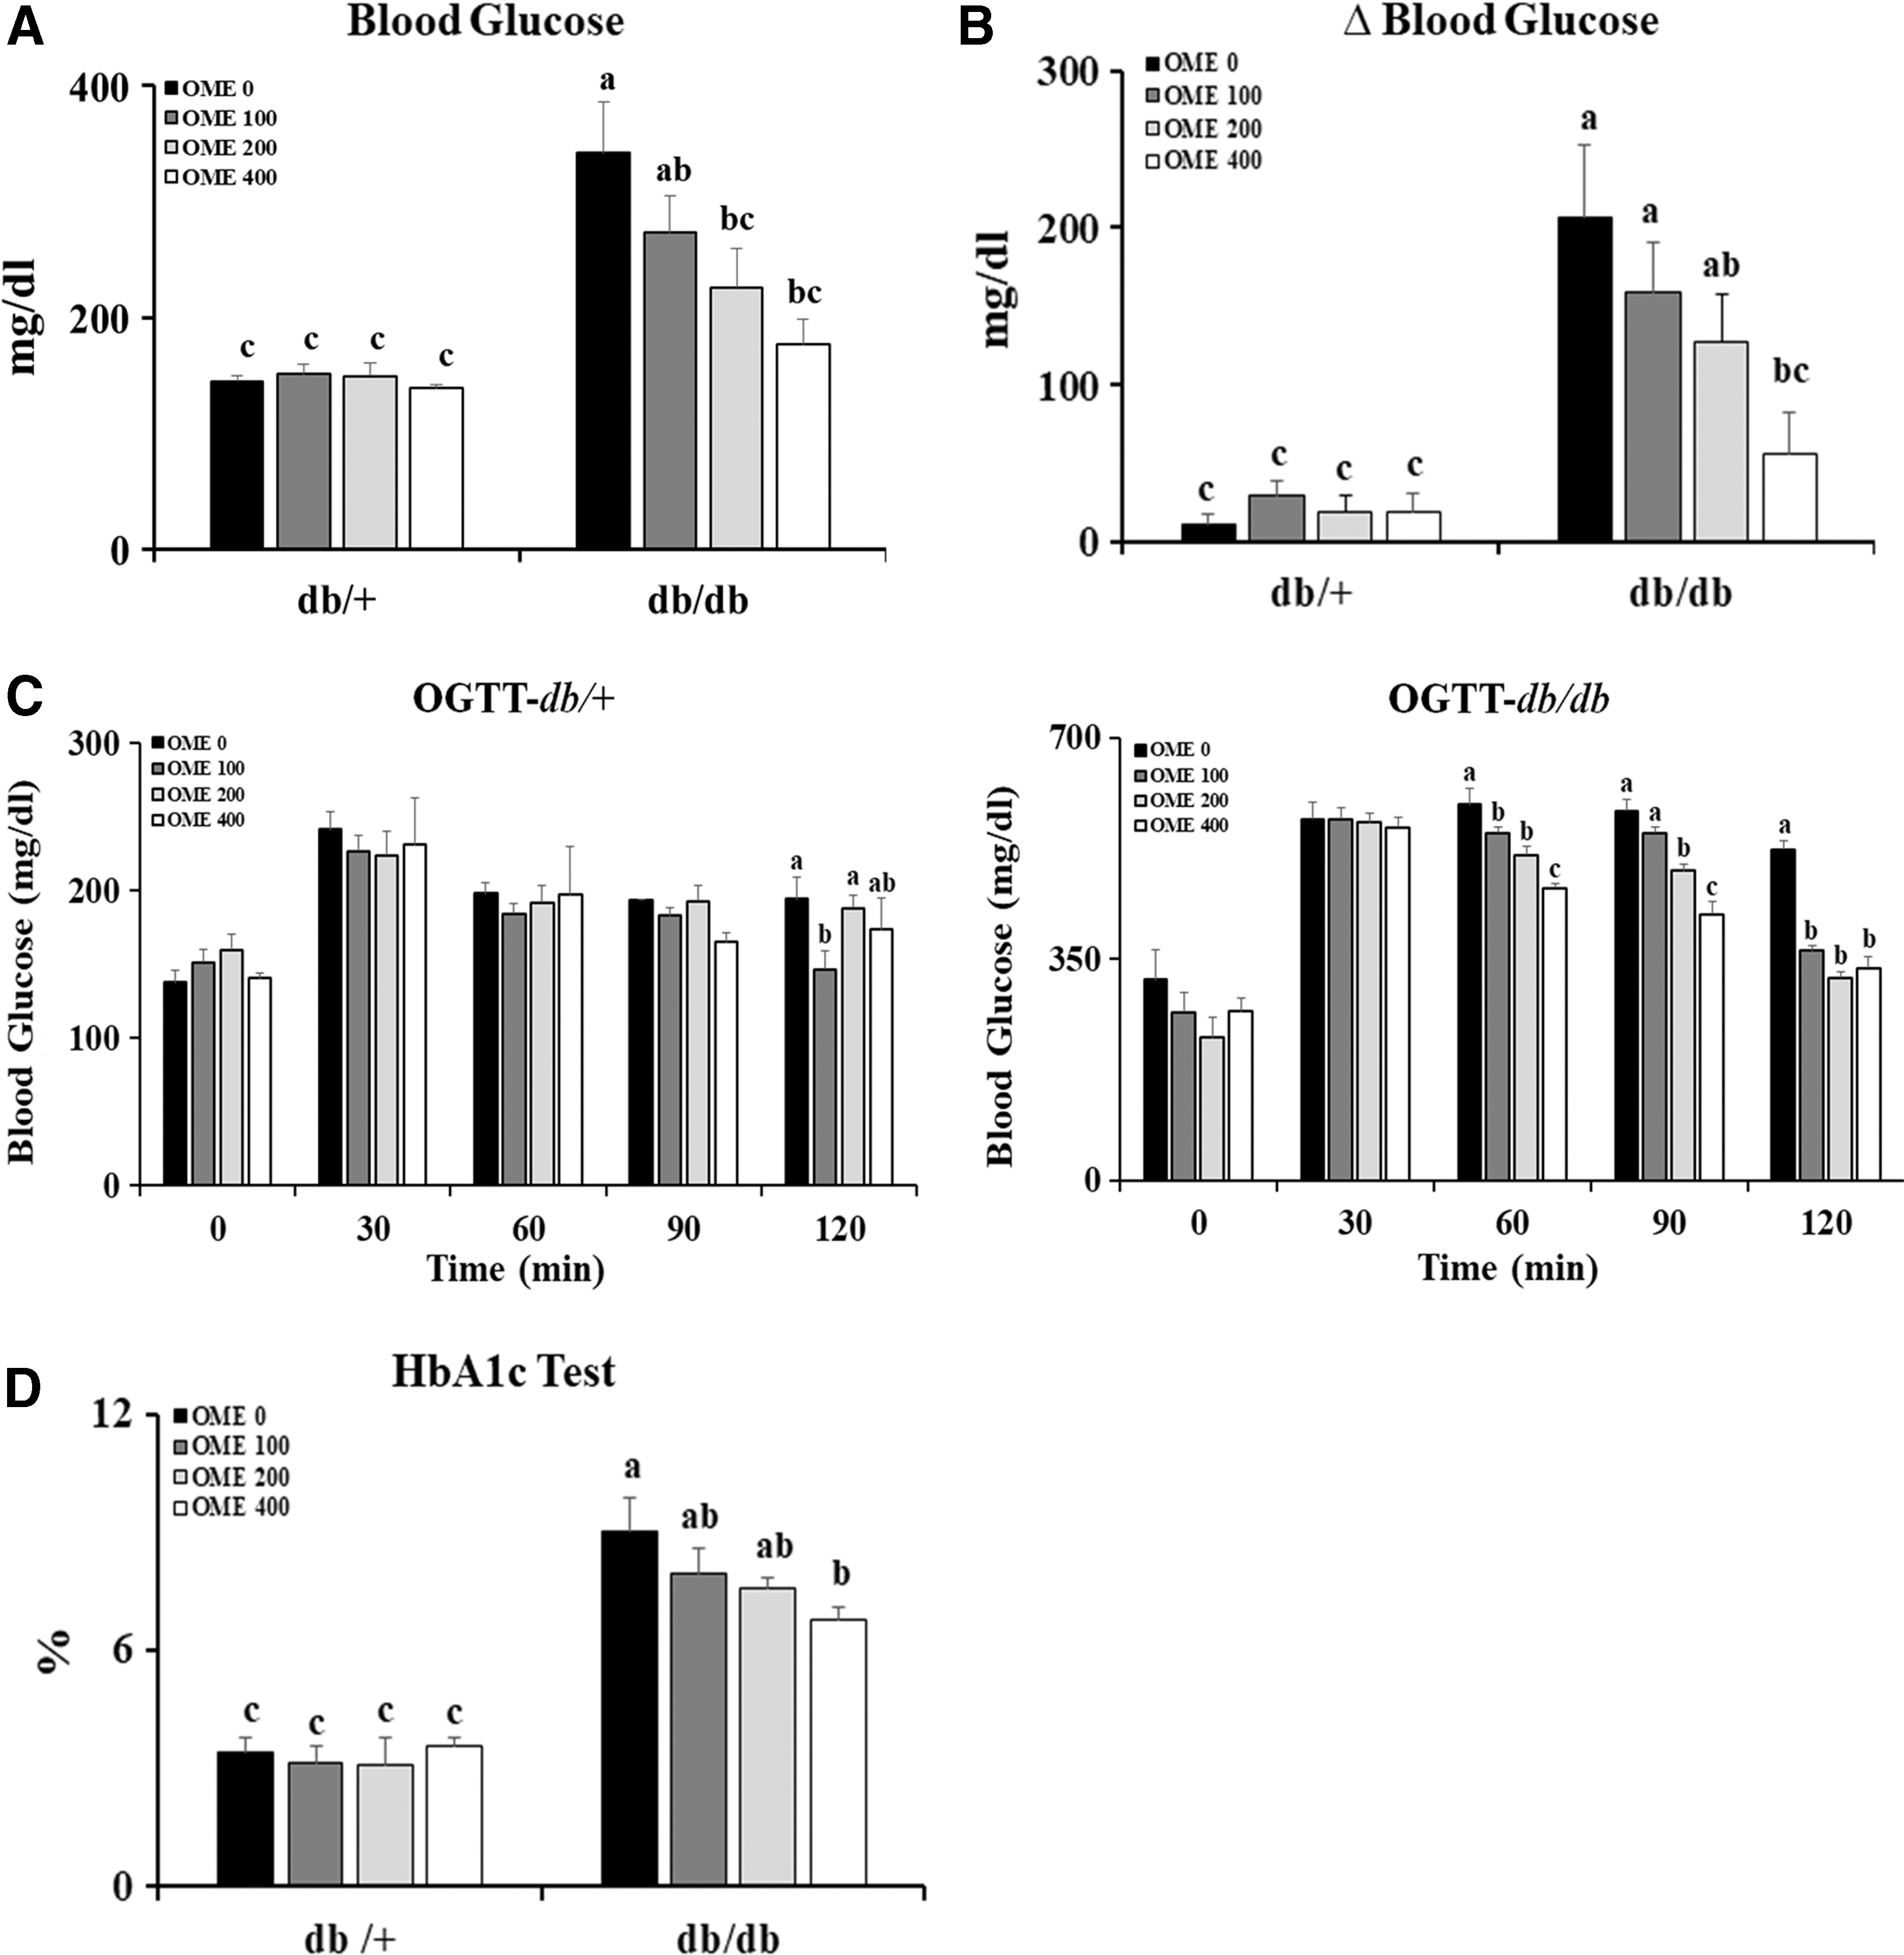
Effects of OME on blood glucose levels. The db/+ or db/db mice were administered with indicated concentrations of OME (0, OME 100, OME 200, and OME 400) for 6 weeks. After 6 weeks,
Effects of OME on islet morphology and glucagon or insulin expression
We further investigated whether the effects of OME on T2D severity were related to pancreatic β cells. Due to IR, the db/db mice displayed significantly larger islet areas than did the db/+ mice. Notably, the islets in the db/db mice treated with OME were significantly smaller than those in the vehicle-treated db/db mice (Fig. 2A, B). IHC analysis showed that the db/db mice treated with OME contained high-intensity insulin-staining cells whereas glucagon-staining cells conversely decreased and restored normal cell distribution resembling that in the islets from db/+ mice (Fig. 2C). These findings demonstrate that OME has beneficial effects on pancreatic β cells in T2D mellitus.
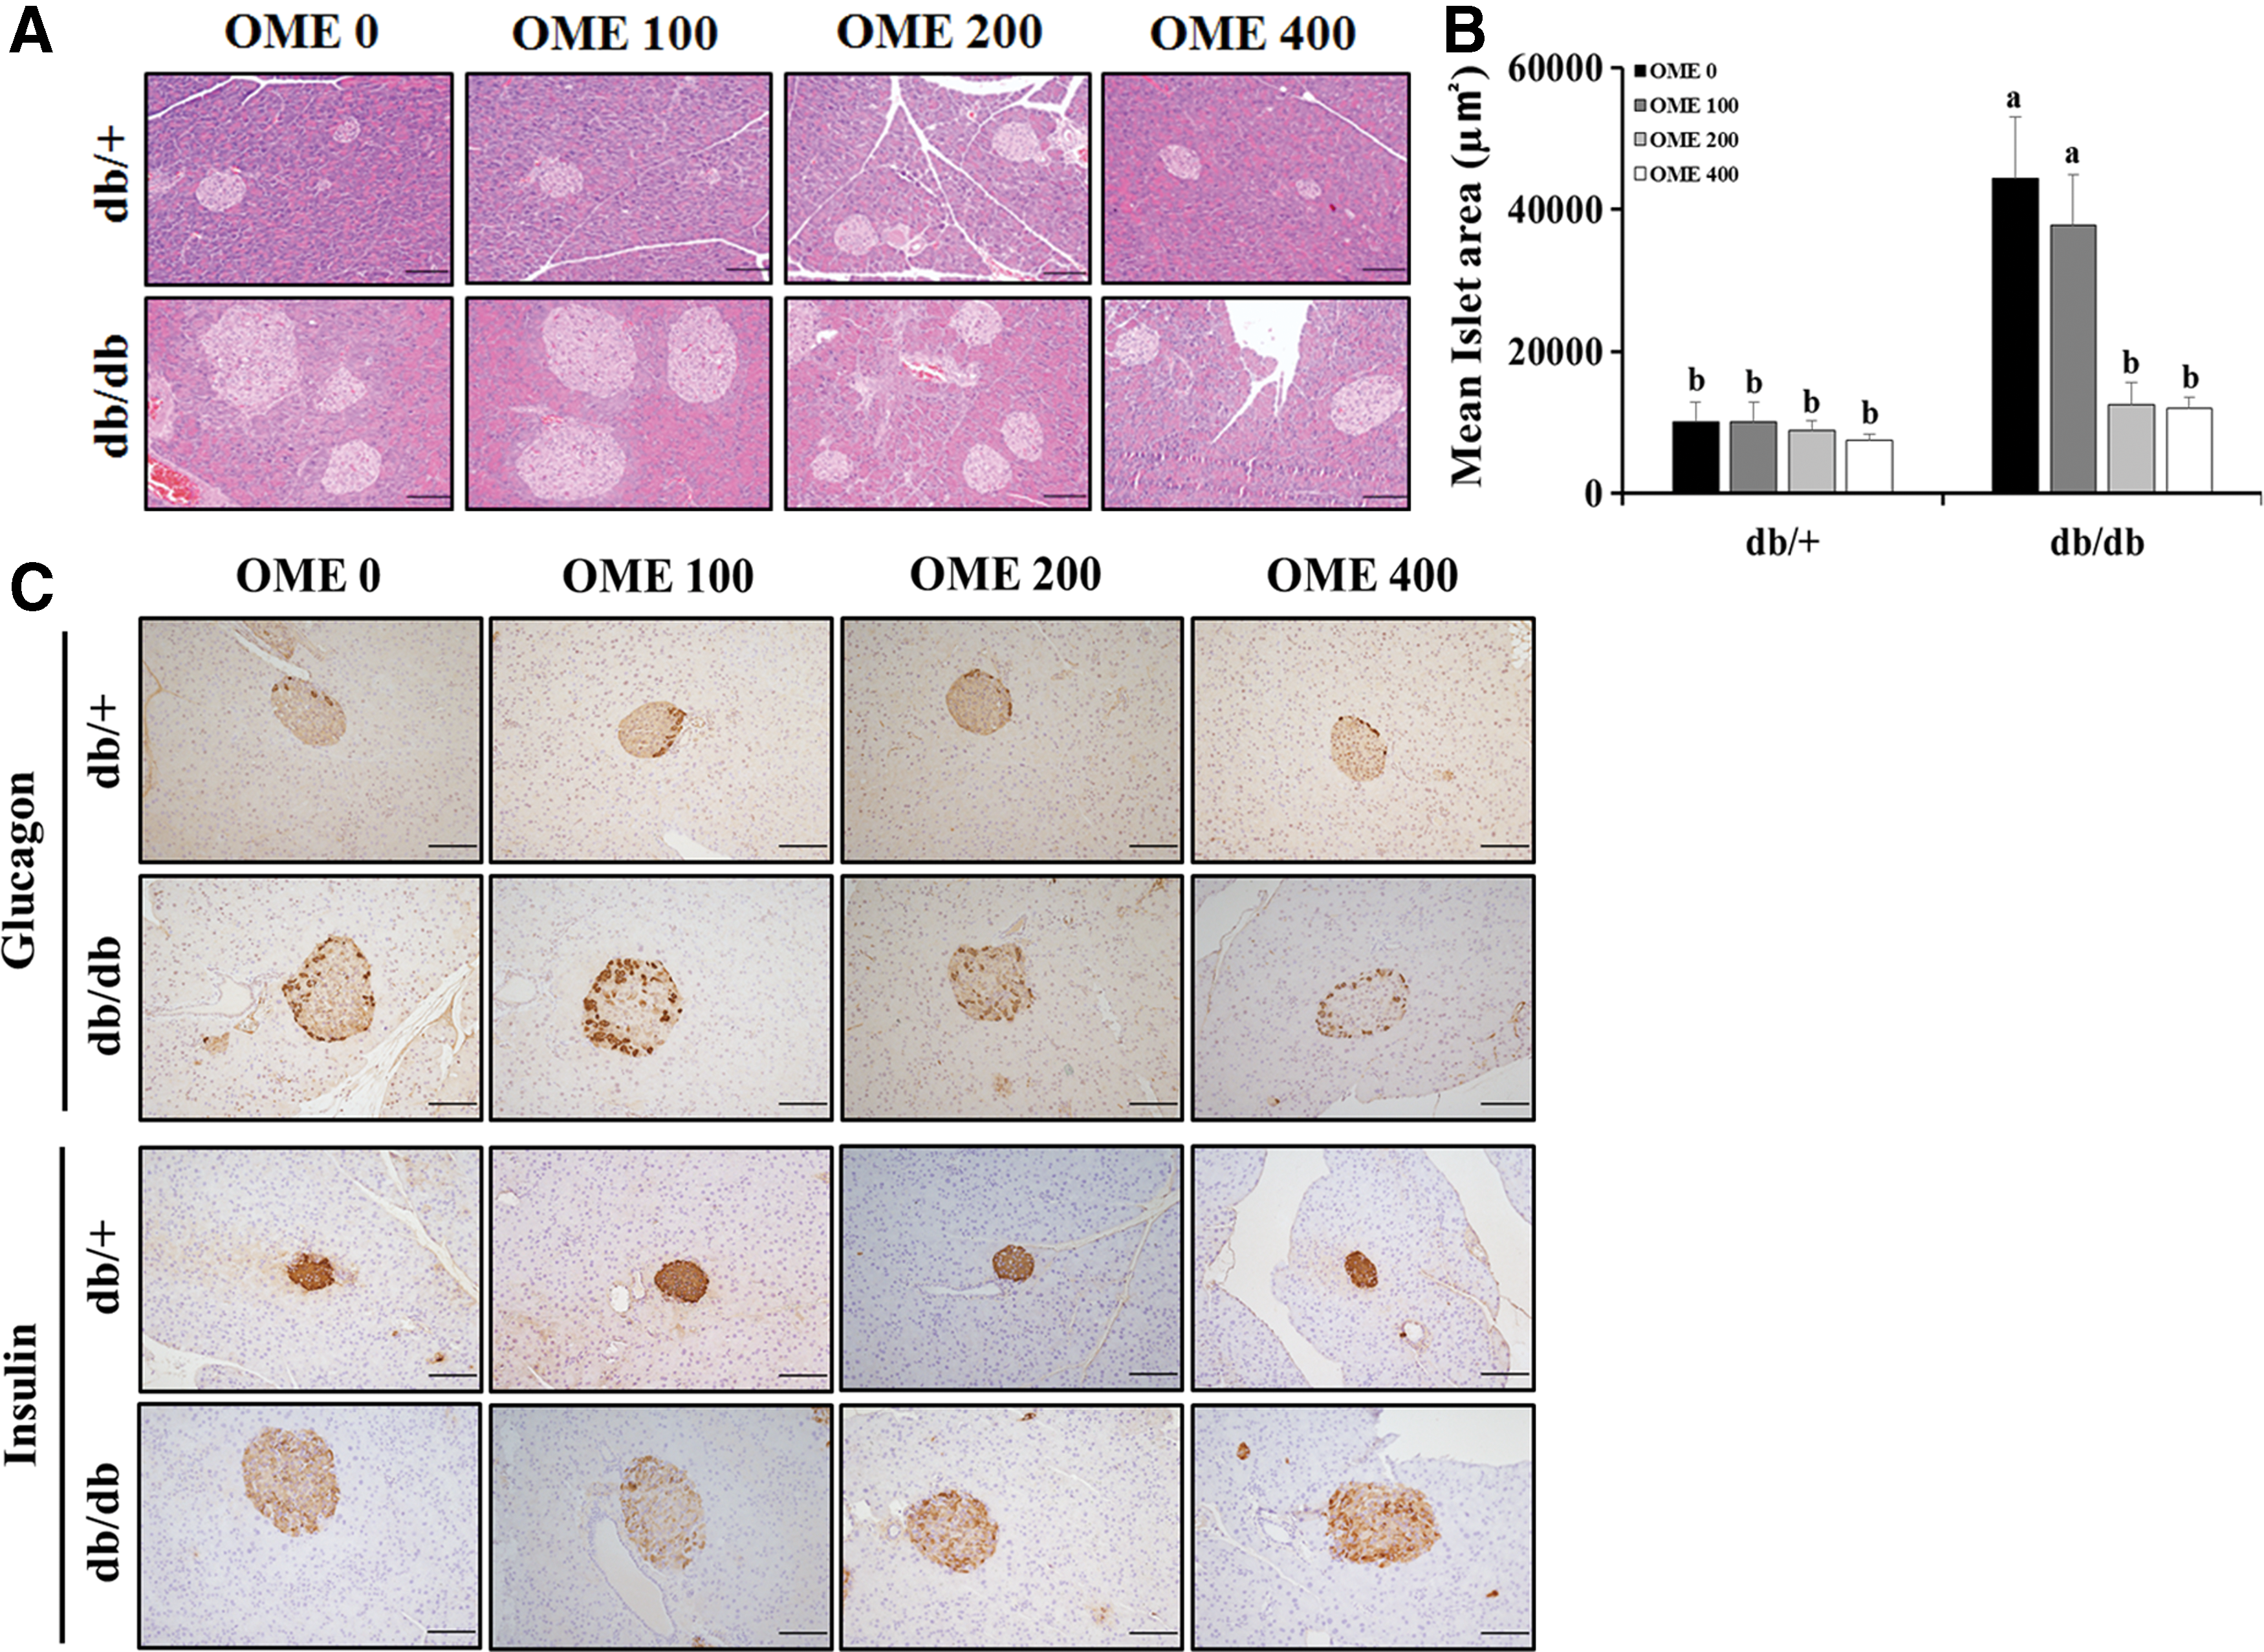
Histopathologic examination in pancreas.
OME administration improves diabetic liver injury and pathologic changes
As shown in Figure 3A and B, the liver sizes and weights decreased slightly but not significantly with OME administration, and we observed similar patterns for body weight and liver/body weight ratio. Histopathologic examination revealed marked hepatocellular hypertrophy, ballooning degeneration, and steatosis in db/db mice, and these lesions decreased gradually with OME administration (Fig. 3C). Similarly, we observed reduced diabetic liver injury in db/db mice treated with OME confirmed by measuring the levels of serum biochemicals including ALT and AST (Fig. 3D). Additionally, hepatic lipid contents (TG and TC) in the db/db mice treated with OME were significantly lower than those in the vehicle-treated db/db mice. In particular, high doses of OME treatment markedly decreased hepatic TC in db/+ mice (Fig. 3E). Taken together, these results demonstrate that OME exerts antidiabetic effects by reducing diabetic liver injury and its related steatosis and regulating blood glucose.
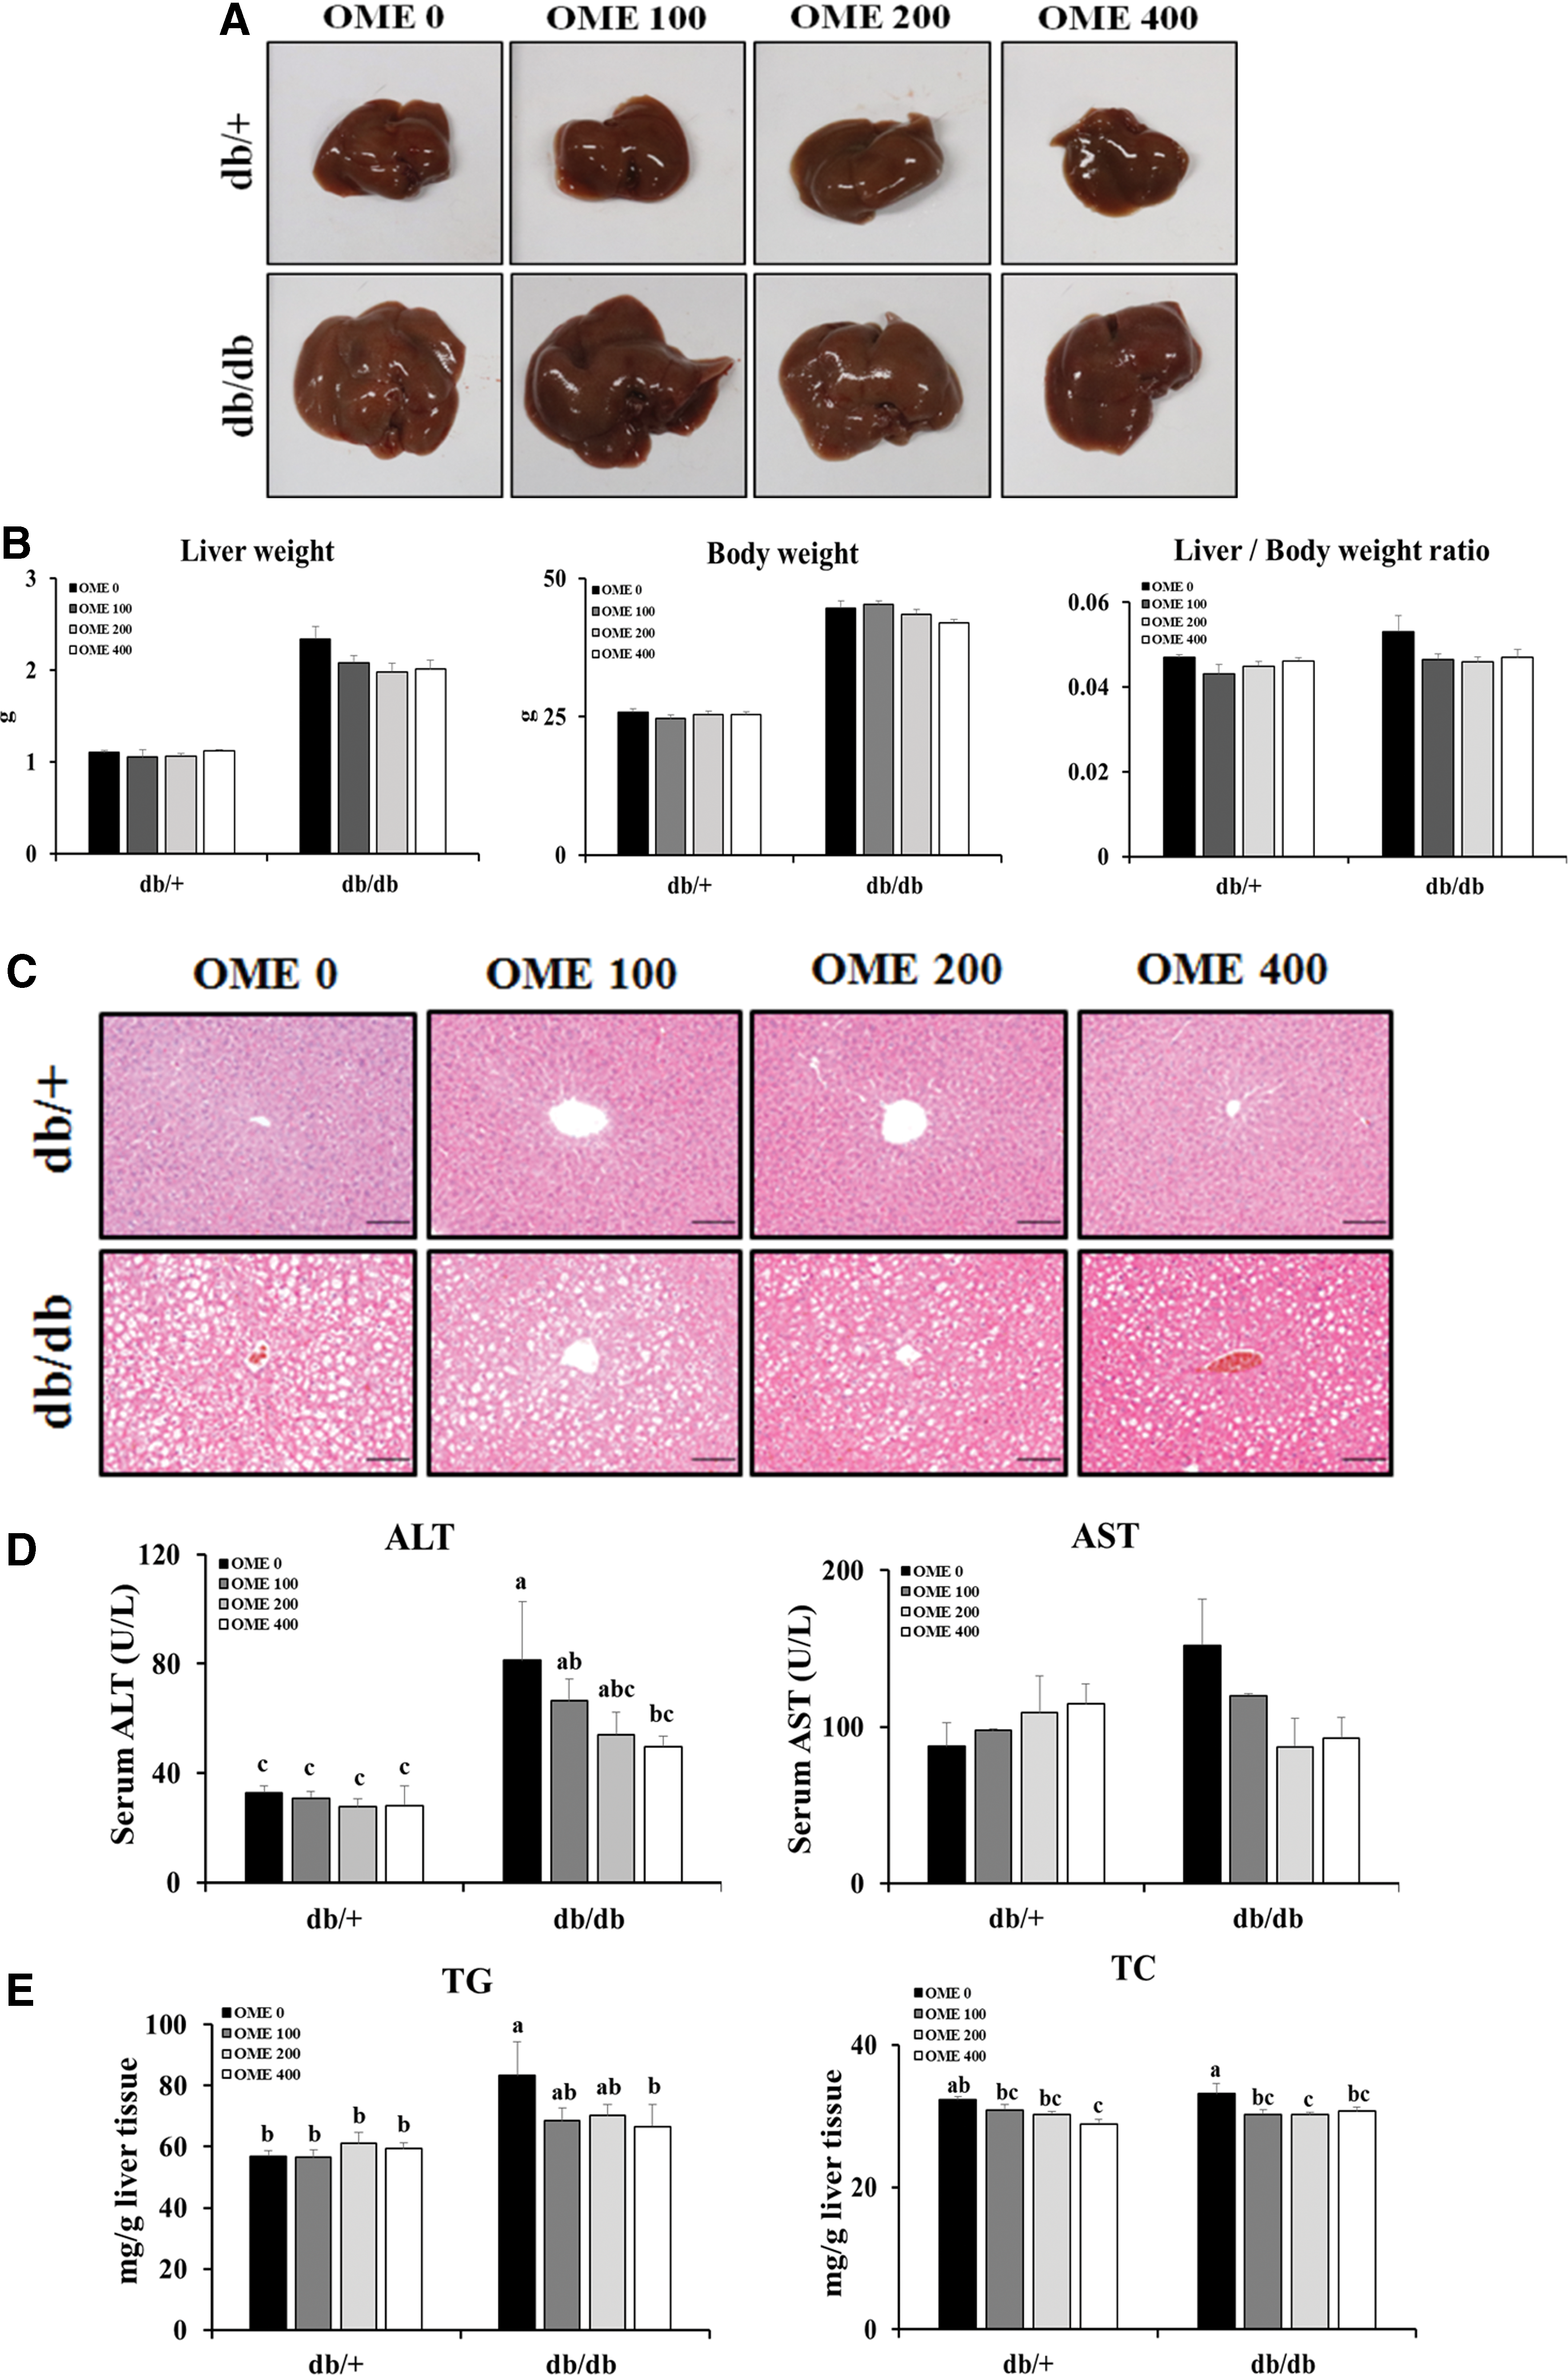
Effects of OME treatment on diabetic liver injury.
OME administration modulates hepatic lipid metabolism resulting in reduced hepatic steatosis in T2D mellitus
To further support the role of OME in the lipid accumulation in livers, we performed Oil Red-O staining using fixed liver tissue sections. We observed significant hepatic pathological changes concerning steatosis in the livers of the db/db mice. Consistent with the hepatic lipid contents, the Oil Red-O positive areas in the livers of the db/db mice administered OME were significantly smaller than those in the vehicle-treated db/db mice (Fig. 4A). Based on these results, we further explored the role of OME in hepatic lipid accumulation or expression levels of metabolism-related factors. As shown in Figure 4B and C, hepatic expression of lipid metabolism-related genes such as Apolipoprotein B, lipoprotein lipase, and L-fatty acid binding protein or de novo lipogenesis-related genes including acetyl-CoA carboxylase alpha (ACCα), acetyl-CoA carboxylase beta (ACCβ), fatty acid synthase, and stearoyl-CoA desaturase 1 (SCD1) in db/db mice treated with OME was significantly lower than those in vehicle-treated db/db mice. Because the expression of the above lipogenic genes is regulated by transcriptional factors associated with sterol regulatory element-binding protein (SREBP), its co-regulator liver X receptor α, or peroxisome proliferator-activated receptors (PPARs), we measured their expression to support the effects of OME on hepatic steatosis in T2D mellitus. Consistently, we observed significantly less expression of SREBP-2 or greater expression of PPARα in the livers of db/db mice treated with OME compared with those of vehicle-treated db/db mice (Fig. 4D).
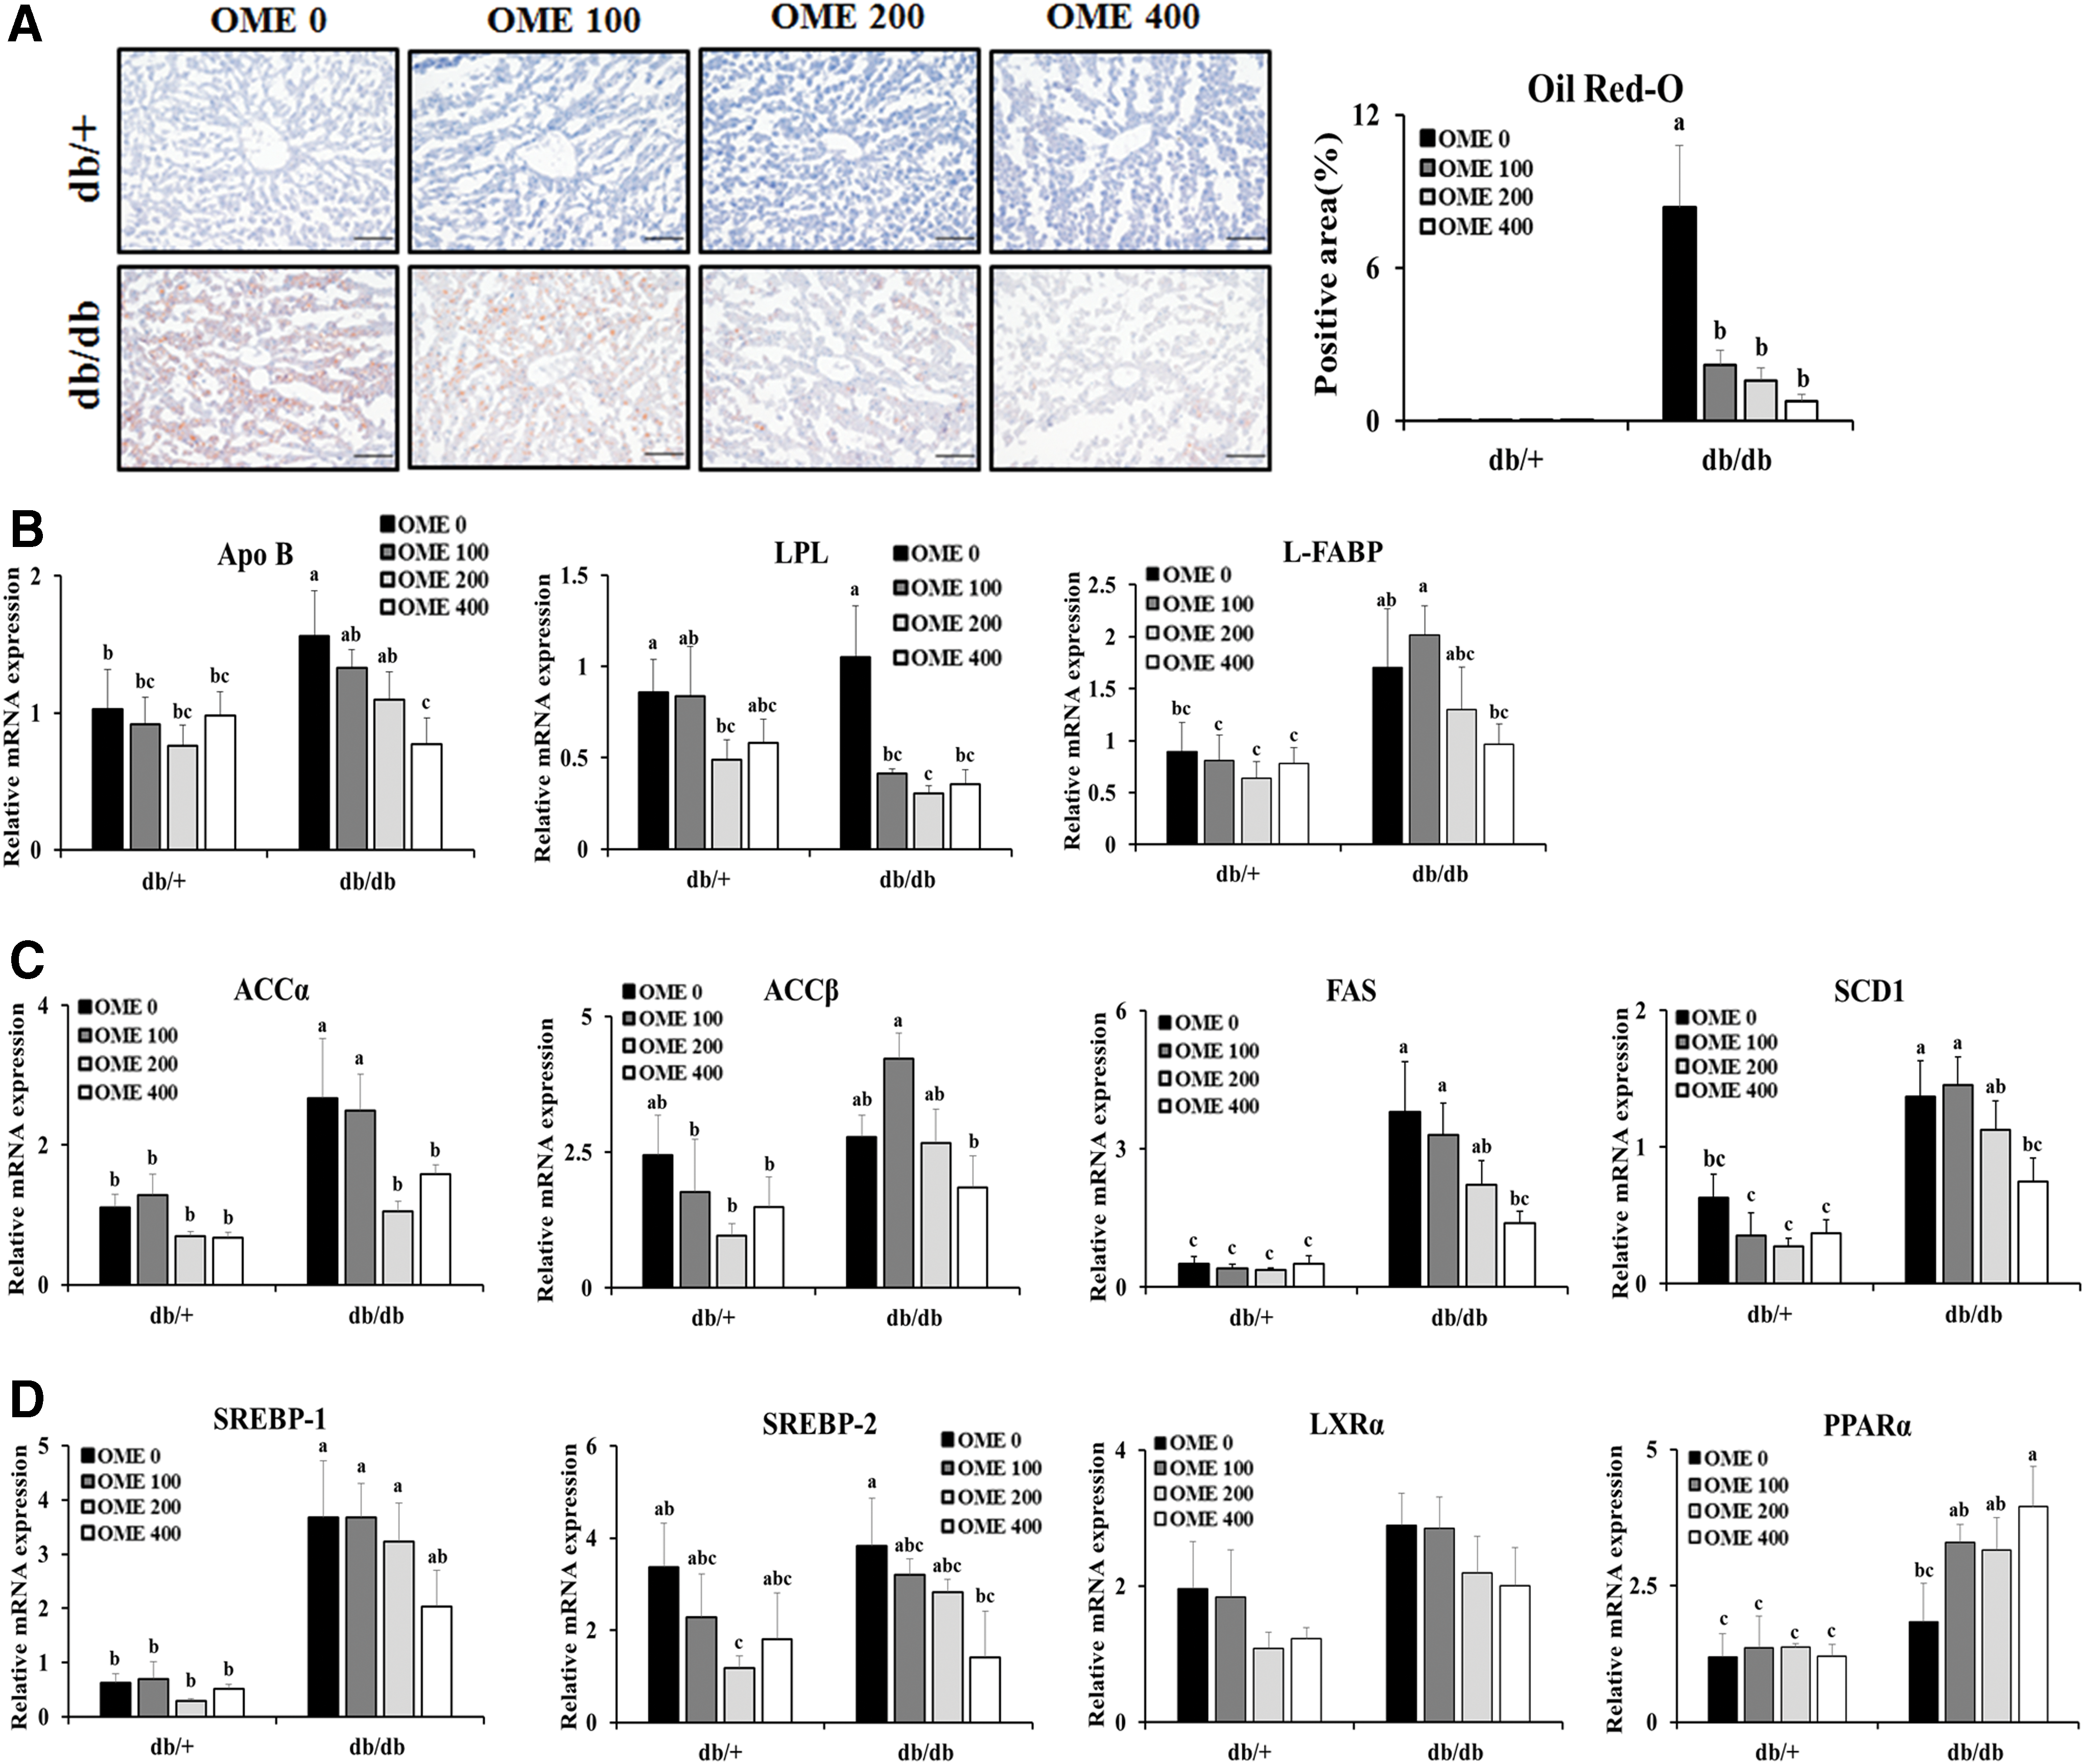
OME administration diminishes lipid accumulation in livers.
OME administration reverses the impairment of the insulin signaling pathway
To further support the antidiabetic effects of OME, we measured the insulin signaling pathway, both Akt activation (phosphorylation) and the expression levels of gluconeogenic genes including glucose-6-phosphatase (G6Pase) and phosphoenolpyruvate carboxykinase (PEPCK). Because activation of insulin-inducing Akt signaling promotes the expression or translocation of glucose transporter type 2 (GLUT2) and GLUT4, which play key roles in mobilizing glucose throughout the body, 22,23 we first determined the activation levels of Akt signaling by performing immunoblot analysis. The results showed significantly less Akt phosphorylation in the of the db/db mice than in those of the db/+ mice, and the impaired Akt activation was restored by OME administration in the livers of the db/db mice (Fig. 5A). Consistently, although hepatic GLUT2 slightly but not significantly increased, we observed significantly greater expression of hepatic GLUT4 in the db/db mice treated with OME (Fig. 5B). A comparison of the relative expression levels of G6Pase and PEPCK revealed significantly lower G6Pase expression in the livers of the db/db mice with OME administration (Fig. 5C). Based on the above results, OME administration enhanced insulin sensitivity and inhibited hepatic gluconeogenesis by modulating gluconeogenic enzymes such as G6Pase.

OME administration improves impaired insulin signaling.
Treatment of OME regulates the expression of lipogenic and gluconeogenic genes in PA-treated HepG2 cells
To more clearly demonstrate the effects of OME on T2D, we next performed in vitro experiments using HepG2 cells treated with PA to mimic in vivo conditions. After we determined appropriate concentrations of OME without cytotoxicity (Fig. 6A), we incubated HepG2 cells with the indicated concentrations of OME; the results showed that treatment with OME significantly decreased lipid accumulation-related genes and increased PPARα in HepG2 cells cultured in PA-treated media, the same as the in vivo results (Fig. 6B). Furthermore, we observed increased GLUT4 expression in PA-treated HepG2 cells with OME treatment (Fig. 6C). Consistent with the in vivo findings, G6Pase expression decreased significantly with OME treatment in HepG2 cells regardless of treatment with PA; however, there were no significant differences in PEPCK expression (Fig. 6D). Because the main components of OME are the extracts from O. japonicus, we evaluated whether the above described effects of OME could be reproduced using OJE. We first determined appropriate concentrations of OJE without cytotoxicity (Fig. 7A). Consistent with the results shown in Figure 6B–D, we observed similar patterns with OJE treatment in PA-treated HepG2 cells. In particular, OJE treatment significantly decreased SCD1 and PEPCK expression, and increased the expression of PPARα, in HepG2 cells without PA treatment (Fig. 7B, C). Collectively, these findings together with the in vivo results suggest that OME and its main component, OJE, have beneficial effects against PA-induced lipogenesis and IR in HepG2 cells.
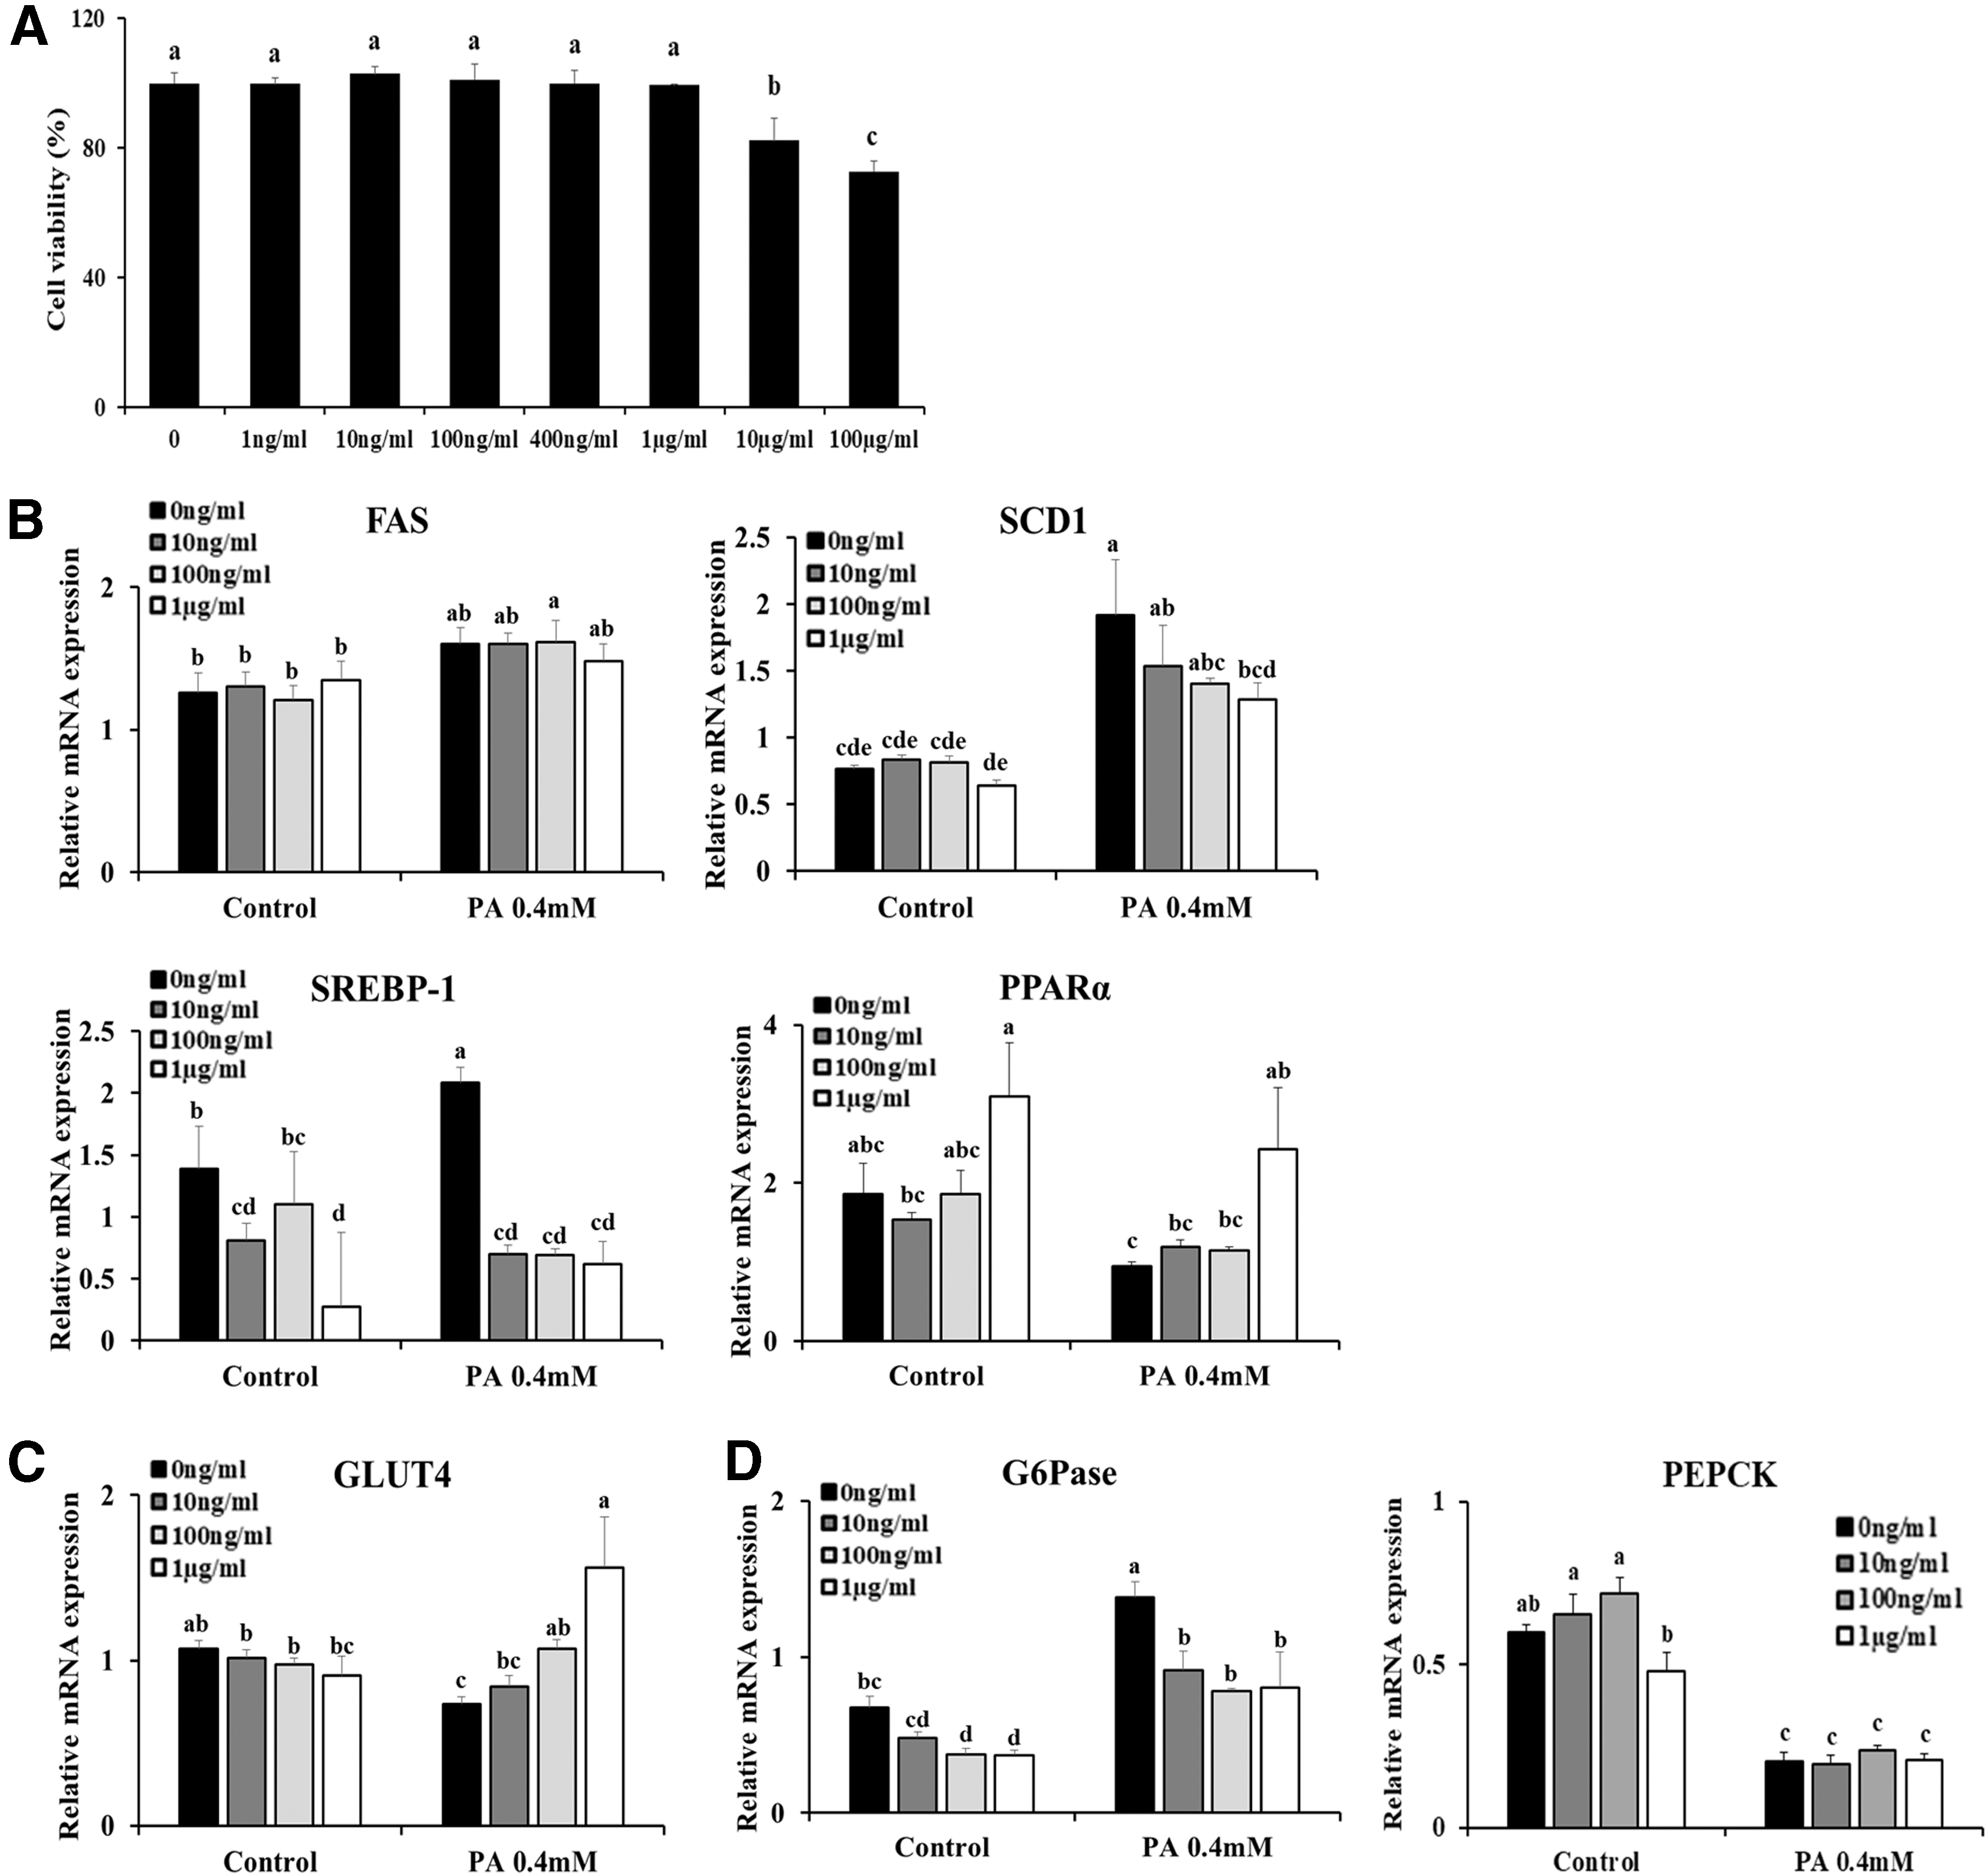
Treatment with OME regulates lipogenesis and gluconeogenesis in T2D in vitro.

Effects of OJE on T2D in vitro. PA-treated HepG2 cells were treated with OJE at a dose of 1 μg/mL.
Discussion
T1D is an autoimmune disease characterized by cellular-mediated autoimmune β-cell destruction in the pancreas resulting in absolute insulin deficiency. In contrast to T1D, T2D is closely associated with obesity and metabolic disorder resulting in IR and β-cell dysfunction. 24 Recently, numerous studies have indicated that immune dysregulation with increased circulating inflammatory cytokines is one of the main features of patients with obesity and T2D. Therefore, innate and adaptive immunity can be also involved in the development and/or progression of T2D and its related metabolic inflammation. 24,25 Consistent with this notion, recent study findings have shed new light on immune modulation as an emerging and promising therapeutic strategy for T2D management. 25
Recently, various ingredients in O. japonicus have been identified as having biological activities, including flavonoids, fatty acid ester, triterpense, phytosterol, and aromatic acids. 7,8 Pharmacologically, O. japonicus has been reported to possess antioxidant, 8 antiangiogenic, 26 and anticancer activities. 27,28 Moreover, one study revealed anti-inflammatory effects in lipopolysaccharide-stimulated RAW 264.7 cells and differentiated THP-1 cells by inhibiting nuclear factor kappa B and mitogen-activated protein kinase. 29,30 Another recent study showed that O. japonicus ameliorated hepatotoxin-mediated liver fibrosis by regulating the transforming growth factor-β1/Smad pathway and through antioxidative potential. 31 Based on these results together with previous findings concerning beneficial effects of O. japonicus or its ingredients on diabetic inflammation, 12 –15,17 we first postulated that OME protect against glucose dysregulation by modulating metabolic inflammation in T2D mellitus. However, our results showed that the liver expression levels in the db/db mice (data not shown) of inflammatory cytokines including tumor necrosis factor-α and interleukin-1β decreased slightly but not significantly with OME administration. To clarify the role of OME on T2D-related inflammation, further experiments are needed with longer periods of OME administration.
It is well known that the phosphatidylinositol-4,5-bisphosphate 3-kinase (PI3K)-Akt signaling pathway is critical in insulin signal transduction. Following insulin stimulation, PI3K-Akt activation and its associated translocation of GLUT2 or 4 to the plasma membrane decreased and subsequently induced Forkhead box O1-mediated gluconeogenic gene expression. 32 Although Akt activation accelerates the hepatic mammalian target of rapamycin complex 1 (mTOR1)/SREBP signaling pathway, leading to increment of lipogenesis in physiological conditions, 33 hepatic insulin signaling fails to inhibit gluconeogenesis due to decreased Akt activation, but continues to promote lipogenesis with highly increased mTORC1 activation in the IR state. These findings suggested that the mTORC1/SREBP signaling pathway is also activated by amino acids in a way that was not mediated by insulin-PI3K/Akt signaling. 34 Furthermore, excessive blood glucose might participate in lipogenesis as a substrate that gradually exacerbates abnormal glucose and lipid metabolism, resulting in severe metabolic disorder and IR. 35 Hence, the activation of Akt and suppression of the mTORC1/SREBP pathway might play an essential role in managing obesity, IR, and its related metabolic syndrome. Based on these notions in combination with findings from the current study, OME administration restored the decreased Akt activation in the livers of db/db mice. Consistent with this result, we observed increased hepatic GLUT4 expression and decreased expression of gluconeogenic genes such as G6Pase with treatment with OME in db/db mice. Furthermore, we observed decreased expression of lipid metabolism-related genes in the livers of db/db mice treated with OME. These results were supported by our in vitro experiments, which showed results consistent with the in vivo results.
Because we used OME in the in vivo experiments, we conducted additional in vino experiments using solely the extract from O. japonicus. Similar to the above mentioned in vitro results, we observed that treatment with OJE alleviated PA-induced gluconeogenesis and lipogenesis in HepG2 cells. Therefore, additional in vivo experiments need to be performed to verify the antidiabetic efficacy of the single extract of O. japonicus. Moreover, oxidative stress and metabolic inflammation need to be further assessed to clearly demonstrate beneficial effects of OJE in various organs including liver, adipose tissue, and muscle on T2D mellitus.
In conclusion, we herein demonstrate that OME has antidiabetic effects on T2D mellitus, suggesting that it may have prophylactic and therapeutic efficacy for T2D.
Footnotes
Acknowledgment
This research was supported by a grant (2017-Na-6) from the Jeonbuk Research & Development Program funded by the Jeollabuk-do Provincial Government.
Author Disclosure Statement
The authors declare that no competing financial interests exist.